Performance Measurement System (PeMS) Data Source
Data is obtained from the Caltrans Performance Measurement System (PeMS). Data is collected in real-time from nearly 40,000 individual detectors spanning the freeway system across all major metropolitan areas of California.
PeMS is also an Archived Data User Service (ADUS) that provides over ten years of data for historical analysis. It integrates a wide variety of information from Caltrans and other local agency systems, including:
- Traffic Detectors
- Incidents
- Lane Closures
- Toll Tags
- Census Traffic Counts
- Vehicle Classification
- Weight-In-Motion
- Roadway Inventory
To use PeMS, you must apply for an account. Registration is free and takes only a few minutes. Accounts are typically approved within one to two business days. For questions regarding PeMS, please contact PeMS Support.
PeMS 14 versus PeMS 12:
With the release of PeMS 14, the algorithms that compute speed were updated to more accurately represent those speeds. Because delay calculations are based on speed, the changes are intended to improve the accuracy of delay calculations. Historical data was reprocessed in PeMS 14 using the new algorithms. Therefore, PeMS 14 portrays mobility data in California over the life of the database. Read the release notes for PeMS 14.0. (PDF)
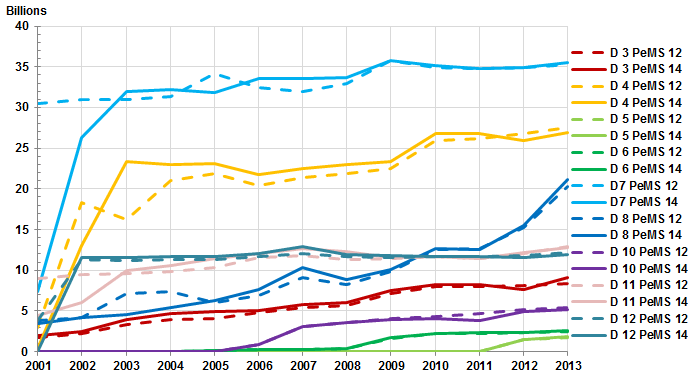
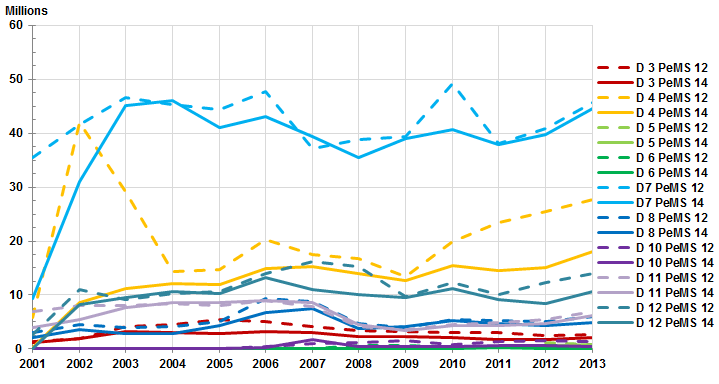
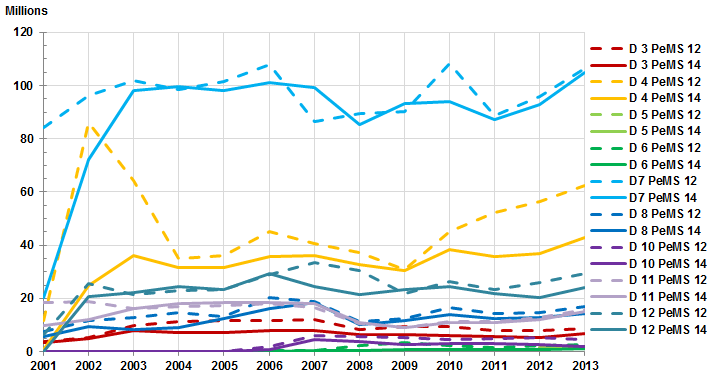
Reports on this website compare data from each version separately. The 2013 reports are based entirely on data from PeMS 12. The 2014 reports are based entirely on data from PeMS 14. The charts below show how data compare between the two versions over the period 2001-2013, when much of the detection was deployed.
Another change in PeMS 14 was the removal of conventional highways—state routes that never meet free flow conditions—from the calculations performed by the software to create sums of performance measures when queried. Districts 3, 5, 10, and 11 have conventional highways whose data was included in PeMS 12, but not PeMS 14. However, sorting out whether the difference between the two versions is due to the algorithm change, the absence of conventional highway data, or an organic change in mobility, is difficult.
Vehicle Miles of Travel
Vehicle miles of travel (VMT) in both versions follows roughly the same curve for all districts. Larger gaps between the solid and dashed lines for a district might be related to adjustments to the sensitivity of detectors (fine-tuning) after deployment, a more notable occurrence during the system build out period than in the past five years.

Vehicle Hours of Delay at 35 miles per hour:
Vehicle hours of delay at 35 miles per hour (VHD35) varies greatly from PeMS 12 to PeMS 14 for Districts 4, 12, 7, and several others to a lesser extent. The trend is downward for all districts. Three factors are responsible for these disparities: algorithm change, the removal of conventional highways, and organic change in mobility.

Vehicle Hours of Delay at 60 miles per hour:
Vehicle hours of delay at 60 miles per hour (VHD60) varies greatly from PeMS 12 to PeMS 14 for all districts, especially Districts 4 and 12. The trend is downward for all districts except District 5 (San Luis Obispo).


