
Design Information Bulletin No 87-01 (DIB-87-01)
Hybrid Streambank Revetments: Vegetated Rock Slope Protection
Table of Contents
1.1 Introduction
2.1 Fundamentals of Stream Processes
2.1.1. Basic Stream Pattern
2.1.1.1 Straight Streams
2.1.1.2 Braided Streams
2.1.1.3 Meandering Streams
2.1.2 Sediment Transport.
2.1.3 Stream Channel Form
2.1.4 Floodplain Form
2.1.5 Streambank Erosion
3.1 Positive and Negative Effects on Streams from vegetation Use in Bank Stabilization
4.1 Hybrid Revetment Design Premise
5.1 Hybrid Revetment Design-Responsible Charge Explanation
6.1 Pre-Construction Modeling and Analysis
6.1.1 Hydrology
6.1.2 Hydraulics
6.1.2.1 Pre-Construction Manning's n-Value Selection
6.1.2.2 Pre-Construction Hydraulic Model
7.1 Hybrid Revetment Design
7.1.1 RSP Calculations
7.1.1.1 Potential Scour Depth
7.1.1.2 RSP Size
7.1.1.3 RSP Design Height
7.1.1.4 RSP Design Length
7.1.2 Gravel Filter
7.1.3 Grading
7.1.4 Vegetation
8.1 Post-Construction Modeling and Analysis
8.1.1 Post Construction Manning's n-Values
8.1.2 Post-Construction Hydraulic Model
9.1 Hybrid Revetment Project Development
10.1 Construction Order of Work
11.1 References
12.1 Appendices
Appendix A: Hydraulic Model Calibration
Appendix B: Sample Hydraulic Models
Appendix C: Sample Hybrid Revetment Plan Sheets & Design Cross Sections
Appendix D: Gravel Filter Nonstandard Special Provision
Table of Figures
Figure 1: Highway 190 Roadway Failure, Death Valley, Summer 2004
Figure 2: Highway 150 Bridge Failure, Central Coast, Winter 2005
Figure 3: Straight Stream Pattern Schematic (Admiraal 2007)
Figure 4: Braided Stream Pattern Schematic (Leopold et al 1992)
Figure 5: Meandering Stream Pattern Schematic (Admiraal 2007)
Figure 6: Floodplain Cross Section
Figure 7: Weaver Creek, Root System through Soil and RSP
Figure 8: Navarro Creek (December 2012), Main Channel Bank
Figure 9: Cedar Creek (July 2005), Main Channel Bank-Toe
Figure 10: Cedar Creek (December 2011), Main Channel Bank-Toe
Figure 11: Cedar Creek (July 2005), Lower Limit of Medium Vegetation Density
Figure 12: North Fork Mattole River, Medium Vegetation Density
Figure 13: Rush Creek, High Vegetation Density
Figure 14: Design Height Exceeds Main Channel Capacity
Figure 15: Subgrade Cross Section
Figure 16: Hybrid Revetment Cross Section
Figure 17: Gibbson Creek, Cuttings through RSP (Right After Installation, Fall 2010)
Figure 18: Gibbson Creek, Cuttings through RSP (Summer 2010)
Figure 19: Live Cutting Vertical Orientation
Figure 20: Live Cutting Perpendicular Orientation
Figure 21: Live Cutting Detail
Figure 22: Weaver Creek (2012), Mature Vegetation in Plastic Tubes
Figure 23: Weaver Creek (1997), Cuttings in Plastic Tubes Just After Installation
Figure 24: Active Channel Delineation (adapted from CDFW (2004))
Table of Tables
Table A: Main Channel Bed and Bank Surface Material (n0)
Table B: Main Channel Degree of Irregularity (n1)
Table C: Main Channel Cross Section Variation (n2)
Table D: Main Channel Relative Effect of Obstructions (n3)
Table E: Main Channel Vegetation Density (n4)
Table F: Main Channel Degree of Meandering (m5)
Table G: Floodplain Overbank n-values
Table H: Universal Gravel Filter Gradation
Table I: Piping Criterion Check, Universal Filter and RSP Interface
Table J: Permeability Criterion Check, Universal Filter and RSP Interface
1.1 Introduction
Streambank revetments are used to repair banks that have been damaged from scour and erosion commonly due to flood events, as well as prevent damage from future flood flows. Banks along curved sections of streams where impinging flow occurs are most susceptible to damage from scour. When streambanks are scoured, adjacent or nearby highway embankments, culverts, and bridges are left vulnerable to attack from hydraulic forces that may cause them to become unstable. If these facilities should become unstable, the safety of the traveling public using the highway system could be in question. For example, a stream that runs parallel to a highway will likely share its streambank with the highway fill slope. If lateral scour occurs in the streambank, the highway embankment and structural section could be undermined potentially causing collapse of the highway. For cross culverts and bridges, streambank damage can cause culvert beddings and bridge abutments to be undermined threatening their structural integrity. With the possibility of culvert or bridge instability, migration of fish and other organisms can be impaired because of barriers created by excessive scour and vertical change in stream bed. Without revetments to stabilize streambanks and subsequently protect facilities where necessary, public safety and infrastructure can be impacted. See examples of storm damage caused by excessive stream hydraulic forces from Furnace Creek in Figure 1 and Rincon Creek in Figure 2.
In the past, revetments have typically been comprised of rock, concreted-rock, or different types of reinforced-concrete retaining walls. As resource agencies, such as the Army Corps of Engineers, California Fish and Wildlife, and the various Regional Water Quality Control Boards, are requiring softer bank revetments to be constructed in the stream environments to obtain permit approval for projects, the Department is recommending the design of hybrid revetments consisting of vegetation incorporated into rock slope protection. By having this combination, a streambank will be stabilized through rock mass, while the vegetation will provide ecological benefit, including shading or temperature reduction, as well as habitat enhancement. When the vegetation is mature and deeply rooted, it may also provide shear resistance that would aid in protecting a streambank against erosion in addition to the rock.
In the design of revetments in a stream, it is important to consider the natural, fluvial processes that occur through a stream's existence. Some of these processes include formation of channel shape, floodplain, and meanders, in addition to sediment transport. As an engineer, it is common to focus on the mechanics of the problem creating damage and failure when developing a design solution, but the engineer should also be aware of the environment and include this consideration so that a solution does not greatly inhibit stream processes. In other words, the design solution should strive to strike a balance where highways, bridges, and culverts are properly protected through streambank revetments without causing significant impacts to stream processes and ecology. This compromise or balance between the man-made transportation facility and the environment is emphasized because it is rarely an ideal relationship; the two conflict with one another at times. Any man-made stream crossing and revetment will cause some interruption in the natural setting, but the idea of compromise is to minimize potential negative effects. A hybrid revetment is one such solution to streambank stabilization that allows for more balance between the engineering benefit of armoring a bank while promoting some environmental preservation.
In this Design Information Bulletin (DIB), the fundamentals of stream processes are presented to give the engineer basic introduction and understanding of fluvial geomorphology, and a premise and process for analyzing and designing hybrid revetments are included as well. The DIB also contains positive and negative effects of vegetation use in bank stabilization, definition of design roles and responsibilities, modeling guidance, construction order of work, sample plans and details, sample design calculations, sample hydraulic modeling, and a nonstandard special provision for gravel filter. Overall, the reader will find more thorough direction and discussion of design procedures and software use for general revetment design in this DIB than currently exists in the Highway Design Manual, which will assist in understanding the concepts for hybrid revetment design.
While the concept of using vegetation and rock together in a revetment is certainly not new, the overall intention of this DIB is to bring Department-wide uniformity to the design of hybrid revetments.
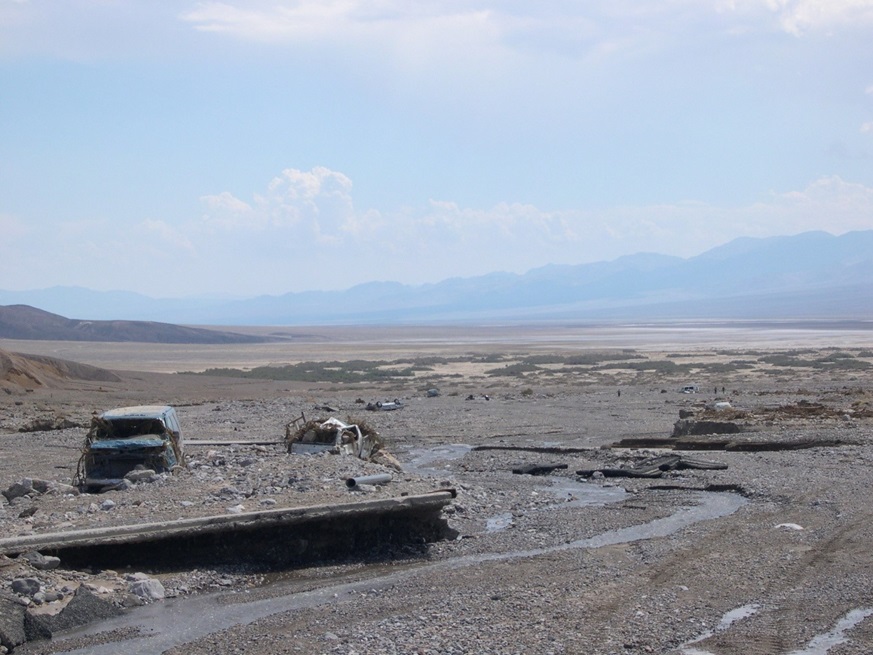
Figure 1: Highway 190 Roadway Failure, Death Valley, Summer 2004
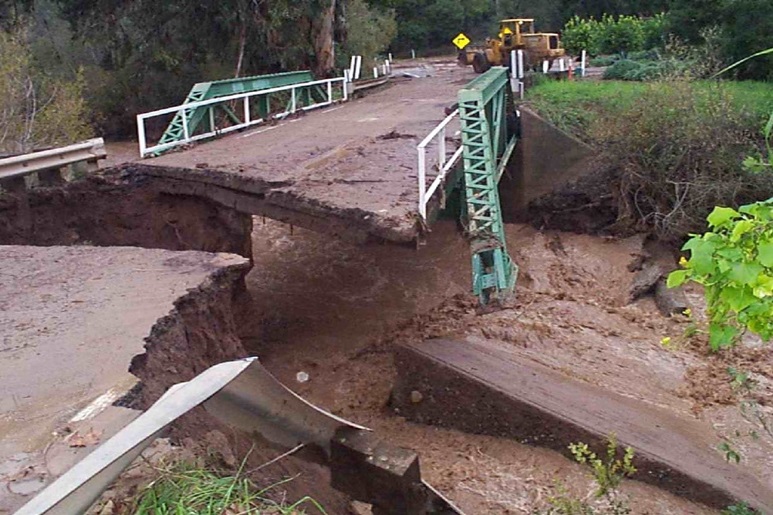
Figure 2: Highway 150 Bridge Failure, Central Coast, Winter 2005
2.1 Fundamentals of Stream Processes
This section contains simple principles of fluvial geomorphology. It is intended to give the engineer background, perspective, and respect of stream processes and their dynamics when designing and constructing a hybrid revetment.
2.1.1 Basic Stream Pattern
The three basic stream patterns are straight, braided, and meandering as seen in aerial or plan view. Pattern is one way of classifying a stream and generalizing its behavior. Commonly, they are identified by sinuosity, which is defined as channel length divided by valley (floodplain) length. For straight and braided streams, sinuosity varies between 1.0 and 1.5, while meandering streams have sinuosity greater than 1.5 (Leopold et al 1992). These different patterns and their associated gradients contribute to changes and adjustments in streams, and specifically influence flow resistance that affects sediment transport and formation of cross-sectional shape (Leopold et al 1992).
2.1.1.1 Straight Streams
Streams with straight patterns have flat gradients with low energy and flow resistance (Admiraal 2007). Because they have low energy, the need to release accumulated energy through significant scouring and meandering to maintain quasi-equilibrium state, typical of other stream patterns, is not essential. This quasi-equilibrium state, sometimes referred to as dynamic equilibrium, is achieved when the rate of scour is close to the rate of sediment deposition, which creates a balance (Admiraal 2007). In addition to stream pattern, cross-sectional shape, roughness, and bed/bank features are factors in controlling quasi-equilibrium (Admiraal 2007).
While a stream may be identified as straight based on sinuosity, the thalweg, otherwise known as a string of maximum depth points within the main channel, more than likely will meander from one bank to the other influenced by alternating sediment deposition along its banks given its low slope and energy (Leopold et al 1992). These sediment deposits can cause deflection of flow and secondary currents that occur in the span-wise (width-wise) direction instead of the stream-wise (longitudinal) movement that is dominant for straight streams (Admiraal 2007). On one hand, it may seem that straight streams are very stable because of low slope and energy, but the alternating sediment deposits can cause lateral instability (Leopold et al 1992). In general, it is more natural for a stream to meander than to have a straight stream pattern, therefore it is difficult to find straight streams in the field, especially long reaches (Leopold et al 1992). A number of straight streams found in the field were meandering at one time and artificially straightened. See Figure 3 for example of straight stream pattern.
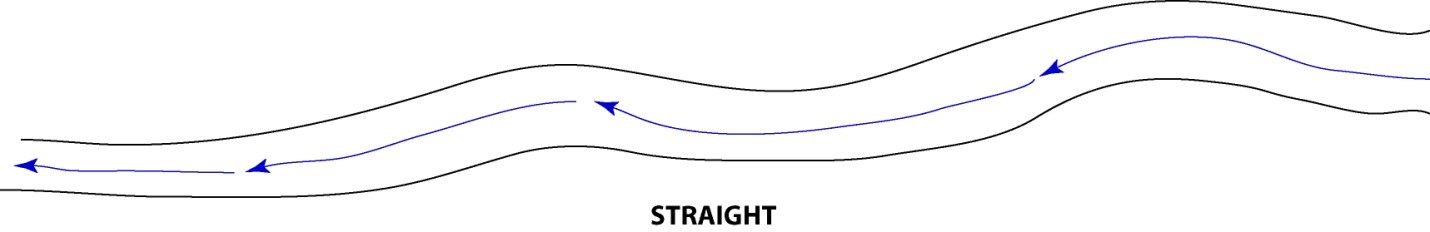
Figure 3: Straight Stream Pattern Schematic (Admiraal 2007)
2.1.1.2 Braided Streams
Similar to straight streams, streams with braided pattern have low sinuosity, but have the highest gradient of any of the stream patterns (Admiraal 2007). Braided streams have many sub-channels within the main stream channel that interweave and crisscross (Leopold et al 1992). The sub-channels are separated by islands or bars which are visible during low flows and normally submerged under high flows (Leopold et al 1992).
Because braided streams have steep slopes, they possess the higher energy necessary to erode and transport sediment that comprises the bars and islands. Even though they have high energy, these streams will deposit their coarser and larger material that cannot be physically transported by the stream's average velocity and shear stress. In other words, the process of braiding occurs during flood events as a stream adjustment in response to the larger sediment and debris loads that cannot be sustained while trying to find dynamic equilibrium (Leopold et al 1992). This deposition of larger material creates the bars and islands. As flow and velocity fluctuate during a flood event, it is common to see movement and re-creation of bars, islands, and sub-channels. See Figure 4 for example of braided stream pattern.
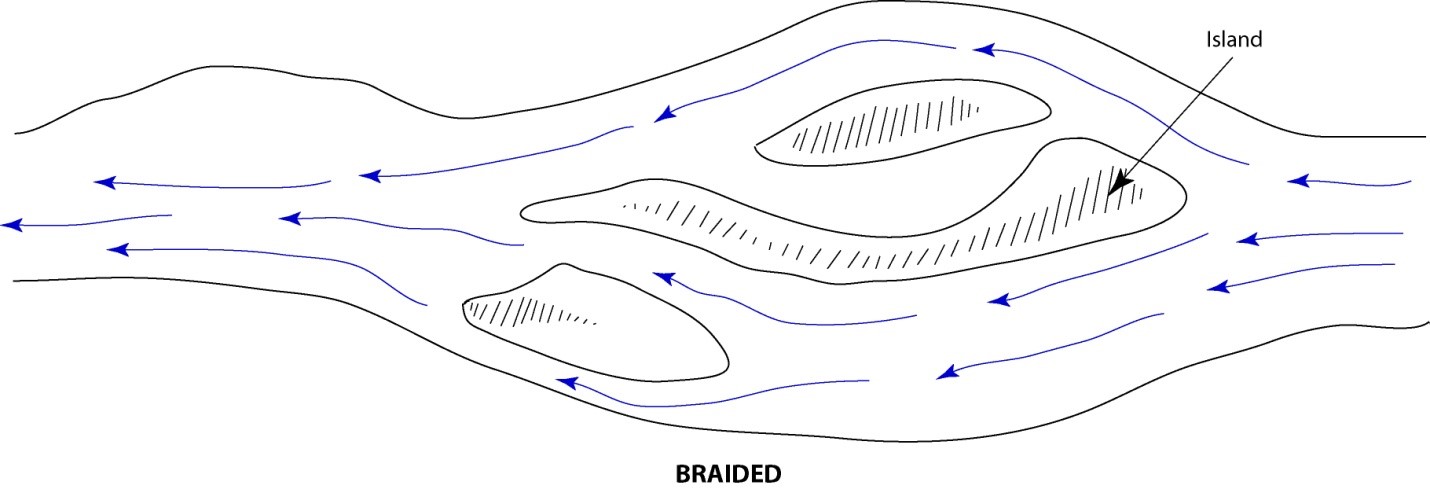
Figure 4: Braided Stream Pattern Schematic (Leopold et al 1992)
2.1.1.3 Meandering Streams
Meandering is the most common stream pattern, having a series of alternating curves or bends, and is associated with flatter valleys. These stream types have the highest sinuosity because of their longer stream length, due to several alternating curves, with respect to valley length. One way that streams seek dynamic equilibrium is to dissipate energy through erosion of their banks that will create meandering patterns. When meanders are created, overall stream length is increased, and energy is released through the work necessary to scour its banks, which brings a stream closer to dynamic equilibrium. Streambank revetments are often constructed through these meanders to prevent excessive erosion that may cause instability of nearby or adjacent transportation facilities.
Once curves have been created in a stream's alignment, velocity increases as the flow of water moves through the outside bank of a bend caused by secondary, circulation currents. Given the geometry of a curve, velocity is resolved into three components described in the longitudinal, width-wise, and vertical directions, contrary to straight reaches of stream.
As flow moves through a curve, the circulation currents and their turbulence are influenced by radius of curvature, stream bottom width, flow depth, curve deflection angle, and Reynolds Number (Admiraal 2007). As often occurs, turbulence is magnified by counter-circulating currents from an upstream bend merging with circulating currents of an immediate downstream bend (Admiraal 2007 and Bathurst et al 1979). The increased turbulence usually increases the amount of scour at the outside bend, and the transported material is deposited on the inside bend at the downstream reversing curve creating a point bar.
Another characteristic of flow through a curve is that the top of the water surface will superelevate along the outside bank of a curve as it is pulled by centrifugal forces while the bottom water surface at the bed is being pulled toward the inside of a bend (Admiraal 2007 and Bathurst et al 1979). These two actions will cause skewing of the circulating current contributing to more erosion around a bend. See Figure 5 for example of meandering stream pattern.
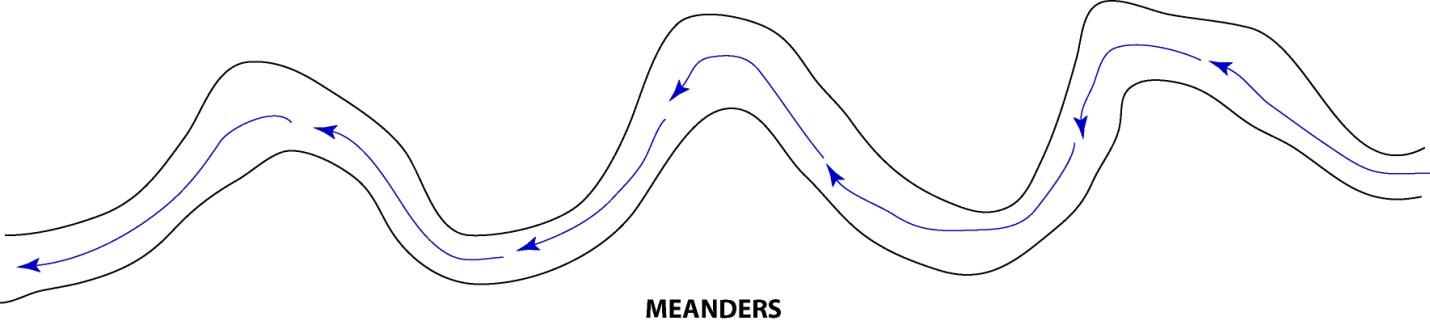
Figure 5: Meandering Stream Pattern Schematic (Admiraal 2007)
2.1.2 Sediment Transport
In the previous sections, the process of sediment movement (transport) and its deposition was mentioned, but not a focus. The following section provides a summary of the sediment transport process.
Streams are unique from other hydraulic conveyance facilities, such as engineered channels and pipes, in that its boundaries are mobile, and they move sediment within their water column or along the bed by skipping and rolling, which is a complicated interrelationship. Sediment supply and its movement are the life of a stream that can become unstable when this process is interrupted if supply becomes limited or if a stream is unable to transport its excess downstream. Instability can be seen through channel incision, where the stream bed degrades and banks over steepen, excessive meandering, or large alignment shifts as a stream attempts to control energy as it searches for dynamic equilibrium. The ability of a stream to control and manage its sediment is not the only influence on stream stability, but one of the more important factors.
Within a stream bed, immersed sediment particles resting on the stream bed and over other particles exert their effective weight in the form of a vertical force, which can be divided into normal and tangential components based on the stream bed slope (Leopold et al 1992). Simply stated, in order for sediment particles to become mobile, a force greater than their normal weight components must be applied to them (Leopold et al 1992). This force to cause mobility is a drag force or fluid stress acting on the particle as water flows over them. The fluid stress can be expressed as an average boundary shear stress acting on a stream bed considering steady, uniform flow (Fischenich 2001):
to = gDSf
to = shear stress= force per unit area in flow direction
g= specific weight of water
D= flow-depth
Sf= friction slope
Once the sediment particles are in motion, they can be transported as bedload when they roll and skip along the stream bed, or they can be entrained and suspended in the water column. The suspended sediment load is carried through the flow by turbulence and is typically fine sand, silt, and clay. As for bedload, it is coarser possibly as large as boulders, and moves along the bed by the fluid stress action mentioned previously (Kondolf and Piegay 2004).
Particle movement can be further expressed at a specific point in a stream bed as incipient motion, which is the initial movement of a particle. The calculation of a critical shear stress or critical velocity can be performed at the threshold movement condition that assumes active hydraulic forces are equal to particle resistant forces. At the point of critical shear stress or critical velocity, a particle is just about to move. This means that values of shear stress or velocity greater than critical shear stress or critical velocity cause particles to be in motion, while particles will be at rest with values of shear stress and velocity lower than critical shear stress and velocity. An incipient motion calculation can provide an indication of erosion potential and stream stability. Fischenich (2001) provides a variation of the widely accepted and industry standard Shields equation for approximated critical shear stress considering different materials:
tcr = 0.5d(gs-gw)tanF (Clays)
tcr = 0.25do-0.6d(gs-gw)tanF (Silts and Sands)
tcr = 0.06d(gs-gw)tanF (Gravels and Cobbles)
do = d((G-1)gv-2)1/3
tcr = critical shear stress
F= soil grain angle of repose
d= soil grain diameter
gs= sediment unit weight
gw= water unit weight
G= sediment specific gravity
g= gravity
v= water/sediment mixture kinematic viscosity
In order to predict sediment transport potential on a larger scale, transport rates, volume, and capacity modeling can be performed for a stream reach, but this is not an easy and straightforward task. Several empirical sediment transport functions used in modeling have been developed and named after their creators, such as Einstein, Acker and White, Laursen-Copeland, Meyer-Peter Muller, and Yang. These functions are complex and notoriously data intensive. While not often, resource agencies and flood control districts will request this type of analysis during the permit review process. If sediment modeling is necessary, HEC-RAS v4.1 (or higher), the Army Corps of Engineers' river and stream modeling software, contains sediment transport modeling capabilities using these transport functions and others. In addition, the Finite Element Surface-Water Model System (FESWMS) hydraulic model contained in the Surface-Water Modeling System (SMS) software also has sediment transport modeling capabilities. HEC-RAS and SMS are both available for the Caltrans engineer to download and use accordingly. HEC-RAS is public domain software, while Caltrans has an unlimited yearly SMS site license partially sponsored by the Federal Highway Administration (FHWA). The Caltrans portion of this site license is paid for by Headquarters Design.
2.1.3 Stream Channel Form
At any location in a stream, the cross-sectional shape is dependent upon the volume flow-rate (flow), the composition of sediment transported through a section, and the integrity or gradation of the bed and bank materials (Leopold et al 1992). As water flows through the stream channel, it exerts a fluid shear stress on the bed and banks. For a constant and stable cross-sectional shape, for a given flow, at a specific location, the resisting bed and bank material shear stress must be equal to the fluid stress at every point in the stream cross section perimeter (Leopold et al 1992). In this state, a stream is in the threshold condition discussed in Section 2.1.2 where each point along the perimeter is at the threshold of movement or incipient motion. This condition also indicates a dynamic equilibrium with scour and deposition of sediment being equal. As flow, velocity, and fluid shear stress increase, the amount of scour and sediment deposition will change, which will also change the stream cross section for a given bed/bank gradation.
Streams are commonly trapezoidal in cross section through their straight reaches and become asymmetric through their bends (Leopold et al 1992). When streams incise in response to possible instability, their depth increases and the stream takes on a more rectangular cross-sectional shape. Also, streams with very large flows may become rectangular as the bed width increases to convey the large flows, especially if bedrock outcroppings are present on the banks preventing them from flattening.
The form and appearance of a stream can also be influenced by features within the stream profile, such as riffles and pools because of their effects on the acting fluid shear stress and velocity. Riffles are longitudinal sections of streams with higher velocity, lower flow-depth usually caused by obstructions, such as gravels, cobbles, and boulders created by bar development. On the contrary, pools have higher flow-depth and lower velocity, and are typically comprised of finer silts and sands compared to a riffle. These bed materials associated with pools and riffles have an effect on resisting bed shear stress that will influence stream shape and stability. The alternating pool and riffle sequence is common for practically all perennial streams that have gravel to boulder size bed formations (Leopold et al 1992).
2.1.4 Floodplain Form
From a geomorphic perspective, floodplains are flatter lands adjacent to a river main channel that are dry until larger flows force water out of the stream channel into these overbank lands during significant flood events. According to Leopold et al (1992), floodplains typically include the following features: the main stream channel itself, point bars, oxbows and lakes, natural raised berms (levees) above floodplain surface, terraces, sloughs and depressions, overbank fine and coarse sediment deposition, scattered debris, and vegetation.
When water exceeds the capacity of the main channel, the conveyance of flow through the floodplain overbanks will differ from the main channel due to uniqueness of form (shape), gradient, alignment, and very likely flow resistance (roughness) of the floodplain versus the stream channel. Therefore, water will move and deposit varying sediment types differently, also at different frequency, creating a separate floodplain form. Once sediment is moved to the floodplain, coarser sediment is generally deposited along the streambanks forming levees and finer sediment is dropped between the valley walls and the levees on the floodplain floor (Leopold et al 1992). Sediment is stored and becomes dormant until larger flows return to the floodplain that may convey the sediment down-valley.
As water carves and traverses its way through a valley by meandering, the alternating curves' radii sharpen over time creating oxbows having very tight radii, nearly becoming a closed loop, that have a tendency to be cut off from the stream because of sediment accumulation (Leopold et al 1992). The isolated oxbows form lakes within the floodplain. These lakes may eventually become marshes, sloughs, or simple depressions as sediment continually deposits within them (Leopold et al 1992). Water that may become trapped in these types of floodplain features will infiltrate and recharge groundwater, where the floodplain sediment acts a filtration system cleaning the standing water. This water and nutrient-rich sediment also promote vegetation growth.
Similar to the stream channel, floodplain form is directly linked to the sediment transport process, and floodplain stability is also affected by sediment supply and its movement. Fluid shear stress and velocity control the sediment/debris degradation and deposition properties within the floodplain that impact its form, landscape, and appearance. Because the floodplain can be dormant for considerable time depending on watershed hydrology, its form can remain relatively constant and preserved for extended periods, as well as be less dynamic than the stream channel. See Figure 6 for a floodplain typical cross section.
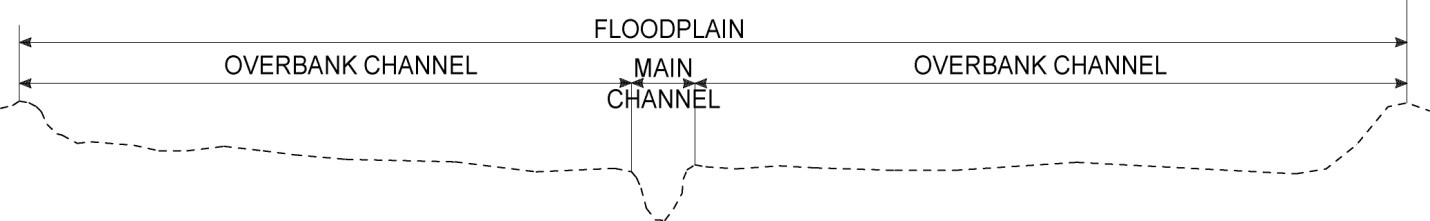
Figure 6: Floodplain Cross Section
2.1.5 Streambank Erosion
Simply defined, streambank erosion is the result of its soil resisting strength being less than driving forces acting on the bank. It can occur through bank-toe scour below the water line and bank mass failure from above. This erosion occurs first as a geotechnical failure followed by the hydraulic action that removes the failed soil and sediment by fluid shear stress (Admiraal 2007). The hydraulic action further causes lateral scour of the bank and is the principal contributor to bank-toe failure. This is a natural process for both stable and unstable streams, but is exaggerated in the latter case. The degree of erosion can be influenced by impervious development in the watershed, agricultural use, and changes in climate (Admiraal 2007). With or without these influences and whether a stream is stable or unstable, streambank erosion will take place at some level. With this said, scour will often be reduced at critical locations to protect highway structures and preserve public safety, although restraint needs to be exercised during the project development process so that a stream does not greatly change its morphology in response to the protection measures.
The driving and resisting forces for streambank erosion, mentioned above, are controlled by a series of factors. For the driving (active) forces within geotechnical failure, soil saturated unit weight, pore pressure, bank height and angle of repose, and object surcharges within and above the bank, such as vegetation, all have impact on its calculation (Simon and Collison 2002). The effects of driving forces are commonly seen through soil saturation as a result of intense precipitation with subsequent increase in pore pressure and bank soil saturated unit weight that can cause mass bank failure (Admiraal 2007 and Thorne 1990). The forces that will resist and give soil its strength from geotechnical type failure are dependent upon effective soil cohesion, normal stress, pore pressure, and soil effective angle of friction.
During streambank erosion, the bank soil can fail by different modes. Generally speaking, steep slopes present slab-type or toppling failures where large slabs (blocks of soil) of the bank break away from the top and fall into the stream, while mild slopes show a rotational failure that begins at the bank toe causing soil to slide from above into the stream (Admiraal 2007 and Thorne 1990). Once the eroded soil reaches flowing water, it is usually transported downstream depending upon its size and composition.
As for bank-toe scour, its main influences are derived from bank soil composition and gradation, volume of sediment in transport, stream flow and stream gradient (Admiraal 2007 and Lane 1955). These factors and the principles of scour and sediment movement from hydraulic forces is the same as presented in previous sections and a reoccurring theme in fluvial geomorphology.
3.1 Positive and Negative Effects on Streams from Vegetation Use in Bank Stabilization
The use of vegetation in streambank stabilization has positive attributes on stream integrity, such as improving stream ecology, increasing soil strength, and providing flow resistance, but vegetation can also have negative impacts on stream integrity by altering conveyance characteristics of the stream, affecting soil characteristics, in addition to being unpredictable in its long term establishment and performance.
One of the most profound positive effects of vegetation use is ecological improvement and preservation. Streams with stable vegetation typically have good water quality, as well as good biological and chemical health due in part to the ability of the vegetation to filter pollutants including nitrates and phosphates through their uptake of moisture in the soil (NRCS 2008). Vegetation will also promote good fish, wildlife, and aquatic organism habitat by providing cover, reducing stream temperature and controlling temperature fluctuations, and supplying an organic food source.
In addition to ecological improvements, vegetation can strengthen the underlying soils. It can create additional cohesion and binding properties through its roots and rhizomes (Fischenich 2001). The fibrous woody roots are strong in tension, but weak in compression, which is the opposite case for soil (Simon and Collison 2002). Therefore, roots and soil working in tandem can complement the other providing a material that has both tension and compression resistance. In a broader sense, vegetation can also improve soil strength by lowering pore-water pressure through its soil moisture extraction (Simon and Collison 2002). See Figure 7 that shows root system reinforcing streambank soil.
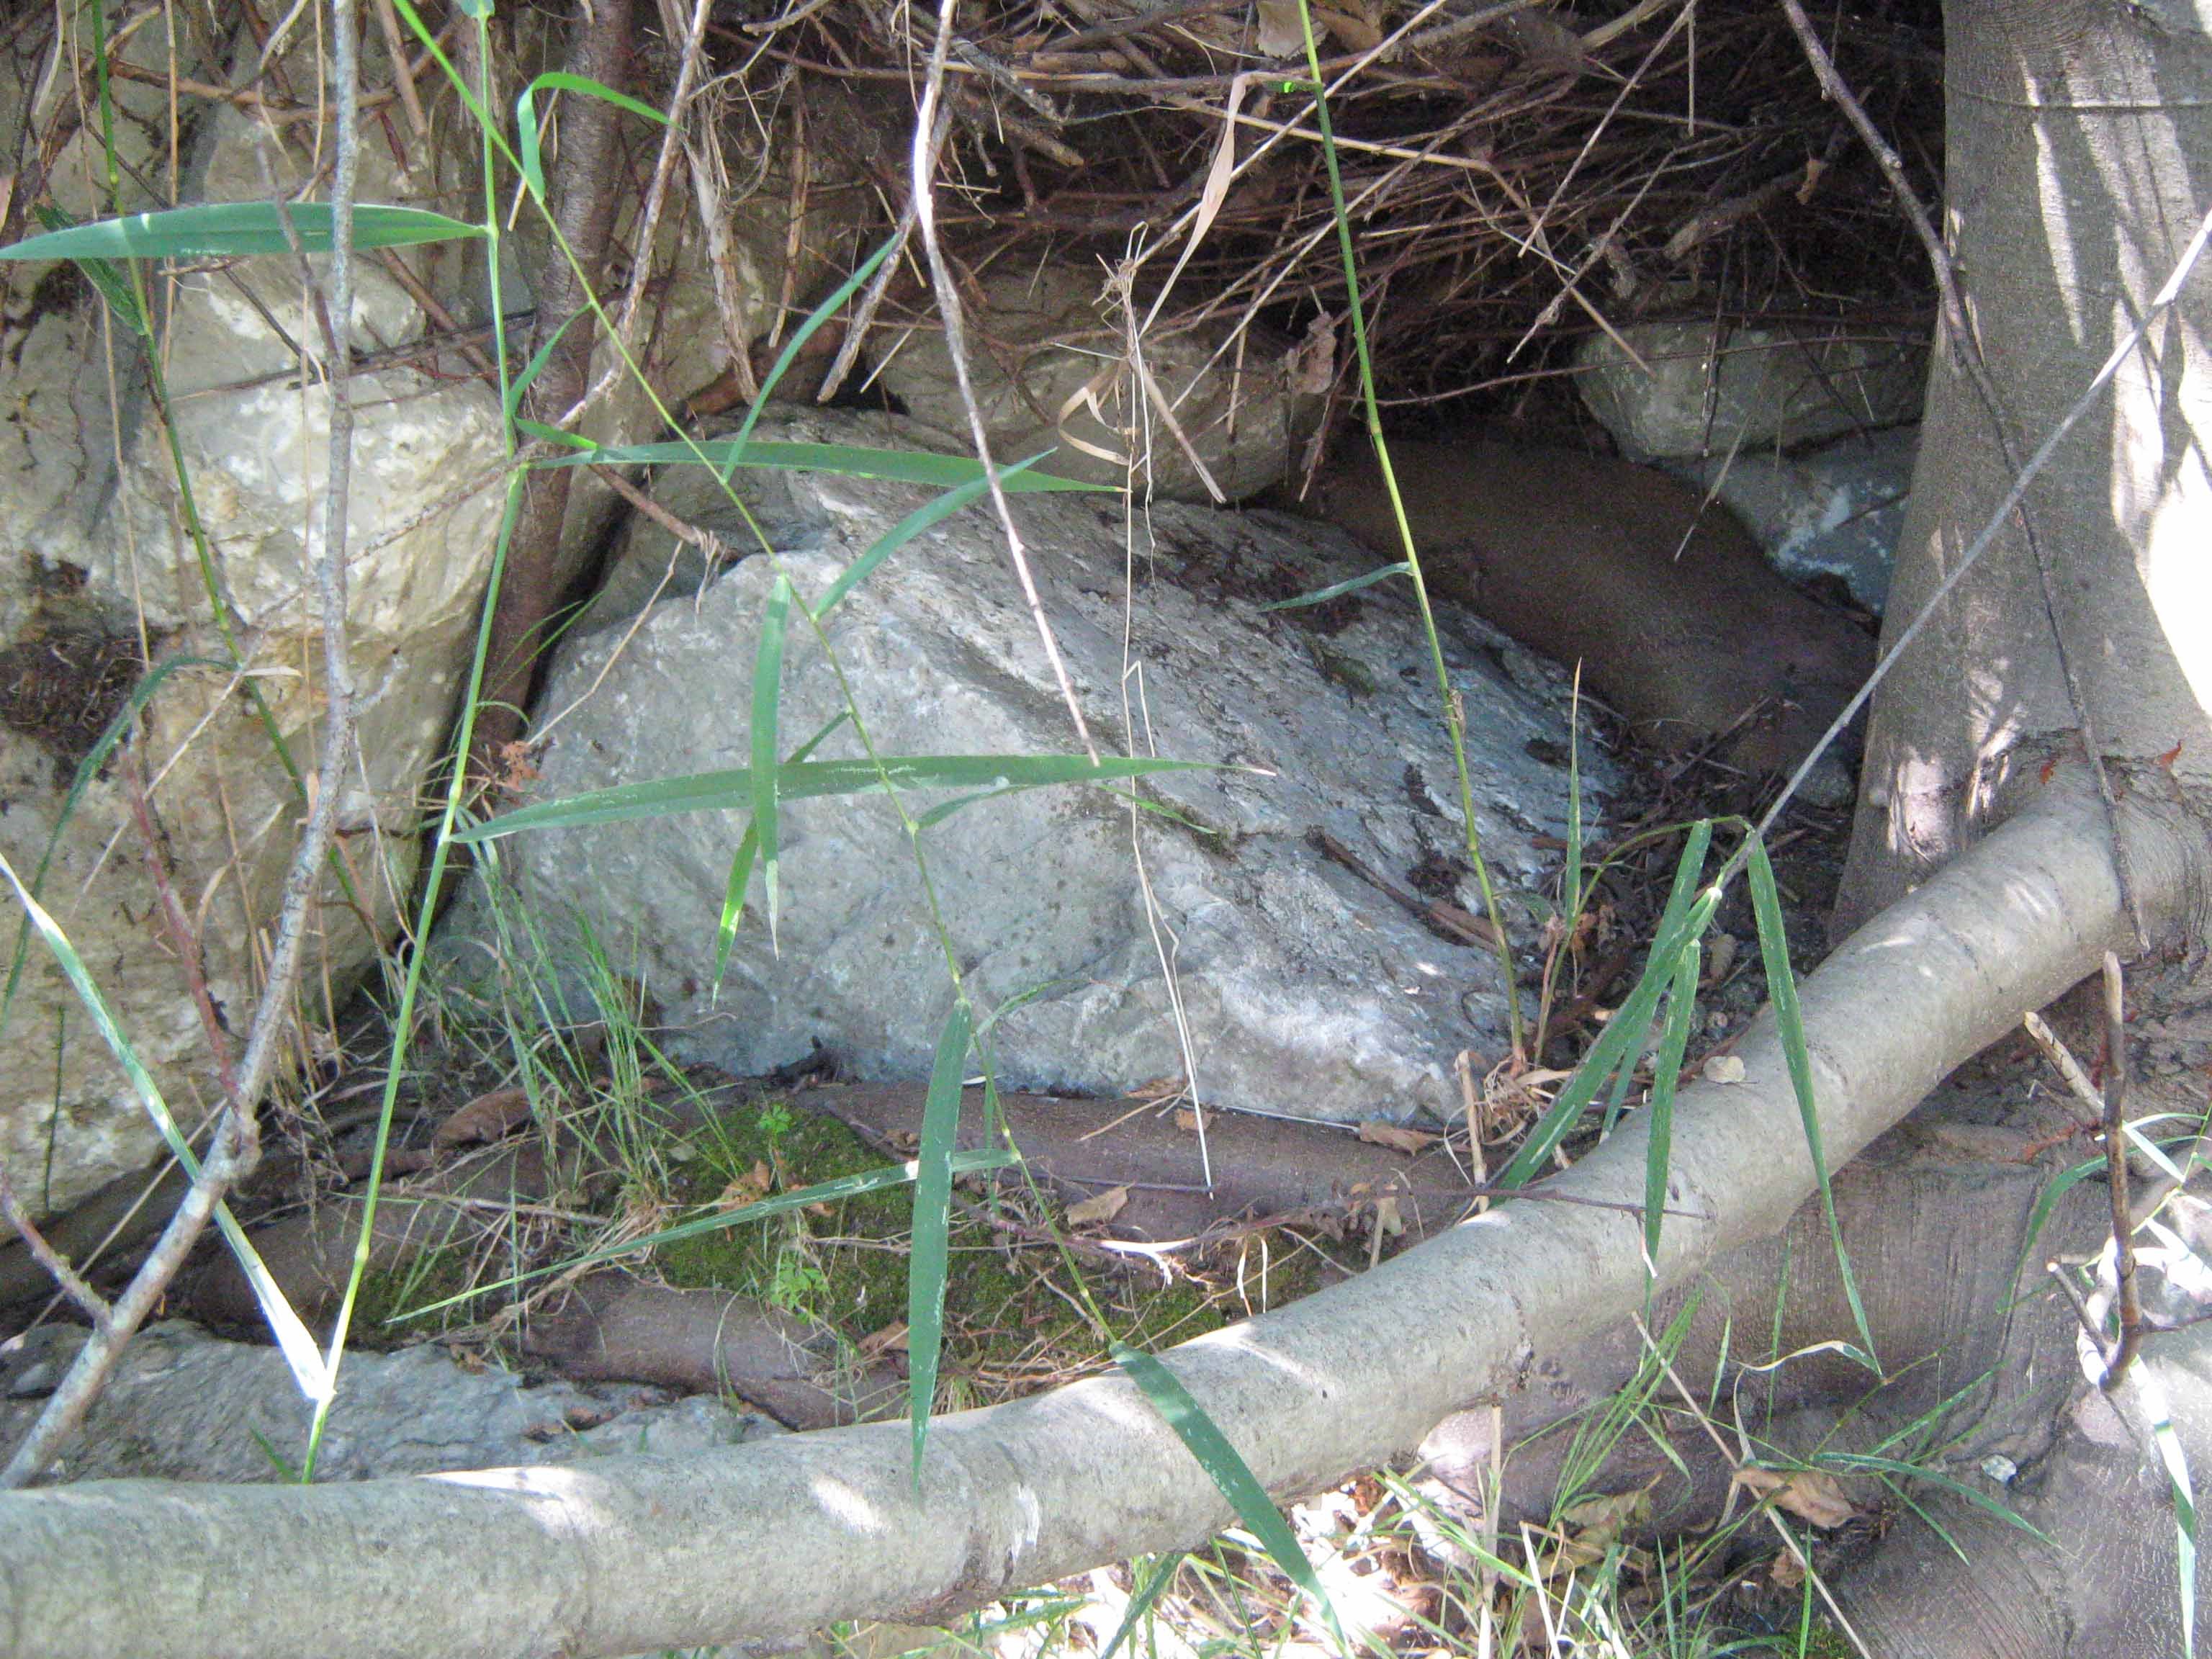
Figure 7: Weaver Creek, Root System through Soil and RSP
These benefits of the vegetation root system also carry some negative effects. Their additional mass and surcharge can increase slope failure potential under saturated conditions. The magnitude of saturation can actually be compounded because of the root development, which creates macropores that increase infiltration capacity of the soil and promotes concentration of water deeper into the streambank (Simon and Collison 2002). Typically, this process occurs during or soon after a significant storm that is usually associated with bank failure (Simon and Collison 2002).
Another positive effect of vegetation use in revetments is its ability to improve flow resistance creating higher roughness that will dissipate energy, shear stress, and velocity. The vegetation deflects velocity upwards away from the streambank, which reduces the influence of drag and lift (Fischenich 2001). For instance, willows planted on a streambank have the capacity to deflect and resist velocities up to 10 feet/second in their mature state, which would equate to a 12-inch to 18-inch rock (RSP Facing to RSP Light class) having similar permissive velocity (Fischenich 2001).
With the addition of vegetation, such as willows, through bank stabilization construction, the roughness value, also known as Manning's n-value, can increase from a streambank having sporadic vegetation to one having medium vegetation density (Zipparo et al 1993). This increase in n-value of the bank, as well as its influence on the main channel composite n-value, will provide increased flow resistance that will lower shear stress and velocity. For example, a reduction in velocity can be seen through the simple use of Manning's equation for steady uniform flow (Chaudry 1993):
v= 1.49n-1R2/3S1/2
v= velocity
n= Manning's roughness coefficient
R= hydraulic radius= A/P
A= wetted area
P= wetted perimeter
S= slope of water surface or channel bed slope
Given two streams with the same flow-depth, the same wetted area and perimeter, the same bed slope, but different main channel composite n-values based on differences in vegetation densities on their streambanks, the change in average velocity from these two streams can be found by varying n-values in Manning's equation. Higher n-values will yield lower velocities showing roughness effects with increased vegetation density.
For visual reference of qualitative roughness differences, see Figures 8, 9, and 10. Figure 8 shows angular RSP locked together with a few young willows in winter stage, where the RSP will provide the majority of roughness, however this condition would have the lowest n-value of the three Figures. In Figure 9, vegetation is more predominant than the previous Figure 8, especially considering good foliage during summer months, and combined with the RSP will create more flow resistance and higher roughness value than the Figure 8. In the last Figure, vegetation is more mature than the previous two Figures, and coupled with the RSP will create the highest roughness and flow resistance of the three Figures even though the willows are in winter dormancy. During spring and summer months at this maturity level with full foliage, the vegetation in Figure 10 will provide increased roughness and flow resistance compared to the winter condition.
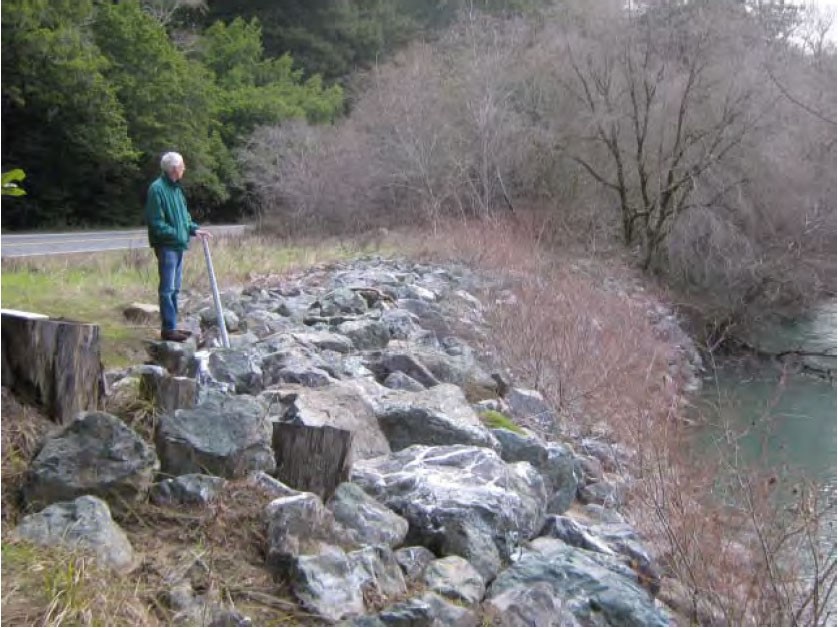
Figure 8: Navarro Creek (December 2012), Main Channel Bank

Figure 9: Cedar Creek (July 2005), Main Channel Bank-Toe
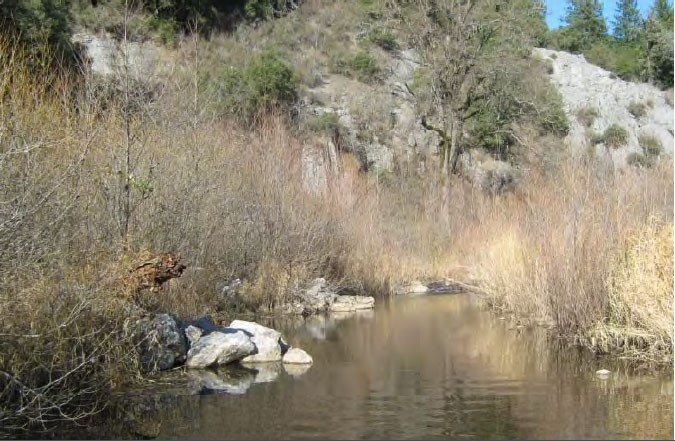
Figure 10: Cedar Creek (December 2011), Main Channel Bank-Toe
This flow resistance attribute mainly occurs when vegetation is mature. To reach this point, it may take three to five years. In the first few years after planting, the vegetation is providing little resistance. Velocity resistance could be as low as 3 feet/second for immature willows, in other words may be seedlings up to 2 years old (Fischenich 2001). They are vulnerable to being uprooted and swept away by the stream flow, or it is possible that the vegetation may not take root when initially planted. During this establishment period, the streambanks can be subject to scour and erosion because of the lack of flow resistance without some other means of protection. Even after vegetation reaches maturity and beyond, potential exists for it to succumb to drought conditions or to yield to large flows/velocities and break apart rendering the vegetation ineffective to dissipating velocity and hydraulic forces. Because the stages of vegetation growth can be dynamic as it is affected by drought or high flows, the vegetation may go through a reestablishment process, and the n-value and velocity/flow resistance will also be dynamic making revetment performance unpredictable.
While it is desired to have mature vegetation to improve resistance and increase roughness that will contribute to the control of bank erosion, high density and overplanting can cause capacity and conveyance issues for a stream. As an n-value (roughness) increases and velocity decreases in a stream reach, illustrated by Manning's equation for steady uniform flow, flow-depth and wetted area will increase, but volume flow rate (flow) will remain constant based on the conservation of mass and continuity of flow principle. The converse is also true where a decrease in n-value will cause an increase in velocity and decrease in flow-depth and wetted area while flow remains constant. Mass or volume flow rate is always conserved and is constant in a fluid system, considering no lateral inflows or outflows, whether the system is a pipe, a stream reach, or some other conveyance facility and can be expressed through the continuity equation (Chaudry 1993):
Q= v1A1= v2A2
Q= volume flow rate (flow)
v= velocity
A= wetted area
Because flow remains constant for a stream reach in the continuity equation based on conservation of mass, flow-depth and wetted area will change as velocity changes and vice versa, directly affected by roughness. When vegetation becomes highly dense, the main channel composite n-value will increase and subsequently lower stream average velocity and increase flow-depth. This means that flow-depth will be higher for the same flow prior to the addition of the high density vegetation used for bank stabilization, and the main channel will have less conveyance or storage capacity causing water to move into the overbanks and floodplain more quickly. If velocities become too low because of the high density vegetation, deposition of sediment can occur within the main channel that can trigger streams to artificially move and migrate.
Stream capacity and conveyance can also be affected by the lateral projection of the vegetation from the streambank toward the center of the main channel, which reduces the cross-sectional area available to convey flow. The vegetation overgrowth and cross-sectional area reduction can choke the stream forcing higher than normal flow-depths and early water movement into the stream floodplain overbanks. This will also cause sediment deposition and accumulation that can alter stream morphology. In other words, too much of a seemingly good thing (large and dense vegetation) can have negative effects.
While controlled vegetation density and projection on a streambank will have positive impacts, planting within the bank-toe zone and main channel can create negative effects. Because the bank-toe zone is typically subjected to the highest stress in the stream channel with long inundation periods, vegetation survivability in this zone is poor (NRCS 2008). Based on a series of scaled flume tests, introducing planting around the bank-toe zone and main channel interface can provide some velocity attenuation along the bank-toe, but velocity in the longitudinal (stream-wise) direction can actually increase significantly in the main channel influenced by turbulence intensity (Czarnomski 2010), which would definitely affect plant survivability, as well as negate positive effects of velocity attenuation in the bank-toe zone. For both main channel and bank-toe zone, vegetation introduction can also create significant turbulence intensity (Czarnomski 2010). This increased turbulence can lead to artificial channel widening, and the increased velocity in the main channel can cause localized scour that could defeat the purpose of providing bank stabilization in the first place. These impacts justify excluding the use of vegetation for bank stabilization from the bank-toe zone and the main channel and focusing it on the main bank and above.
Even though the use of vegetation in bank stabilization may have negative effects, its benefits generally outweigh them. By using practical judgment to minimize the negative impacts, the use of vegetation can definitely be advantageous.
4.1 Hybrid Revetment Design Premise
In a nutshell, the design premise is to use rock and vegetation together in a streambank revetment in such a way that will highlight their positive attributes while also addressing and managing their negative impacts.
The rock portion of the hybrid revetment will be sized to the extent of a normal rock revetment following suggestions and guidelines for flexible and embedded toe revetments found in Chapter 870 Channel and Shore Protection- Erosion Control, Topic 873 Design Concepts, of the Highway Design Manual (HDM). In the design of hybrid revetments, mounded toes referenced in Topic 873 are not recommended because of their encroachment into the middle of the channel, which can impact cross-sectional area and capacity. With the use of vegetation on the bank and their possible projection toward the middle of the channel, cross-sectional area could possibly be impacted as well. A mounded toe used with bank vegetation would only exacerbate this issue, therefore an embedded toe is chosen for hybrid revetment application.
Some of the design aspects in Topic 873 include design height, scour depth, average velocity, rock size, and very importantly the design storm frequency. For hybrid revetment design, the HDM suggested 50-year (2% probability) flood event will be used and is a critical component of the design premise. The other design aspects will be discussed in more detail within Section 7.1 Hybrid Revetment Design and its subsections of this DIB.
The rock or rock slope protection (RSP) portion of the hybrid revetment will provide several benefits. Immediately following construction, the RSP will supply resistance to the 50-year average velocity, satisfying HDM guidance, through its constant total mass and n-value, and it will also provide resistance through the plant establishment period and beyond. If vegetation in a hybrid revetment should be swept away or perish, the RSP will continue to provide resistance and protect the streambank. Through this velocity/flow resistance and the use of the California layered RSP design and construction method, lateral and vertical bank erosion will be prevented for the design storm, in addition to preventing bank mass failure from possible soil saturation behind the revetment. By placing RSP beneath a potential scour depth in the bank-toe zone, the RSP will also protect and stabilize the vulnerable bank-toe.
Once the incorporated vegetation portion of the hybrid revetment has been well established after construction, it will have many benefits as well. The vegetation will enhance velocity/flow resistance, in addition to the RSP, through its roughness potential. Also, soil strength of the native bank behind the revetment will be improved by the vegetation root system that will aid in controlling bank mass failure. The ultimate benefit of vegetation in the revetment will come from its ecological improvement and preservation. Specifically, the vegetation will provide shade lowering stream temperature that can elevate with the use of RSP, and offer temperature control in the stream. These ecological aspects will promote good biological/chemical health and aquatic/wildlife habitat for a stream.
In order to manage possible negative impacts from vegetation use, planting needs to be performed in a controlled manner. For instance, placement of vegetation within the bank-toe zone and the main channel is highly discouraged to keep turbulence intensity in check that could cause excessive sediment accumulation. Realizing that plant mortality is an issue that must be considered during the initial planting and establishment period, overplanting must still be avoided so that high density and projection does not occur, which could cause increased sediment deposition and capacity/conveyance reduction. Given these issues, plant density in the design of a hybrid revetment and consideration of natural plant density is critical to the performance of the hybrid revetment. The goal for design should be medium density, where horizontal projection and cross-sectional area reduction at maturity are minimal. For woody vegetation, medium density is described as mature trees or shrubs with full foliage on a streambank, where preferably individual canopies or outer layers retain some free space between them, but may have minimal overlapping without being interwoven. See Section 6.1.2.1 for guidance on n-value selection and for descriptions of different vegetation density types. Also, see Figures 11, 12, and 13 for visual reference of differing vegetation density.
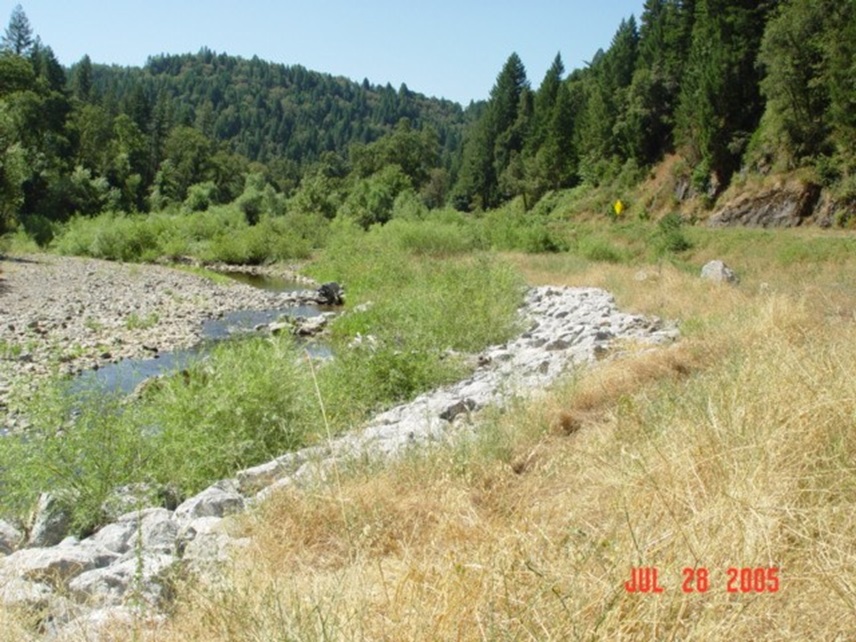
Figure 11: Cedar Creek (July 2005), Lower Limit of Medium Vegetation Density
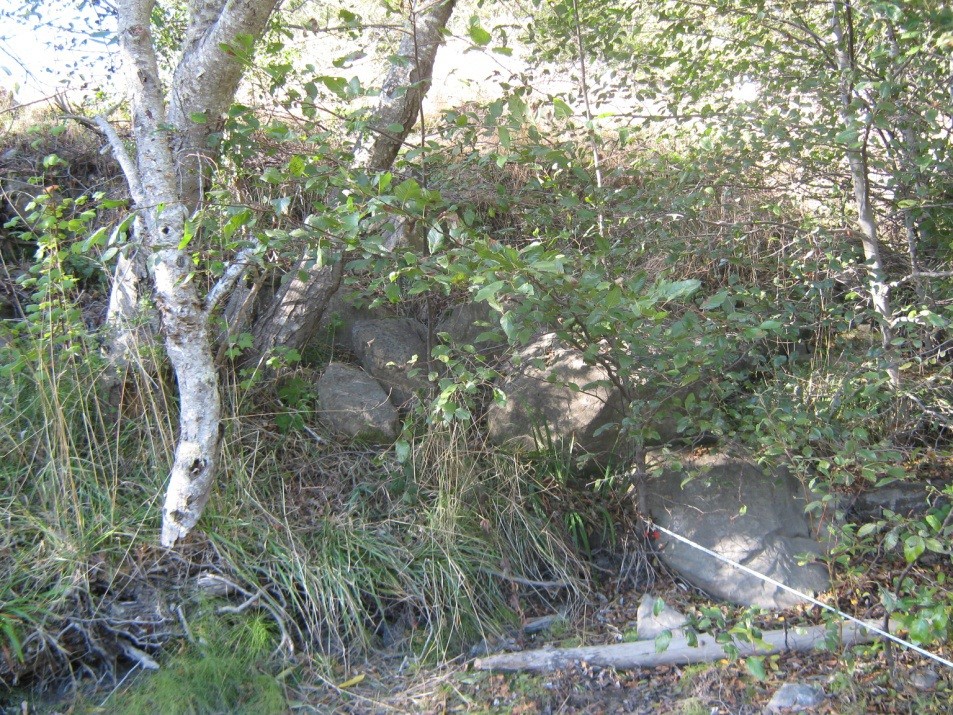
Figure 12: North Fork Mattole River, Medium Vegetation Density
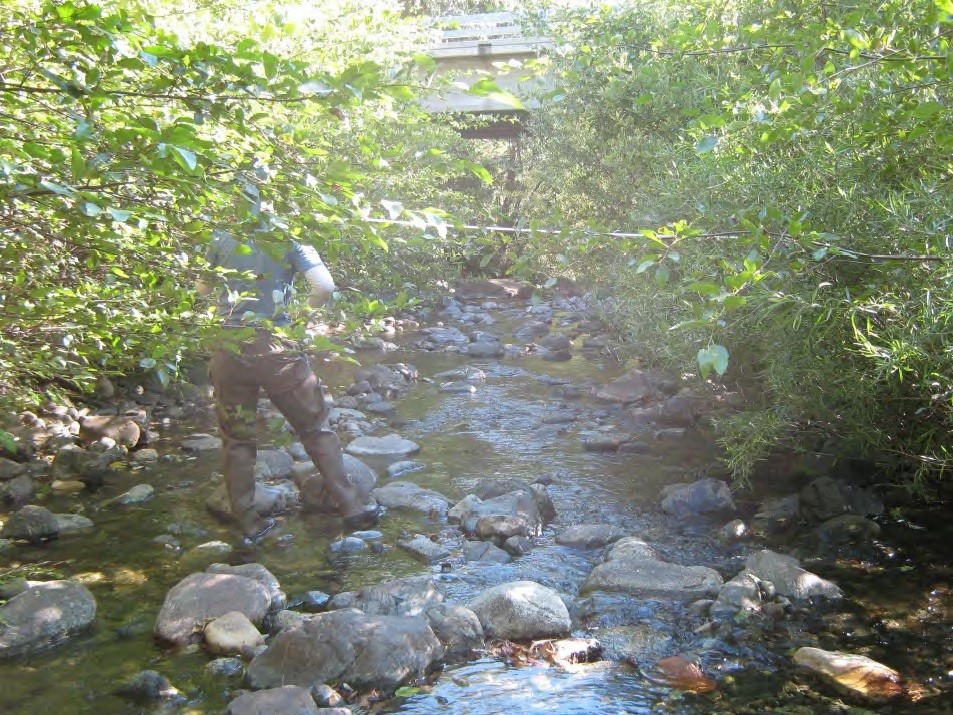
Figure 13: Rush Creek, High Vegetation Density
With the construction of hybrid revetments, the sediment transport stream process can be affected. As mentioned in previous sections, the transport and deposition of sediment is an important factor in stream channel shape and form, as well as important in sustaining stability. While it is natural for streams to erode their banks to manage their energy, excessive scour near or around a transportation facility must be controlled to prevent its damage. Rather than the stream releasing its accumulated energy through work associated with continual bank scour that could harm nearby property, the rock and vegetation can be designed to absorb and attenuate the accumulated stream energy preventing intense scour. This attenuation of energy and reduction of erosion magnitude will have localized influence on stream shape, form, and sediment transport with the lowering of velocity and shear stress, but this can aid in improving stream stability within a reach, including structure stability in its vicinity. The possibility of energy deflection and any subsequent scour or deposition in the main channel or opposite bank caused by the hybrid revetment is minimal and should only be localized, especially for wider stream beds. Although, in order to minimize the potential of stream-wide impacts on sediment transport and other natural processes, restraint needs to be used in determining revetment lengths and locations.
By constructing hybrid revetments, the positive attributes of the RSP and vegetation components can be highlighted. Streambanks will be repaired and protected against future damage with appropriate flow/velocity resistance and with minimal effects on stream processes, while stream ecology, health, and even stability will be improved.
5.1 Hybrid Revetment Design-Responsible Charge Explanation
Hybrid revetments, containing vegetation and RSP, are a type of engineering structure used to protect and stabilize streambanks from flood flows. These revetments carry flood control implications and can impact culvert and bridge performance because of changes in stream conveyance characteristics, such as velocity and flow-depth. Also, changes in stream characteristics, influenced by hybrid revetments, can affect the 100-year or 200-year (Central Valley Flood Protection Board (CVFPB) standard) base floodplain footprint and sediment transport capability.
During the design process, a civil engineer analyzes and models the effects of the hybrid revetment on the stream hydraulics that can impact culvert, bridge, and floodplain function. As part of the hydraulics analysis and modeling, a civil engineer will likely prepare a Location Hydraulic Study to check for possible floodplain encroachments, based on Title 23, Code of Federal Regulations, Part 650, Subpart A and HDM Topic 804 Floodplain Encroachments. From the analysis, the civil engineer can assess compatibility of the hybrid revetment project with Federal Emergency Management Agency (FEMA) Flood Insurance Studies (FIS) and accompanying Flood Insurance Rate Maps (FIRM). If encroachments and impacts to base flood elevations and floodplain footprint are found, the floodplain mapping revision process will need to be initiated through FEMA and local flood control agencies. In addition to floodplain assessment, the civil engineer must analyze stream stability as required by the National Pollutant Elimination System (NPDES) permit issued by the State Water Resources Control Board. For more information on determining stream stability, contact the Office of Stormwater Management Design in the HQ Division of Design.
While hybrid revetments have vegetation, it is a component of an engineering structure within a stream. In part, the vegetation intent is to contribute to mechanically reinforcing or stabilizing streambank soil and provide flow resistance, which are engineering functions falling under the definition of civil engineering in the 2013 Professional Engineers Act. According to Section 6731, civil engineering embraces the following studies or activities in connection with fixed works for irrigation, drainage, waterpower, water supply, flood control, inland waterways, harbors, municipal improvements, railroads, tunnels, airports and airways, purification of water, sewerage, refuse disposal, foundations, grading, framed and homogeneous structures, buildings or bridges. It also states that civil engineering includes the investigation of the laws, phenomena and forces of nature, as well as the preparation of designs, plans, specifications, and engineering reports associated with the areas above.
Given the civil engineering definition in the 2013 Professional Engineers Act, the responsibility to analyze flood control and floodplain impacts with legal implications, the responsibility of assessing stream stability, and the responsibility of being accountable to regulatory agencies for design viability, the civil engineer is liable for the design of hybrid revetments and is therefore in responsible charge.
While the civil engineer carries these responsibilities, input from the landscape architect is essential for describing harvesting techniques and subsequent planting in the hybrid revetment. Because of floodplain compatibility and stream conveyance issues, the landscape architect needs to confer with the civil engineer and obtain acceptance for all planting within the project limits at or below the 100-year or base flood elevations, or 200-year within CVFPB jurisdiction, whether the vegetation is in a revetment or not. This holds true for all projects in the stream environment.
In Section 7.1 (Hybrid Revetment Design) and its subsections of this DIB, specific roles for the civil engineer and landscape architect in the design of hybrid revetments are addressed.
6.1 Pre-Construction Modeling and Analysis
Prior to designing a hybrid revetment, design flows and average stream velocities must be calculated through hydrologic/hydraulic modeling and analysis. In the design phase, this information will be used in determining RSP size, scour depth, and design height of the revetment.
6.1.1 Hydrology
A proper first step in hydrologic analysis and modeling is to delineate the tributary (basin) area to the project site and possibly split the area into smaller areas referred to as sub-basins. Since most stream watersheds can have extensive areas offsite from the highway, the United States Geological Survey (USGS) 7.5-minute quadrangle maps are used to trace the tributary area. The USGS maps are found in graphic image form, such as TIFF and JPEG, and are also found in the form of a Digital Elevation Model (DEM). A DEM contains x-y-z topographic data points usually at 10 or 30-meter grid intervals, where "x" and “y" represent horizontal position coordinates of a topographic point and “z" is its elevation.
These data files and the USGS 7.5-minute quadrangle image files can be imported into software programs, including the Watershed Modeling System (WMS), AutoCAD Civil 3D, and ArcGIS, which are all readily available to the Caltrans engineer. After the data and image files have been imported and processed, the DEM provides a three dimensional topographic surface of a USGS quadrangle map and the image file gives graphical geographic reference. Within the map mode of Civil 3D and in ArcGIS, a tributary area can be physically delineated in a semi-manual manner creating polygons and shapes of the basin area(s) using various internal tools with the data and image files, while WMS has an automated watershed delineation capability. Each of the software programs can also provide basic basin and sub-basin calculations, including area and length.
Once the tributary area has been drawn and possibly split into sub-basins, the type of hydrologic calculation method for estimating design discharge can be chosen. A simple method is to perform hand calculations using the Regional Flood-Frequency Equations shown in HDM Index 819.2 Empirical Methods (Figure 819.2C) and Index 819.7 Region Specific Analysis (Figure 819.7A and Table 819.7A) for desert regions of California. The HDM also presents other peak-flow methods and hydrograph methods in Index 819.3 Statistical Methods, Index 819.4 Hydrograph Methods, and Index 819.5 Transfer of Data. A summary of hydrologic methods and their data needs is given in HDM, Table 819.5A
For discussion of hydrologic software possibilities, HDM Index 819.6 Hydrologic Computer Programs and Topic 808 Selected Computer Programs, Table 808.1 can be reviewed. From this Index and Topic, WMS is mentioned and is the most versatile and comprehensive hydrologic software program. Inclusive in one software package, WMS provides the engineer with the ability to import USGS DEM's and maps, soil maps, land-use maps, the ability to perform automated watershed (basin) delineation using DEM and map data, the ability to calculate extensive basin data (i.e. mean basin elevation, maximum stream length, maximum stream slope, centroid stream slope, time of concentration, etc.), the ability to setup modeling input interactively, and the ability to perform hydrologic analysis using different models (e.g. HEC-HMS, TR-20, TR-55, etc.).
An alternative to WMS for performing hydrologic modeling is Civil 3D Hydraflow Hydrographs. This program is easy to use without being data intensive, but is limited to the SCS-hydrograph method, the curve number loss method, and the Modified Att-Kin channel routing method in the hydrologic analysis and hydrograph generation. Some of the data required is basin area, basin slope, hydraulic length, time of concentration, curve numbers, storm distribution type, storm duration, and channel geometry.
After basin delineation has been done and hydrologic method and mode of analysis has been chosen, the ultimate goal for the hydrologic analysis is to determine the 50-year (2% probability) hybrid revetment peak design flow, as well as the 100-year (1% probability) or 200-year (0.5% probability) floodplain base flood peak flow. These flows will be input for the hydraulic modeling used in the design of the hybrid revetment, as well as the floodplain assessment.
6.1.2 Hydraulics
In HDM Table 808.1 Summary of Related Computer Programs and Web Applications, two computer programs are listed that will perform water surface profile analysis, which is a part of hydraulic modeling. The two programs are HEC-RAS that is a stand-alone application, and FESWMS that is an embedded modeling application within SMS. Each of these programs was previously mentioned in Section 2.1.2 of this DIB.
HEC-RAS is a one-dimensional surface-water model that considers steady gradually varied flow using an energy-based analysis, as well as unsteady flow using a momentum-based approach (USACOE 2010). The software requires cross-sectional geometry and reach lengths to be entered by the engineer for various locations, and it will provide calculations at each cross section that has been entered. The stream geometry can be generated in Civil 3D by data referencing a digital terrain model (DTM) from Surveys. Civil 3D has the ability to cut perpendicular and dog-legged cross sections from the DTM, and they can be exported directly to a HEC-RAS geo file. (See Introduction to Civil 3D for Hydrology and Hydraulic Design manual, Appendix HA-1.) For velocity computation at each cross section, HEC-RAS assumes that velocity is perpendicular and uniform across a given cross section (USACOE 2010). In the calculation of water-surface elevation, the elevation is assumed to be uniform and horizontal across a section (USACOE 2010).
In comparison, FESWMS is a two-dimensional surface-water model that can also be used for steady or unsteady flow. It uses a finite-element computational method to solve partial differential equations that represent fluid motion and sediment transport by approximating a system of algebraic expressions (NHI 2004). Instead of using representative cross sectional geometry of a stream, as done in HEC-RAS, FESWMS requires the engineer to create a finite element mesh having triangular and quadrilateral element shapes with nodes to represent stream bathymetry and any drainage structures. At each node within an element, algebraic expressions are solved simultaneously to determine hydraulic properties of interest (NHI 2004). In order to assign bathymetry to a finite element mesh, topographic survey data of a stream and its floodplain can be imported through the SMS interface in an ASCII file having “x-y" coordinates and “z" elevation for each survey point. Also using SMS tools, this bathymetry data is interpolated to the finite element mesh. Because the FESWMS model is two-dimensional, depth-averaged velocity can be calculated in two directions: the longitudinal (stream-wise) and lateral (stream-width) directions (NHI 2004). Unfortunately, velocity in the vertical direction is not performed. Both velocity and water-surface elevation are calculated or interpolated at each node in the finite element mesh (NHI 2004).
While FESWMS has the benefit of providing velocity calculation in two directions within the horizontal plane and can provide hydraulic computations at multiple node points without being tied to a cross section, it is complex and relatively difficult to use without expertise in hydrodynamics. The creation of the finite element mesh is labor intensive, and it usually requires numerous changes and refinement to get a working model, which may not necessarily be a successful hydraulic model. Given these issues, negatives tend to outweigh the benefits unless other reasons exist for using a two-dimensional model, such as a demand from a flood control agency.
For hybrid revetment design/modeling and accompanying floodplain assessment, HEC-RAS is recommended and will provide acceptable results. For the remainder of this DIB, HEC-RAS will be considered the hydraulic modeling software of choice. Through the use of Civil 3D to process stream cross sections, the time to setup the HEC-RAS model is reduced and will be much less time consuming than attempting to develop a FESWMS finite element model. Using the steady gradually varied flow simulation, HEC-RAS will provide conservative average velocity and flow-depths (water-surface elevations) to design the hybrid revetment. Also, HEC-RAS is an accepted hydraulic model by FEMA for determining floodplain compatibility in the post-construction condition.
6.1.2.1 Pre-Construction Manning's n-Value Selection
The choice of n-value for natural streams can be subjective, but it is very important in hydraulic modeling and analysis. The roughness value can change as flow-depth and hydraulic radius change, and it takes into account head losses in a stream caused by skin friction, internal distortion, and impact (Zipparro and Hasen 1993). The impact loss is especially important when features such as boulders, exposed roots, and vegetation are present in a stream, and is therefore an important consideration when determining n-values associated with hybrid revetments.
Typically, stream n-values are estimated visually comparing field conditions with predicted or known n-values based on channel conditions and descriptions from textbooks and professional references. When creating a HEC-RAS model, a separate n-value must be entered for the main channel, the left overbank, and the right overbank for each stream cross section. The following method for estimating n-values in a main channel was developed by Cowan (1956), presented by USGS in Water Supply Paper 2339 and Zipparro and Hasen (1993), recognized by FHWA, and adapted for this DIB, where “ne" is calculated based on certain stream parameters.
ne= (n0+n1+n2+n3+n4) m5
ne= main channel effective roughness value
Table A: Main Channel Bed and Bank Surface Material (n0)
| Condition | Value (n0) |
|---|---|
|
Earth |
0.020 |
|
Gravel |
0.024 |
|
Coarse Rock |
0.028 |
Table B: Main Channel Degree of Irregularity (n1)
| Condition | Value (n1) | General Description |
|---|---|---|
|
Smooth |
0.000 |
Smoothest stream possible given bed and bank material |
|
Minor |
0.005 |
Slightly eroded banks or bed |
|
Moderate |
0.010 |
Streams having moderate to considerable bed and bank roughness and moderately sloughed or eroded banks |
|
Severe |
0.020 |
Severely sloughed or scalloped banks; OR jagged and irregular surfaces of stream bed |
Table C: Main Channel Cross Section Variation (n2)
| Condition | Value (n1) | General Description |
|---|---|---|
|
Gradual |
0.000 |
Size and shape of stream cross sections change gradually |
|
Alternating Occasionally |
0.005 |
Large and small cross sections alternate occasionally; OR thalweg occasionally shifts side-to-side |
|
Alternating Frequently |
0.010-0.015 |
Large and small cross sections alternate frequently; OR thalweg frequently shifts side-to-side |
Table D: Main Channel Relative Effect of Obstructions (n3)
| Condition | Value (n1) | General Description |
|---|---|---|
|
Negligible |
0.000-0.004 |
A few scattered obstructions, including debris deposits, stumps, exposed roots, boulders, or piers that occupy less than 5% of cross-sectional area |
|
Minor |
0.010-0.015 |
Obstructions occupy less than 15% of cross-sectional area |
|
Appreciable |
0.020-0.030 |
Obstructions occupy from 15% to 50% of cross-sectional area |
|
Severe |
0.040-0.050 |
Obstructions occupy more than 50% of cross-sectional area |
Table E:- Main Channel Vegetation Density (n4)
| Condition | Value (n1) | General Description |
|---|---|---|
|
Low |
0.005-0.020 |
From small and supple shrub or tree seedlings on banks TO 2-year old shrubs or trees; OR grass and weeds are present on banks |
|
Medium |
0.030-0.065 |
From mature shrubs or trees growing on banks with foliage where distance/spacing exist between outer layers of trees and/or shrubs TO mature shrubs or trees growing on banks with full foliage where outer layers touch without being inter-grown and interwoven; OR sporadic TO frequent intervals of brush and weed patches on stream bed |
|
High |
0.065-0.100 |
Mature bushy trees or shrubs with full foliage inter-grown and interwoven with one another and possible undergrowth of weeds and/or brush; OR continuous brush, weeds, and/or cattails growing along stream bed |
Table F: Main Channel Degree of Meandering (m5)
| Condition | Value (n1) | General Description |
|---|---|---|
|
Minor |
1.00 |
Sinuosity= (Stream Length) / (Valley Length)= 1.0 to 1.2 |
|
Appreciable |
1.15 |
Sinuosity= 1.2 to 1.5 |
|
Severe |
1.30 |
Sinuosity= 1.5 or greater |
Example: Pre-Construction Main Channel Effective n-value Determination
n0= 0.020 Bed and banks are predominantly earthen surface
n1= 0.010 Banks are more than moderately eroded, but not in severe condition
n2= 0.000 Uniform cross sections
n3= 0.001 Obstructions are nearly negligible with occasional scattering of small boulders in bed, comprising less than 5% of cross-sectional area
n4= 0.010 Weeds are present on banks
m5= 1.15 Stream alignment meanders appreciably with sinuosity around 1.35
ne= (n0+n1+n2+n3+n4) m5
ne= (0.020+0.010+0.000+0.001+0.010) 1.15
ne= 0.047 (Pre-Construction Main Channel)
For estimating floodplain overbank n-values, the table below created by Chow (1959) as presented by Zipparro and Hasen (1993) is suggested.
Table G: Floodplain Overbank n-values
| Description | Minimum n-value | Normal n-value | Maximum n-value |
|---|---|---|---|
|
Pasture, short grass |
0.025 |
0.030 |
0.035 |
|
Pasture, high grass |
0.030 |
0.035 |
0.040 |
|
Cultivated, no crops |
0.020 |
0.030 |
0.040 |
|
Cultivated, mature row crops |
0.025 |
0.035 |
0.045 |
|
Cultivated, mature field crops |
0.030 |
0.040 |
0.050 |
|
Scattered brush, heavy weeds |
0.035 |
0.050 |
0.070 |
|
Light brush and trees, in winter |
0.035 |
0.050 |
0.060 |
|
Light brush and trees, in summer |
0.040 |
0.060 |
0.080 |
|
Medium to dense brush, in winter |
0.045 |
0.070 |
0.110 |
|
Medium to dense brush, in summer |
0.070 |
0.100 |
0.160 |
|
Dense willows, summer, straight |
0.110 |
0.150 |
0.200 |
|
Cleared land with tree stumps, no sprouts |
0.030 |
0.040 |
0.050 |
|
Cleared land with tree stumps, heavy sprout growth |
0.050 |
0.060 |
0.080 |
|
Heavy stand of timber, few down trees, little undergrowth |
0.080 |
0.100 |
0.120 |
|
Same as entry above, but flood stage reaching tree branches |
0.100 |
0.120 |
0.160 |
Once the main channel, left overbank, and right overbank channel n-values have been estimated for the pre-construction condition, they can be entered for each cross section in HEC-RAS. During calibration of the pre-construction model, n-values, especially in the main channel, will most likely be refined. The topic of calibration will be discussed in Section 6.1.2.2 and Appendix A.
6.1.2.2 Pre-Construction Hydraulic Model
In developing a pre-construction HEC-RAS model, several factors must be considered, such as longitudinal and lateral limits, processing of stream geometry for these limits, external boundary conditions and flow regime, stream flow and roughness data, possible structure (i.e. culverts, bridges) data, and model calibration.
As a rule of thumb, the longitudinal limit or length of hydraulic model should be ten to twenty stream bed widths upstream of the project site, plus ten to twenty stream bed widths downstream of the project site, plus the project site length, in order to allow convergence of proper solution by HEC-RAS. For example, if a stream bed width is 20 feet and the length of the proposed hybrid revetment for the project site is 100 feet, the minimum longitudinal model length considering ten stream bed widths is 500 feet (200 feet upstream of site + 100-foot project site length + 200 feet downstream of site).
For the lateral limit of the model, the cross-sectional width should be large enough to encompass the left and right floodplain overbanks. If the left floodplain overbank edge happens to be 100 feet laterally measured from the main channel layout line, and the right floodplain overbank edge happens to be 200 feet laterally measured from the main channel layout line, stream cross sections will need to be cut 100 feet left and 200 feet right along the calculated model length. A suggested initial cross-section interval for small models up to 1000 feet in length is 25 to 50 feet. During the development of the HEC-RAS model, cross sections can be added and/or deleted as necessary.
Knowing the longitudinal and lateral limits of stream geometry needed for the model, data can be extracted from the Civil 3D DTM surface created from ground and aerial surveys. Because floodplain widths can be extensive, the DTM from Surveys can be supplemented with DEM data in Civil 3D if needed to have sufficient stream geometry for modeling. Within Civil 3D, a data reference must be established to the DTM surface, and a horizontal alignment needs to be created for the stream main channel before cross sections can be cut or extracted.
After the creation of this alignment, section polylines for each desired stream cross-section station need to be drawn that will represent the “cut" line Civil 3D will use to extract the cross sections from the DTM. These section polylines should be drawn perpendicular to the flow in the main channel, and both of the overbank channels with a single polyline per stream station. Because the overbank channels and the main channel likely have independent horizontal alignments, Civil 3D has the ability to create dog-legged section polylines having multiple segments that may be straight or curved. By having this ability in Civil 3D, it allows the engineer to cut cross sections perpendicular to the main channel and each of the overbank channels with a single section polyline.
In comparison, the engineer could only create one-segment scan lines in CAiCE perpendicular to the main channel alignment, which made it difficult to obtain proper cross-sectional geometry in the overbank channels perpendicular to the flow and their alignments. When the cross sections have been extracted from the DTM in Civil 3D, a HEC-RAS geo file can be exported from Civil 3D and taken directly into HEC-RAS. See Introduction to Civil 3D for Hydrology and Hydraulic Design manual, Appendix HA-1 for more information regarding generating stream cross sections.
Once the stream geometry has been imported into HEC-RAS, other pertinent data can be entered. Each cross section will require the estimated pre-construction n-values for each main and floodplain overbank channel, reach lengths for each channel, and station coordinates delineating the overbank channels from the main channel. If any structures exist within the model limits, their appropriate information must also be entered.
Before the model can be run, external boundary conditions, such as normal depth, critical depth, or known water surface elevation, must be determined and entered for the begin and end model stations, which will provide HEC-RAS starting points for analysis. Also, the type of flow regime for simulation must be chosen before running the model. Generally, it is recommended to choose a mixed subcritical and supercritical analysis and allow HEC-RAS to find the best solution per cross section.
Another critical component of the model is of course the stream flow data. At a minimum, the pre-construction model should use the 50-year (2% probability) flow, the 100-year (1% probability) flow, and possibly the 200-year (0.5% probability) flow if in the CVFPB jurisdiction. Depending on the type of hydrologic analysis performed for the project, peak flows can be used to run steady flow analysis or an unsteady analysis can be done if hydrographs were generated and this type of analysis is desired. The steady flow simulation is more than adequate for the analysis required for hybrid revetment design.
When an initial working pre-construction model has been created, it is good practice to calibrate it with some known field data. One way of doing this is to physically measure depths and corresponding velocities of flowing water in a stream at known cross section stations at different times of the year to get a varied representation. Using the continuity equation mentioned in Section 3.1 (Q= vA), a flow can be associated with the field measured flow-depth and velocity. In basic terms, n-values can be iteratively increased or decreased in HEC-RAS to reproduce the field measured flow-depth with its calculated flow. This method refines n-values to calibrate the pre-construction HEC-RAS model to field measured depth and velocity, and it is easily applied to the main channel. See Appendix A- Hydraulic Model Calibration for a more detailed procedure in using field measured flow-depth and velocity to calibrate a model.
A second way of calibrating a pre-construction model is to use watermarks found in the field from past storm flows. This method can be used in the main channel or more commonly in the floodplain overbanks where flowing water occurs less frequently. For a field located watermark, the vertical depth can be measured from the stream bed thalweg to the watermark, which will be an assumed flow-depth. Because velocity cannot be measured associated with a watermark, Manning's equation discussed in Section 3.1, solved for volume flow rate (Q= 1.49ni-1AR2/3S1/2), must be used to approximate flow associated with the watermark flow-depth. Similar to the previous calibration method, n-values can ultimately be iteratively increased or decreased in the HEC-RAS model to reproduce the field measured watermark with its calculated approximate flow. See Appendix A- Hydraulic Model Calibration for further discussion and procedure using watermarks for model calibration.
When determining the n-values to use in the final pre-construction model, keep in mind that n-values can change with flow-depth depending on roughness changes within the stream. Therefore, engineering judgment should be used with consideration of the estimated and the fine-tuned n-values in determining the most appropriate representative n-values to be used in the final pre-construction model.
With the development of the final HEC-RAS pre-construction model, 50-year velocity and flow-depth can be found for use in the determination of the hybrid revetment RSP sizing, scour depth and the revetment design height. Also, 100-year or 200-year water surface elevations can be found to compare with the post-construction model to aid in determining potential floodplain impacts.
See Appendix B for a sample HEC-RAS pre-construction model.
7.1 Hybrid Revetment Design
This section of the DIB covers the necessary calculations for the RSP portion of the hybrid revetment and includes discussion and direction for the use of vegetation in the revetment.
7.1.1 RSP Calculations
In the design of the RSP portion of the hybrid revetment, potential scour depth must be determined to prevent undermining of the structure, the weight or size of the RSP outer layer must be calculated that will resist design velocity, the height of the revetment must be found based on design flow-depth and freeboard requirements, and the revetment length must be determined based on site conditions.
7.1.1.1 Potential Scour Depth
From HDM Index 873.3 (2) (a) (1) (b) Foundation Treatment, discussion is presented for estimating scour depth of flexible revetments, and it is cited that methods of scour estimation are rare. The CHANLPRO software program from the Army Corps of Engineers is mentioned in this HDM Index and is one method of performing this estimation. Another way of predicting scour is from field observations.
The equations used in the CHANLPRO method were developed by synthesizing laboratory and field data for scour potential at the bank-toe around a stream bend. This calculation is dependent upon mean channel flow-depth and water surface width upstream of a bend, in addition to centerline bend radius and maximum water depth within a bend (Maynord 1996). The equations used in estimating scour depth for this method are:
Design Scour Depth= Dmxb – Dmnc
Dmxb= Dmnc [1.8-0.051(Rc/Wu) + 0.0084(Wu/ Dmnc)]
Dmxb= maximum water depth in bend
Dmnc= mean channel flow-depth upstream of bend
Rc= centerline bend radius
Wu= water surface width upstream of bend
Because the above equations are empirical, limitations to certain values exist. More specifically, the values of the Rc/Wu ratio and the Wu/ Dmnc ratio must be within a defined range. Based on the range of field and laboratory data sets from Maynord (1996), Rc/Wu is limited from 1.5 to 10 (1.5< Rc/Wu<10) and Wu/ Dmnc is limited from 20 to 125 (20< Wu/ Dmnc<125).
When using the CHANLPRO method for scour estimation, these ratio ranges must be honored. For example, when Wu/ Dmnc is calculated to be less than 20, a value of 20 must be used in the Dmxb equation. Conversely, a value of 125 must be used in the Dmxb equation when Wu/ Dmnc is calculated to be above 125. This same logic must be applied with the Rc/Wu ratio. Given these conditions, it is simpler to solve the scour equations by hand, where proper values of the Rc/Wu and the Wu/ Dmnc can be controlled, than using the actual CHANLPRO software and is therefore recommended. Honoring and controlling the Wu/ Dmnc and Rc/Wu ratios is acceptable practice when using the CHANLPRO method for scour estimation.
Example: Potential Scour Depth Calculation Using CHANLPRO Method
From the HEC-RAS pre-construction model considering the 50-year design flow:
Dmnc= 11 feet
Wu= 89.32 feet
From the topographic survey data:
Rc= 300 feet was measured along the stream bend of the failed bank in plan view
Equation Conditions:
1.5< Rc/Wu<10 and 20< Wu/ Dmnc<125
Rc/Wu= 300/89.32= 3.69>1.5 and 3.69<10, OK to use 3.69
Wu/ Dmnc= 89.32/11= 8.12<20, MUST use 20 minimum value
Scour Equations:
Dmxb= Dmnc [1.8-0.051(Rc/Wu) + 0.0084(Wu/ Dmnc)]
Dmxb= 11 [1.8-0.051(3.69) + 0.0084(20)]
Dmxb= 19.58 feet
Design Scour Depth= Dmxb – Dmnc
Design Scour Depth= 19.58 – 11.00
Design Scour Depth= 8.58, Say 8.5 feet below stream thalweg
While a majority of bank failures needing stabilizing occur around a stream bend, failures can also be found within straight stream reaches. Even though the CHANLPRO method was developed for scour around a bend, it can be adapted for straight reaches. This can be done by using the minimum Rc/Wu value of 10, which will reduce the influence of the bend radius on the ultimate scour depth. Unfortunately, the Rc/Wu ratio cannot be completely eliminated because of the empirical conditions of the equations. When applying the CHANLPRO method for a straight reach, the potential scour depth will be more conservative than using it for a meandering reach.
As an alternative to the CHANLPRO method, scour potential can be estimated based on field investigations of the project site. By walking the site, scour holes of the damaged banks can be observed and their depth at the time of visit can be measured. Because scour depths typically are not observed during the peak of a significant storm when flow and sediment movement would be at their highest, a recommended factor of 1.2 should be applied to observed scour-hole depths to account for sediment deposition that typically occurs as flow decreases on the descending limb of a hydrograph. In other words, the scour hole observed in the field during clear weather conditions will be smaller than during peaks of storm events, so the 1.2 factor will account for this difference.
Design Scour Depth= 1.2 (DFOD)
DFOD= field observed depth of scour
Whichever scour potential method is chosen, the calculated depth will be subtracted from the stream thalweg at a given cross section. The RSP will be extended to this potential depth below the thalweg to resist undermining of the revetment. See Figures 15 and 16 for scour depth reference on cross sections.
All scour depth estimations/calculations will be performed by the civil engineer and are the responsibility of the civil engineer.
7.1.1.2 RSP Size
The weight or size of the outer layer of RSP is based on the California Bank and Shore (CABS) method identified in Final Report No. FHWA-CA-TL-95-10 and HDM Index 873.3 (2) (a) (2) (a) Stone Size, which considers average stream velocity (V), specific gravity of rock (sgr), and face bank angle with the horizontal plane (a).
W= 0.00002V6 sgr sin-3(70-a) (sgr -1)-3
From this equation, the minimum weight (W) of rock is calculated that will resist movement from the factored 50-year average stream velocity. In parallel flow within a straight stream reach, the average stream velocity (V) will be multiplied by a 2/3 factor, while a 4/3 factor will applied to average stream velocity (V) where flow is impinging on the streambank associated with a bend.
For conservatism when sizing the rock outer layer, use the highest 50-year average stream velocity from the HEC-RAS cross sections within the limits of the proposed revetment. At an individual cross section, this highest velocity may occur in the main channel or in one of the overbank channels.
Based on calculated minimum weight, performed by the civil engineer, the proper RSP class can be determined from HDM Table 873.3A Guide for Determining RSP-Class Outside Layer, its corresponding thickness from HDM Table 873.3C Minimum Layer Thickness, and its type of placement in the field from Section 72-2 Rock Slope Protection of the Caltrans Standard Specifications.
Example: RSP Outer Layer Sizing
From the HEC-RAS pre-construction model considering 50-year design flow:
V= 9.2 feet/second
NOTE: Since the revetment will be constructed within a stream bend having impinging flow, average stream velocity will be increased by 4/3.
V= (9.2) (4/3)= 12.27 feet/second
From the topographic survey data:
The streambank slope of a representative cross section was measured and found to be 2.23:1. The face bank angle can be calculated in the following manner:
sina= [1/(2.23)]
a=arcsin [1/(2.23)]
a=26.6 degrees
NOTE: Specific gravity (sgr)= 2.65 is a common value for granite rock. Specific Gravity (sgr)= 2.50 is the minimum value used in California practice.
W= 0.00002V6 sgr sin-3(70-a) (sgr -1)-3
W= 0.00002(12.27)6 (2.65) sin-3(70-26.6) (2.65 -1)-3
W= 123.78 pounds; USE 200 pounds to find RSP Class
From HDM Table 873.3A, considering“50-100" percent standard rock size and W= 200 pounds:
RSP Class= RSP Light
From HDM Table 873.3C:
RSP Light Minimum Thickness= 2.5 feet
From Section 72-2 of Standard Specifications:
RSP Light allows for Method B Placement
When the outer layer RSP Class is ¼ T (Ton), ½ T (Ton) or 1 T (Ton), a Backing RSP Class is required to be placed beneath the outer layer by the CABS Sizing method to reduce potential for bank erosion through the voids of these larger RSP Classes. For outer layers having 2 T (Ton), 4 T (Ton), or 8 T (Ton) RSP Classes, both a Backing layer and an inner layer must be placed under the outer layer in an effort to reduce void space within the revetment due to the very large rock associated with these RSP Classes and control soil loss through rock voids. See HDM Table 873.3B California Layered RSP and HDM Table 873.3C Minimum Layer Thickness for Backing and inner RSP layer requirements.
For material properties, placement, and payment of the RSP portion of a hybrid revetment, Section 72-2 Rock Slope Protection of the Standard Specifications will be followed.
7.1.1.3 RSP Design Height
As discussed in HDM Index 873.3 (2) (a) (2) (b) Design Height, the height of a revetment is the design high water plus a freeboard height with considerations of costs and severity of damage if overtopped.
The goal for the design high water is based on the 50-year (2% probability) flow, but can be modified using engineering judgement. From HEC-RAS results, the highest flow-depth within the proposed revetment limits from the pre-construction model should be chosen as the design high water.
The freeboard height determination is much more subjective, and factors such as debris type and volume, stream bed aggradation, and local agency requirements should be considered. Also, potential for water-surface superelevation around a bend should be considered when setting the freeboard height.
The 50-year design high water plus freeboard recommendation should be followed when possible, but the biggest exception to this goal occurs when the design height exceeds the main channel top of bank. Because floodplain overbank areas can be wide and extensive, the footprint of the RSP could grow exponentially if extended above and beyond the top of bank. This increased footprint would bring higher costs and permitting challenges that could make a project no longer viable. Given this possibility, the RSP portion of a hybrid revetment vertical limit (height) will typically end at the main channel top of bank, but the vegetation component should continue vertically up to the 50-year design plus freeboard recommendation. See Figure 14 for an illustration of 50-year flow-depth plus freeboard exceeding main channel capacity.
For cases where significant erosion has occurred above the main channel top of bank into its overbank(s), contact HQ Office of Highway Drainage Design to discuss alternatives for repair and protection.
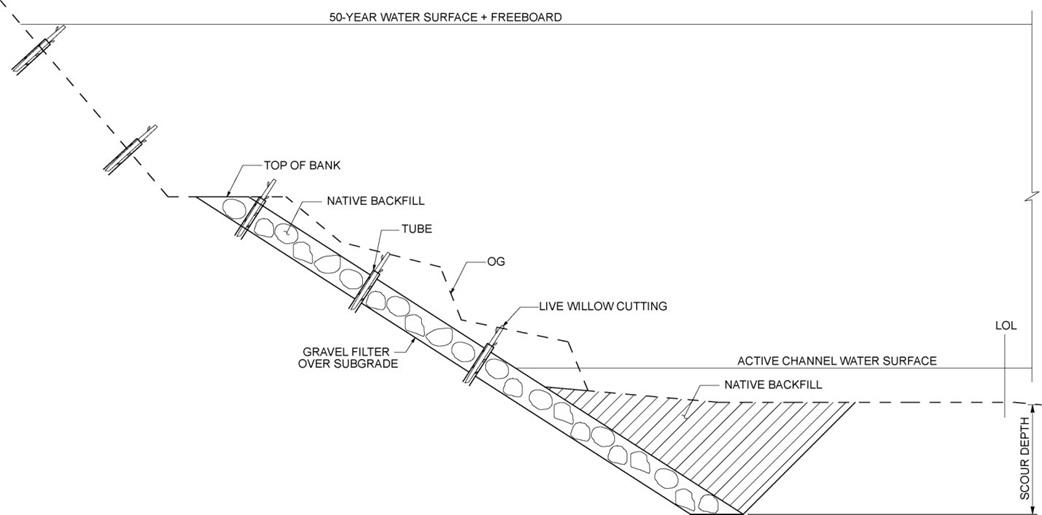
Figure 14: Design Height Exceeds Main Channel Capacity
7.1.1.4 RSP Design Length
The length of the RSP and the hybrid revetment is controlled by individual site conditions, and therefore direction in this sub-section is somewhat general. For streambank repair projects, the revetment must include the longitudinal limits of streambank failure at an absolute minimum. Whether hybrid revetments are being designed as a repair or as a proactive measure, it is beneficial to tie its two ends into stable materials to resist flanking, such as natural rock outcroppings (preferred) or dense soil. Ideally, the RSP length should be extended to include these features when feasible. Also, the RSP should be extended completely around a bend into its upstream and downstream tangents to prevent flanking and protect against magnified velocity and shear stress. For alternating meanders having short tangents between them, the RSP should be carried through the tangent between them to prevent scour from eddying and secondary currents that can occur as flow quickly changes direction through the curves.
While it is important to construct a stable hybrid revetment that will be resistant to undermining and flanking, restraint needs to be exercised to minimize changes to natural processes. For instance, if it is desired to stabilize bank(s) within a set of alternating meanders having a long tangent between the meanders, the entire tangent length between the curves should not receive RSP, only a minimum length through the long tangent should contain RSP to prevent flanking around the two curves. Instead of one continuous hybrid revetment, it should be split into two reducing its footprint and impacts.
Given the need to find a balance between revetment stability and stream impacts, as well as consider site factors and limitations, determining the design length can be challenging and should not be taken lightly.
7.1.2 Gravel Filter
As flow moves through the stream channel, the native base soil is subjected to a combination of groundwater seepage through the streambank subsurface and turbulence from stream surface water, which causes piping beneath a revetment and fine soil particles to migrate (FHWA 2009). A filter placed between the base soil and RSP layer will promote retention of fines in the base soil while still maintaining permeability and free passage of groundwater within the base soil and RSP interface (FHWA 2009). It is important for revetments to have proper hydraulic conductivity to minimize hydrostatic pressure behind the RSP created from base soil seepage and enhance revetment stability (FHWA 2009).
In lieu of an RSP fabric filter, commonly associated with revetments, a gravel filter will be specified and placed between the native base soil and RSP for hybrid revetments to avoid conflicts associated with planting vegetation and placing RSP fabric together. Also, a gravel filter is preferred because resource agencies are generally leery about the placement of fabric in the stream environment. If fabric were used, numerous holes would have to be cut in it to create openings for vegetation to be planted in the streambank soil. This would not only weaken the RSP fabric, but would also be a labor intensive and expensive operation, which makes the use of fabric as a filter non-viable. During construction, vegetation can be planted first in the streambank soil followed by the uniform placement of the gravel filter on the base soil around the hybrid revetment vegetation, which will simplify the construction operation.
In determination of proper gravel filter gradation, the Terzaghi method is listed as one of two recommendations in HDM Index 873.3 (2) (a) (1) (e) Gravel Filter. This method is well-known and is cited in many textbooks and professional papers. From Terzaghi, gravel filter design must meet two main criteria: interface stability (also known as piping) and permeability. In order to meet the piping criterion, the filter aggregate cannot be too large that would decrease base soil retention, yet to meet the permeability criterion, the aggregate cannot be too small that would inhibit seepage from the base soil subsurface through the filter. The governing equations for each Terzaghi criterion are as follows (Pilarczyk 2000):
Piping (Interface Stability) Criterion: (Df15/Db85) < 5
Df15= filter aggregate diameter that is smaller than 85% of filter aggregates, but larger than 15%
Db85= base soil particle diameter that is smaller than 15% of soil particles, but larger than 85%
Permeability Criterion: (Df15/Db15) > 5
Db15= base soil particle diameter that is smaller than 85% of soil particles, but larger than 15%
In order to use the Terzaghi method and verify the piping and permeability criterion, soil samples from the project site must be obtained for testing. A request needs to be made of the District Materials Lab for native soil samples to be collected from the streambank that will receive the hybrid revetment. The request must give direction for samples to be taken every 100 feet along the length of the revetment, or a minimum of 3 samples total if revetment length is less than 300 feet, and each must contain the top 1-foot of native soil from the streambank. After the samples have been collected, a sieve analysis and generation of gradation curves of each sample must also be requested of the Material Lab.
In Table H, a universal gravel filter gradation is presented, which should work for many stream sites in California and eliminate the need for a site-specific gravel filter design for every project. To use this gravel filter, the interface with the native base soil must be verified by reviewing the gradation curves of the samples provided by the Lab. From these gradation curves, Db15 must be 0.27 inches (7 millimeters) or smaller to meet the Terzaghi permeability criterion, which is about 1.5 times the opening of a No. 4 sieve and similar to a coarse sand size. For the piping criteria to be met, Db85 from the gradation curves must be larger or coarser than 0.27 inches (7 millimeters). The piping criteria will easily be achieved at various stream sites.
According to FHWA (2009), gravel filter thickness is typically between 6 and 15 inches depending on aggregate size comprising the filter. For the universal gravel filter, 6 to 8 inches is the recommended thickness.
Table H: Universal Gravel Filter Gradation
| Sieve Size | Percent (%) Passing |
|---|---|
|
6" |
95-100 |
|
4" |
65-95 |
|
3" |
30-65 |
|
2" |
20-35 |
|
1 ½" |
10-25 |
|
1" |
0-10 |
In addition to the permeability and piping criteria verification between the base soil and gravel filter, these criteria must also be checked for the interface between the gravel filter and the RSP layer directly above it. For ¼ Ton RSP class and smaller classes, the gravel filter will be in direct contact. The aggregate from the filter must not bleed through the voids in the RSP and must also allow base soil seepage to flow through the RSP and reduce hydrostatic pressure buildup. Because of the larger voids associated with RSP, the piping criteria is more critical with the gravel filter/RSP interface than the interface between the base soil and gravel filter. The RSP classes beginning with ½ Ton and larger require a Backing layer to be provided in the CABS layered sizing method that takes into account piping and permeability criteria. When using these larger RSP classes, the gravel filter interface only needs to be considered for the Backing RSP layer.
The permeability and piping equations have been rewritten for the gravel filter and RSP interface:
Piping (Interface Stability) Criterion: (DRSP15/Df85) < 5
DRSP15= RSP diameter that is smaller than 85% of RSP, but larger than 15%
Df85= filter aggregate diameter that is smaller than 15% of filter aggregates, but larger than 85%
Permeability Criterion: (DRSP15/Df15) > 5
Df15= filter aggregate diameter that is smaller than 85% of filter aggregates, but larger than 15%
As shown in Tables I and J, the universal gravel filter will meet the Terzaghi criteria for the ¼ Ton RSP class down to Backing No. 2. In the criteria calculations, the DRSP15 was conservatively estimated given the percent-larger-than gradation by mass in Section 72 of the Standard Specifications and its small potential for significantly varying rock diameters rather than percent-finer-than by diameter.
Table I: Piping Criterion Check, Universal Filter and RSP Interface
| RSP Class | DRSP15 | Df85 | (DRSP15/Df85) < 5 |
|---|---|---|---|
|
Backing No. 2 |
6.8" |
4.57" |
1.49 < 5 OK |
|
Backing No. 1 |
9.6" |
4.57" |
2.10 < 5 OK |
|
Facing |
9.6" |
4.57" |
2.10 < 5 OK |
|
Light |
13.3" |
4.57" |
2.91 < 5 OK |
|
¼ Ton |
17.6" |
4.57" |
3.85 < 5 OK |
Table J: Permeability Criterion Check, Universal Filter and RSP Interface
| RSP Class | DRSP15 | Df15 | (DRSP15/Df15) > 5 |
|---|---|---|---|
|
Backing No. 2 |
6.8" |
1.34" |
5.01 > 5 OK |
|
Backing No. 1 |
9.6" |
1.34" |
7.16 > 5 OK |
|
Facing |
9.6" |
1.34" |
7.16 > 5 OK |
|
Light |
13.3" |
1.34" |
9.93 > 5 OK |
|
¼ Ton |
17.6" |
1.34" |
13.13 > 5 OK |
If the native base soil is not compatible with the universal gravel filter, where Db85 is less than 0.27 inches and/or Db15 is greater than 0.27 inches, a unique gravel filter gradation for an individual project site will have to be developed. In the development of this gradation, the Terzaghi criteria must be satisfied and internal stability of the unique gravel filter will need to be considered as well. As a rule of thumb to achieve internal stability, the following relationships can be used to aid in determining gravel filter gradation (Pilarczyk 2000):
Df10 < 4Df5
Df20 < 4Df10
Df30 < 4Df15
Df40 < 4Df20
Df5= filter aggregate diameter that is smaller than 95% of filter aggregates, but larger than 5%
Df10= filter aggregate diameter that is smaller than 90% of filter aggregates, but larger than 10%
Df15= filter aggregate diameter that is smaller than 85% of filter aggregates, but larger than 15%
Df20= filter aggregate diameter that is smaller than 80% of filter aggregates, but larger than 20%
Df30= filter aggregate diameter that is smaller than 70% of filter aggregates, but larger than 30%
Df40= filter aggregate diameter that is smaller than 60% of filter aggregates, but larger than 40%
Another factor that needs to be considered in developing the unique gravel filter gradation is the uniformity coefficient, which is a measure of particle size distribution (Das 1985). Because the gravel filter must be permeable, the material should not be too well-graded. However, the gravel filter must not allow soil loss so it should not be too poorly graded either. Given these opposing demands, a uniformity coefficient between 2.5 and 3.5 is recommended for gravel filter design, where greater than 4 is an indicator of well-graded gravel (Das 1985). When a uniformity coefficient is within the suggested range, the gravel filter should be able to provide permeability while also reducing loss of native base soil.
Uniformity Coefficient= Df60/ Df10 (Das 1985)
Df60= filter aggregate diameter that is smaller than 40% of filter aggregates, but larger than 60%
Using the Terzaghi criteria, the internal stability rule of thumb, and the uniformity coefficient recommendation, a unique gravel filter gradation can be generated in cases where the native base soil is not compatible with the universal gravel filter. Once the interface between the base soil and unique gravel filter has been checked and satisfied for the Terzaghi criteria, the interface between the unique gravel filter and RSP layer directly above must also be checked and satisfied.
In Appendix D, a nonstandard special provision (NSSP) is provided for the universal gravel filter. This NSSP could be modified if a unique gravel filter design is required. Either way, the NSSP will have to be submitted to HQ Hydraulics for review and ultimate approval. Because gravel filter is not a standard item, a new BEES item code will need to be created. It is suggested that the gravel filter should be paid for by volume (cubic yard).
All work involving the gravel filter will be performed by the civil engineer and is the responsibility of the civil engineer.
7.1.3 Grading
A subgrade line or limit needs to be established on a typical hybrid revetment cross section for the contractor to follow that will create a uniform and stable plane for the RSP to be placed. After subgrade has been excavated in the field, the contractor can perform planting through the subgrade as shown on the plans, as well as place the RSP layers according to the thicknesses perpendicular to the subgrade. In general, the RSP and gravel filter thickness, the estimated scour depth, and the revetment streambank slope are the major controlling factors influencing the subgrade limit.
The physical slope of the subgrade along the streambank (i.e 1.5:1, 2.0:1, 2.3:1, etc.) is best found by reviewing existing stream cross sections in MicroStation or AutoCAD and first considering the “finished" grade or top of the RSP outer layer. For reference, finished grade and subgrade are noted on a hybrid revetment cross section in Figure 16. The process of determining finished grade slope, and ultimately subgrade slope along the streambank, can be done by looking at various cross sections and drawing the finished grade in MicroStation or AutoCAD to determine the physical slope(s) that fits the best. The slope of the finished grade should be similar to field conditions upstream and downstream of the revetment location. Keep in mind that the finished grade or top of the revetment must match flush with natural slope and elevation on its two longitudinal ends. In order to maximize RSP placement stability, the finished grade and subgrade slope should be 1.5:1 or flatter, and may vary over the longitudinal limits of the revetment.
Once the slope(s) of the revetment finished grade has been determined, the depth of the subgrade cut along the streambank can be calculated by summing the RSP thicknesses, including any Backing and inner layers, and the gravel filter thickness. This depth of cut will be perpendicular to the finished grade and subgrade physical slope. By finding the required finished grade slope in MicroStation or AutoCAD and knowing the thickness of all RSP and the gravel filter, the subgrade line along the revetment slope is established and can be seen in Figure 15. Also shown in Figure 15, the lowest end of the subgrade line must extend down to the scour depth elevation, which will be the bottom of the embedded toe.
From the bottom of the embedded toe, a horizontal segment of the subgrade line must be included. This segment is the horizontal width or projection of the RSP and gravel filter. Based on face angle slope (a) of the subgrade and finished grade revetment slope, and the total thickness of the RSP and gravel filter (T), the horizontal segment width (W) can be calculated with the following equation:
W= Tcos-1(90-a)
As with any type of subgrade excavation, the beginning and end points must intersect or “daylight" with original ground (OG). In Figure 15, the beginning of subgrade excavation occurs at the upper portion of the streambank slope and intersects with OG. For the end of subgrade limit, it is recommended to use a 1:1 or flatter slope to join the bottom of the embedded toe to OG and daylight the excavation. After RSP has been placed in the field, native backfill will be placed and compacted to key-in the embedded RSP toe.
Because the subgrade is the foundation of the hybrid revetment, it is integral to successful construction and its ultimate function. With proper subgrade excavation, the planting, the gravel filter placement, and the RSP placement are made simple for the contractor. Given its importance, it is recommended to provide the contractor and resident engineer with subgrade staking notes and have District surveys perform staking so that the excavation operation can occur smoothly and efficiently.
Using Civil 3D, a subgrade corridor can be created that will produce these staking notes and earthwork quantities. In order to develop a corridor model of the subgrade, stream horizontal alignment, subgrade vertical alignment, and subgrade assembly must be created. See AutoCAD Civil 3D Introduction to Civil 3D for Hydrology and Hydraulic Design manual, Chapter 3 for direction with horizontal and vertical alignments and Appendix HA-2 for development of assemblies, corridor, and staking notes.
In addition to the staking notes, it is beneficial for the contractor and resident engineer to have finished grade (design) cross sections of the revetment for reference in the field. With the generation and use of the subgrade staking, finished grade staking field staking is not necessary. The RSP and backfill can be easily constructed using the plans and the finished grade cross sections. Instead of using Civil 3D to generate finished grade cross sections, it is easier to create these cross sections using MicroStation or AutoCAD. The finished grade limits can be physically drawn in MicroStation or AutoCAD on the subgrade cross sections generated in Civil 3D, and elevation and offset of critical points can be determined using software tools. See Appendix C for sample finished grade cross sections.
All grading for the hybrid revetment will be performed by the civil engineer. Grading is discussed in Section 72-2.03A General of the Standard Specifications, and its payment is included in cost per cubic yard or ton of RSP.
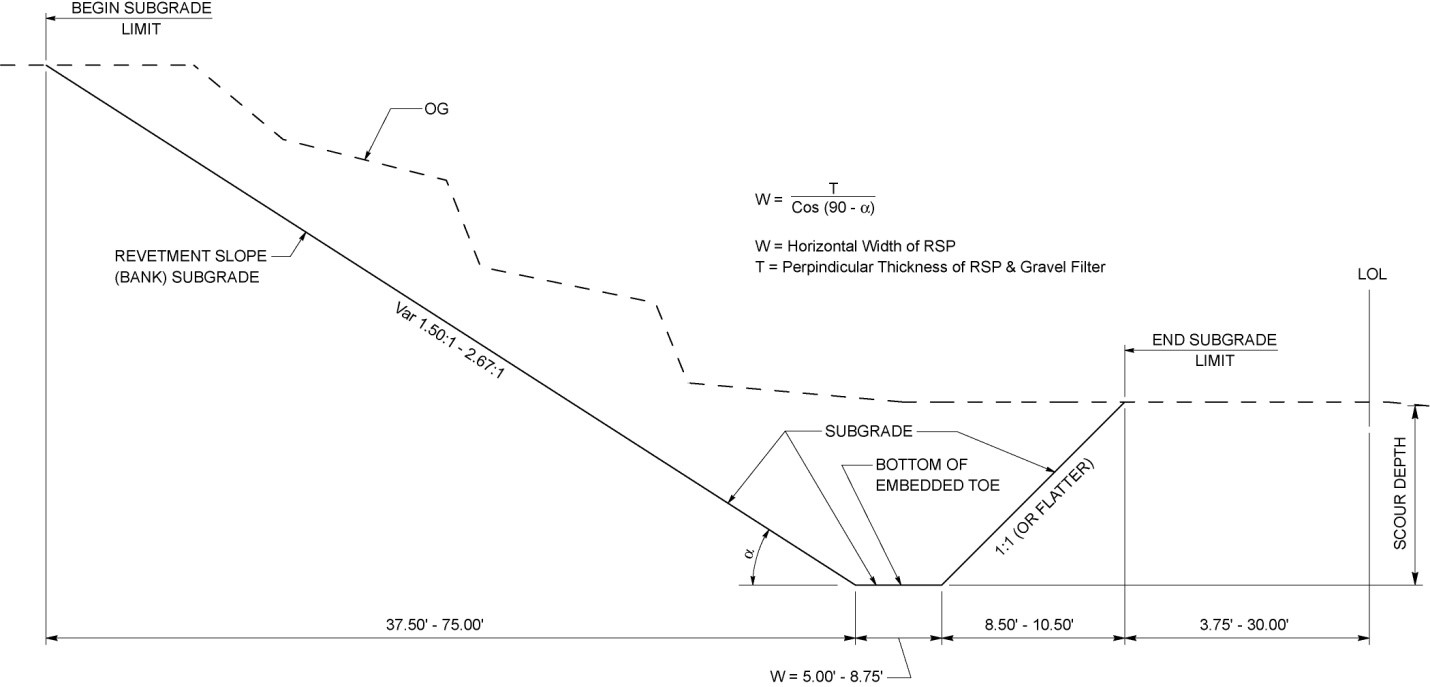
Figure 15: Subgrade Cross Section
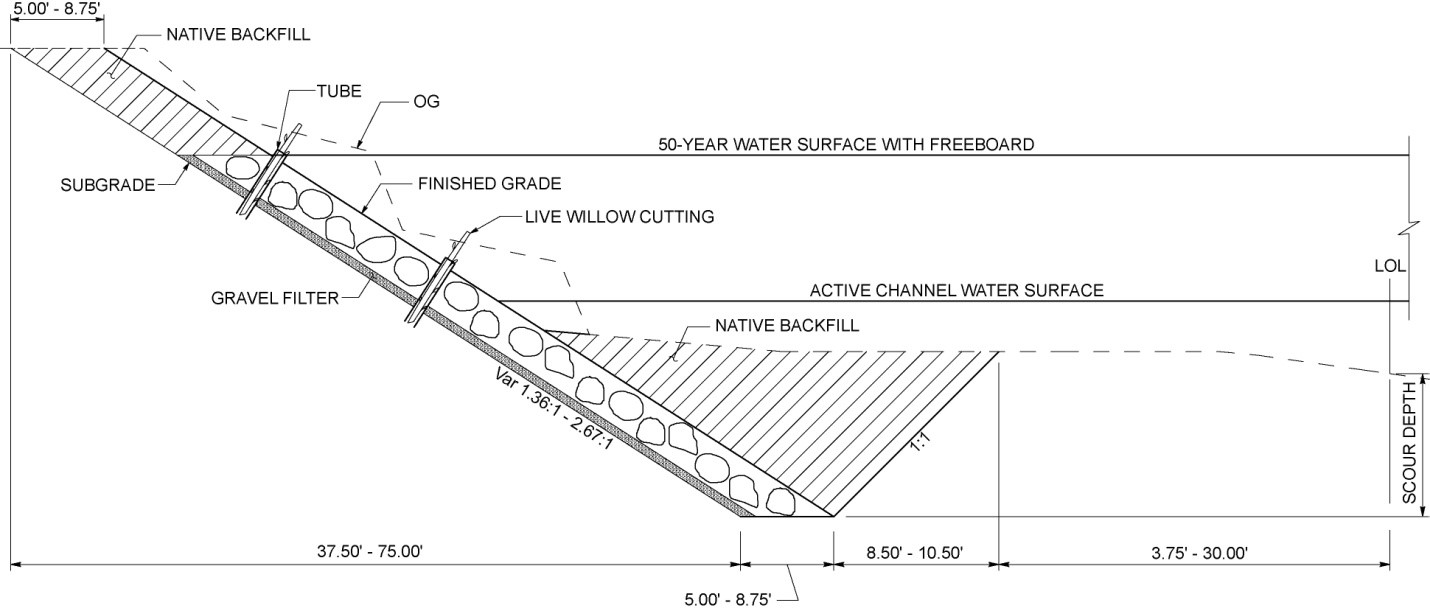
Figure 16: Hybrid Revetment Cross Section
7.1.4 Vegetation
Among the many species of woody riparian vegetation, the willow species has one of the most consistent rooting success rates in streambanks ranging from 40% to 100% (NRCS 2008). Cuttings from willows are a popular choice to establish vegetation in streambanks because they contain root buds along their entire stem and have the ability to root regardless of the stem orientation with a bank. In addition, willow cuttings develop strong fibrous root systems that grow quickly (NRCS 2008). The cutting end that is contact with the soil will sprout roots, while the other end will sprout leaves and stems when in contact with the air (NRCS 2008). Given their success rate, ease of harvesting and planting, as well as their vast availability, willow cuttings have been chosen to be the vegetation component in hybrid revetments. The predominant species of willow within a 5 to 7 mile radius of the project site should be used as the source for the cuttings. For areas where willows may not be prolific and plentiful, such as in arid climates, the landscape architect may recommend comparable vegetation alternatives to the civil engineer. See Figures 17 and 18 for an example of live willow cuttings incorporated into RSP in an effort to protect a streambank.
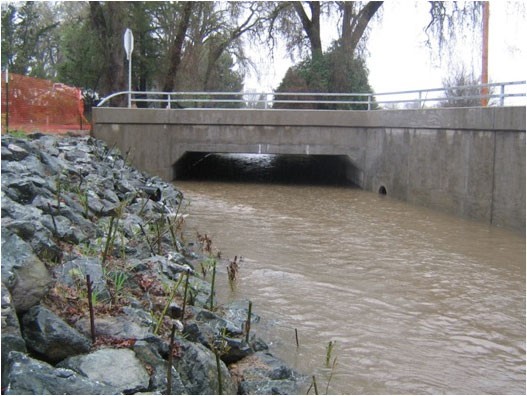
Figure 17: Gibbson Creek, Cuttings through RSP (Right After Installation, Fall 2010)
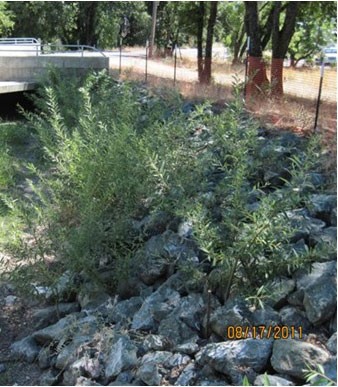
Figure 18: Gibbson Creek, Cuttings through RSP (Summer 2011)
From NRCS (2008), a common harvesting and planting method is presented for willow cuttings:
- Collect cuttings having proper diameter and length from healthy (non-diseased) willows within project vicinity without defects, such as knots or stripped bark.
- Remove side branches and top growth from cutting.Trim the bottom or basal end to a 45-degree angle and trim the top so it is flat.When trimming, keep in mind that at least two bud scars should be above ground when cutting is ultimately planted.
- Soak live cuttings for fourteen days, or plant the cuttings the day they are harvested.
- Use a rod or auger to create a pilot hole and place cutting basal end into hole.To ensure they receive sunlight, the cuttings should be placed taller than the surrounding vegetation.Plant cuttings at desired spacing and pattern.
- Fill hole around cutting with a water and soil slurry mixture.
The willow cuttings may be planted into the streambank with either a vertical or perpendicular orientation. See Figures 19 and 20 for orientation illustration. The cuttings will be planted into the revetment subgrade and must be long enough to extend through the RSP and gravel filter layers, which are placed at a thickness perpendicular to the streambank. As seen in Figure 21, the total cutting length is the sum of the cutting embedment depth (A), the RSP layer(s) and gravel filter thickness (B), where the “B" dimension depends upon cutting orientation with streambank, and the cutting protrusion length from the RSP outer layer (C+D). Normally, the embedment depth and protrusion length are influenced by existing vegetation and soil conditions at the project site.
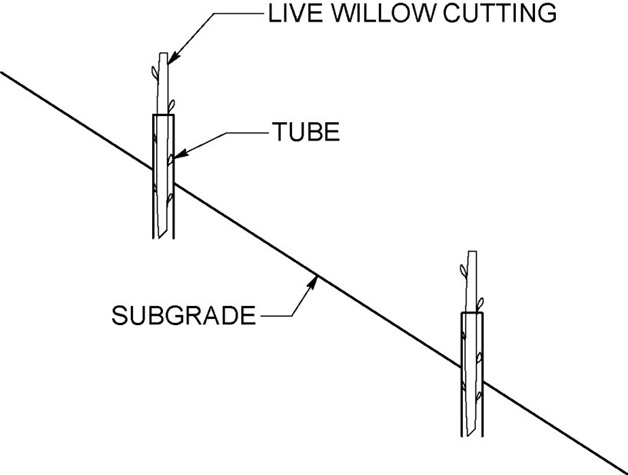
Figure 19: Live Cutting Vertical Orientation
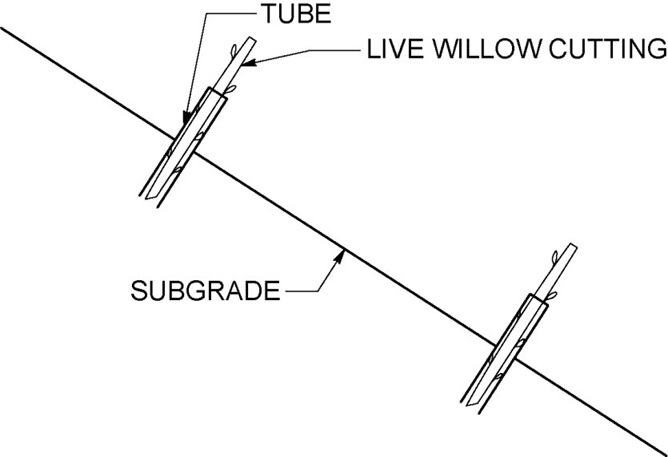
Figure 20: Live Cutting Perpendicular Orientation
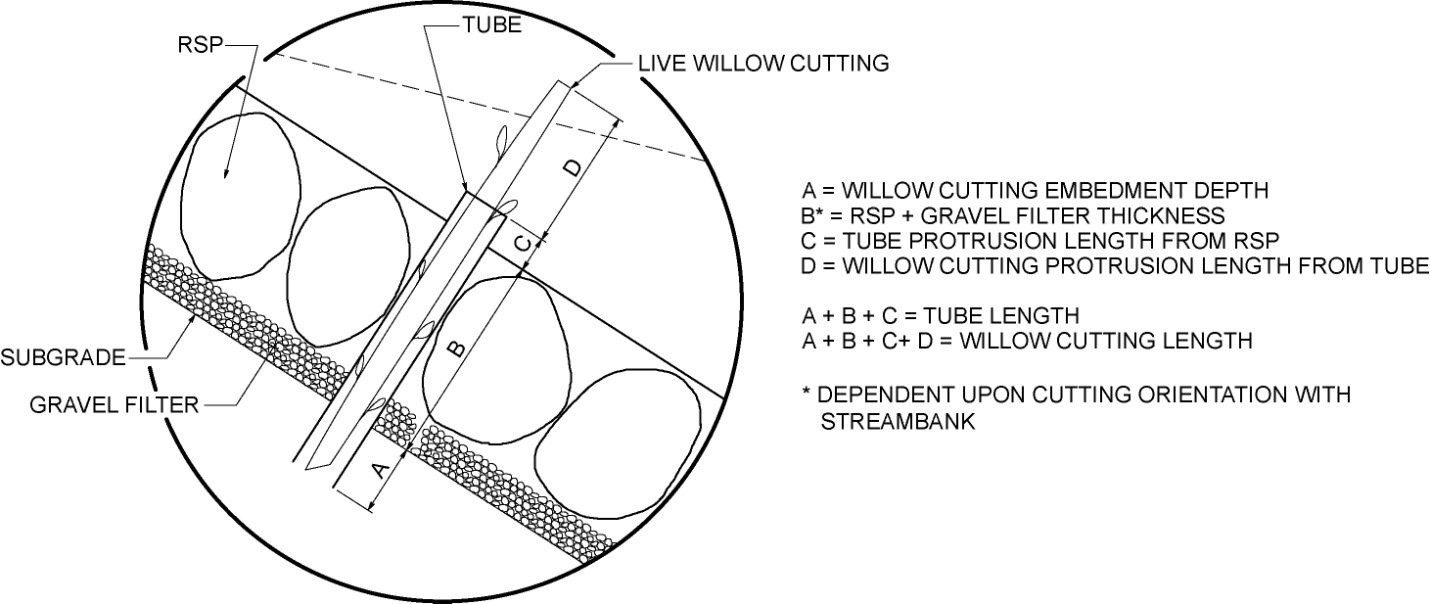
Figure 21: Live Cutting Detail
An advantage of the vertical orientation is that the amount of vegetation projection and encroachment into the main channel at maturity is minimized lessening potential stream hydraulic impacts from the perpendicular cutting orientation that would have greater tendency to project into the main channel, however a disadvantage of the vertical orientation is that the required cutting length is increased. When a cutting is placed vertically and completely through the RSP and gravel filter, the thickness dimension of these layers is skewed or lengthened because the rock and gravel are placed to their specified thickness measured perpendicular to the streambank slope. Due to the skewed thickness, the cutting length must be longer to penetrate completely through the RSP and gravel filter. For example, a 2.5:1 streambank slope receiving ½T (½Ton) (Method A Placement), Backing No. 1, and gravel filter, considering 1-foot subgrade soil embedment and 2-foot protrusion length from RSP outer layer, would require a cutting length equal to 9.4 feet having vertical orientation, while the perpendicular orientation length is 8.7 feet.
As the streambank slope steepens, this cutting length difference becomes greater. A 1.75:1 slope with the same RSP and gravel filter configuration would require a cutting length of 10 feet versus the 8.7 feet for the perpendicular orientation, again considering 1-foot embedment and 2-foot protrusion length. Similar to cutting embedment depth and protrusion length, the cutting orientation is influenced by existing vegetation and soil conditions at the project site.
In cases where average stream velocity triggers the need for large and thick RSP layers, such as 4T (4Ton) and 8T (8 Ton) RSP class revetments requiring combination inner layers (i.e. 1T (1Ton) over ¼T (¼Ton)), the willow cutting length is significant, especially if a vertical cutting orientation is specified. The largest CABS RSP revetment is 8T (8Ton) underlain by an inner layer comprised of 2T (2Ton) over ½T (½Ton) that is underlain by Backing No. 1. The total thickness of this 8 Ton revetment is around 19 feet. For a perpendicular orientation, the cutting length would have to be a minimum of 19 feet to completely penetrate the RSP layers, excluding the gravel filter thickness, embedment depth, and protrusion length, whereas a vertical orientation on a 1.5:1 streambank would yield a 23-foot minimum cutting length to completely penetrate the RSP layers.
Given these significant lengths, the cuttings will more than likely be hard to come by in the field. Also, it should be noted that the design velocity for revetments of this size will be greater than 20 feet/second that is almost twice the 12 feet/second permissible velocity for a mature willow (Fischenich 2001), which means that the willows will be regularly swept away at storm events much more frequent than the HDM suggested 50-year (2% probability) design event. Taking these factors into consideration, it is likely infeasible to use vegetation in revetments requiring 4T (4Ton) and 8T (8 Ton) outer layer rock. Therefore, it is recommended to limit the use of hybrid revetments to 2T (2Ton) RSP class or smaller.
Since the live cuttings must be planted directly into the revetment subgrade, they will need to be placed prior to the gravel filter and RSP layer(s) following subgrade excavation (see Section 10.1 for construction order of work). It would be labor-intensive, time-consuming, expensive, and therefore impractical to attempt to place the gravel filter and RSP layer(s) first on the subgrade and afterwards try to move rock accordingly to plant the willow cuttings. In order to provide some protection for the willow cuttings during rock placement, it is recommended that the cuttings be placed inside circular, perforated cardboard tubes that will also be embedded into the subgrade and protrude through and extend beyond the RSP outer layer. If nothing else, the tubes will provide better visual recognition of the cuttings for the equipment operator to avoid and prevent damage when placing rock. An example site using tubes is shown in Figures 22 and 23 where vegetation is planted through corrugated plastic tubes within RSP. As previously stated, degradable cardboard tubes are recommended instead of plastic.
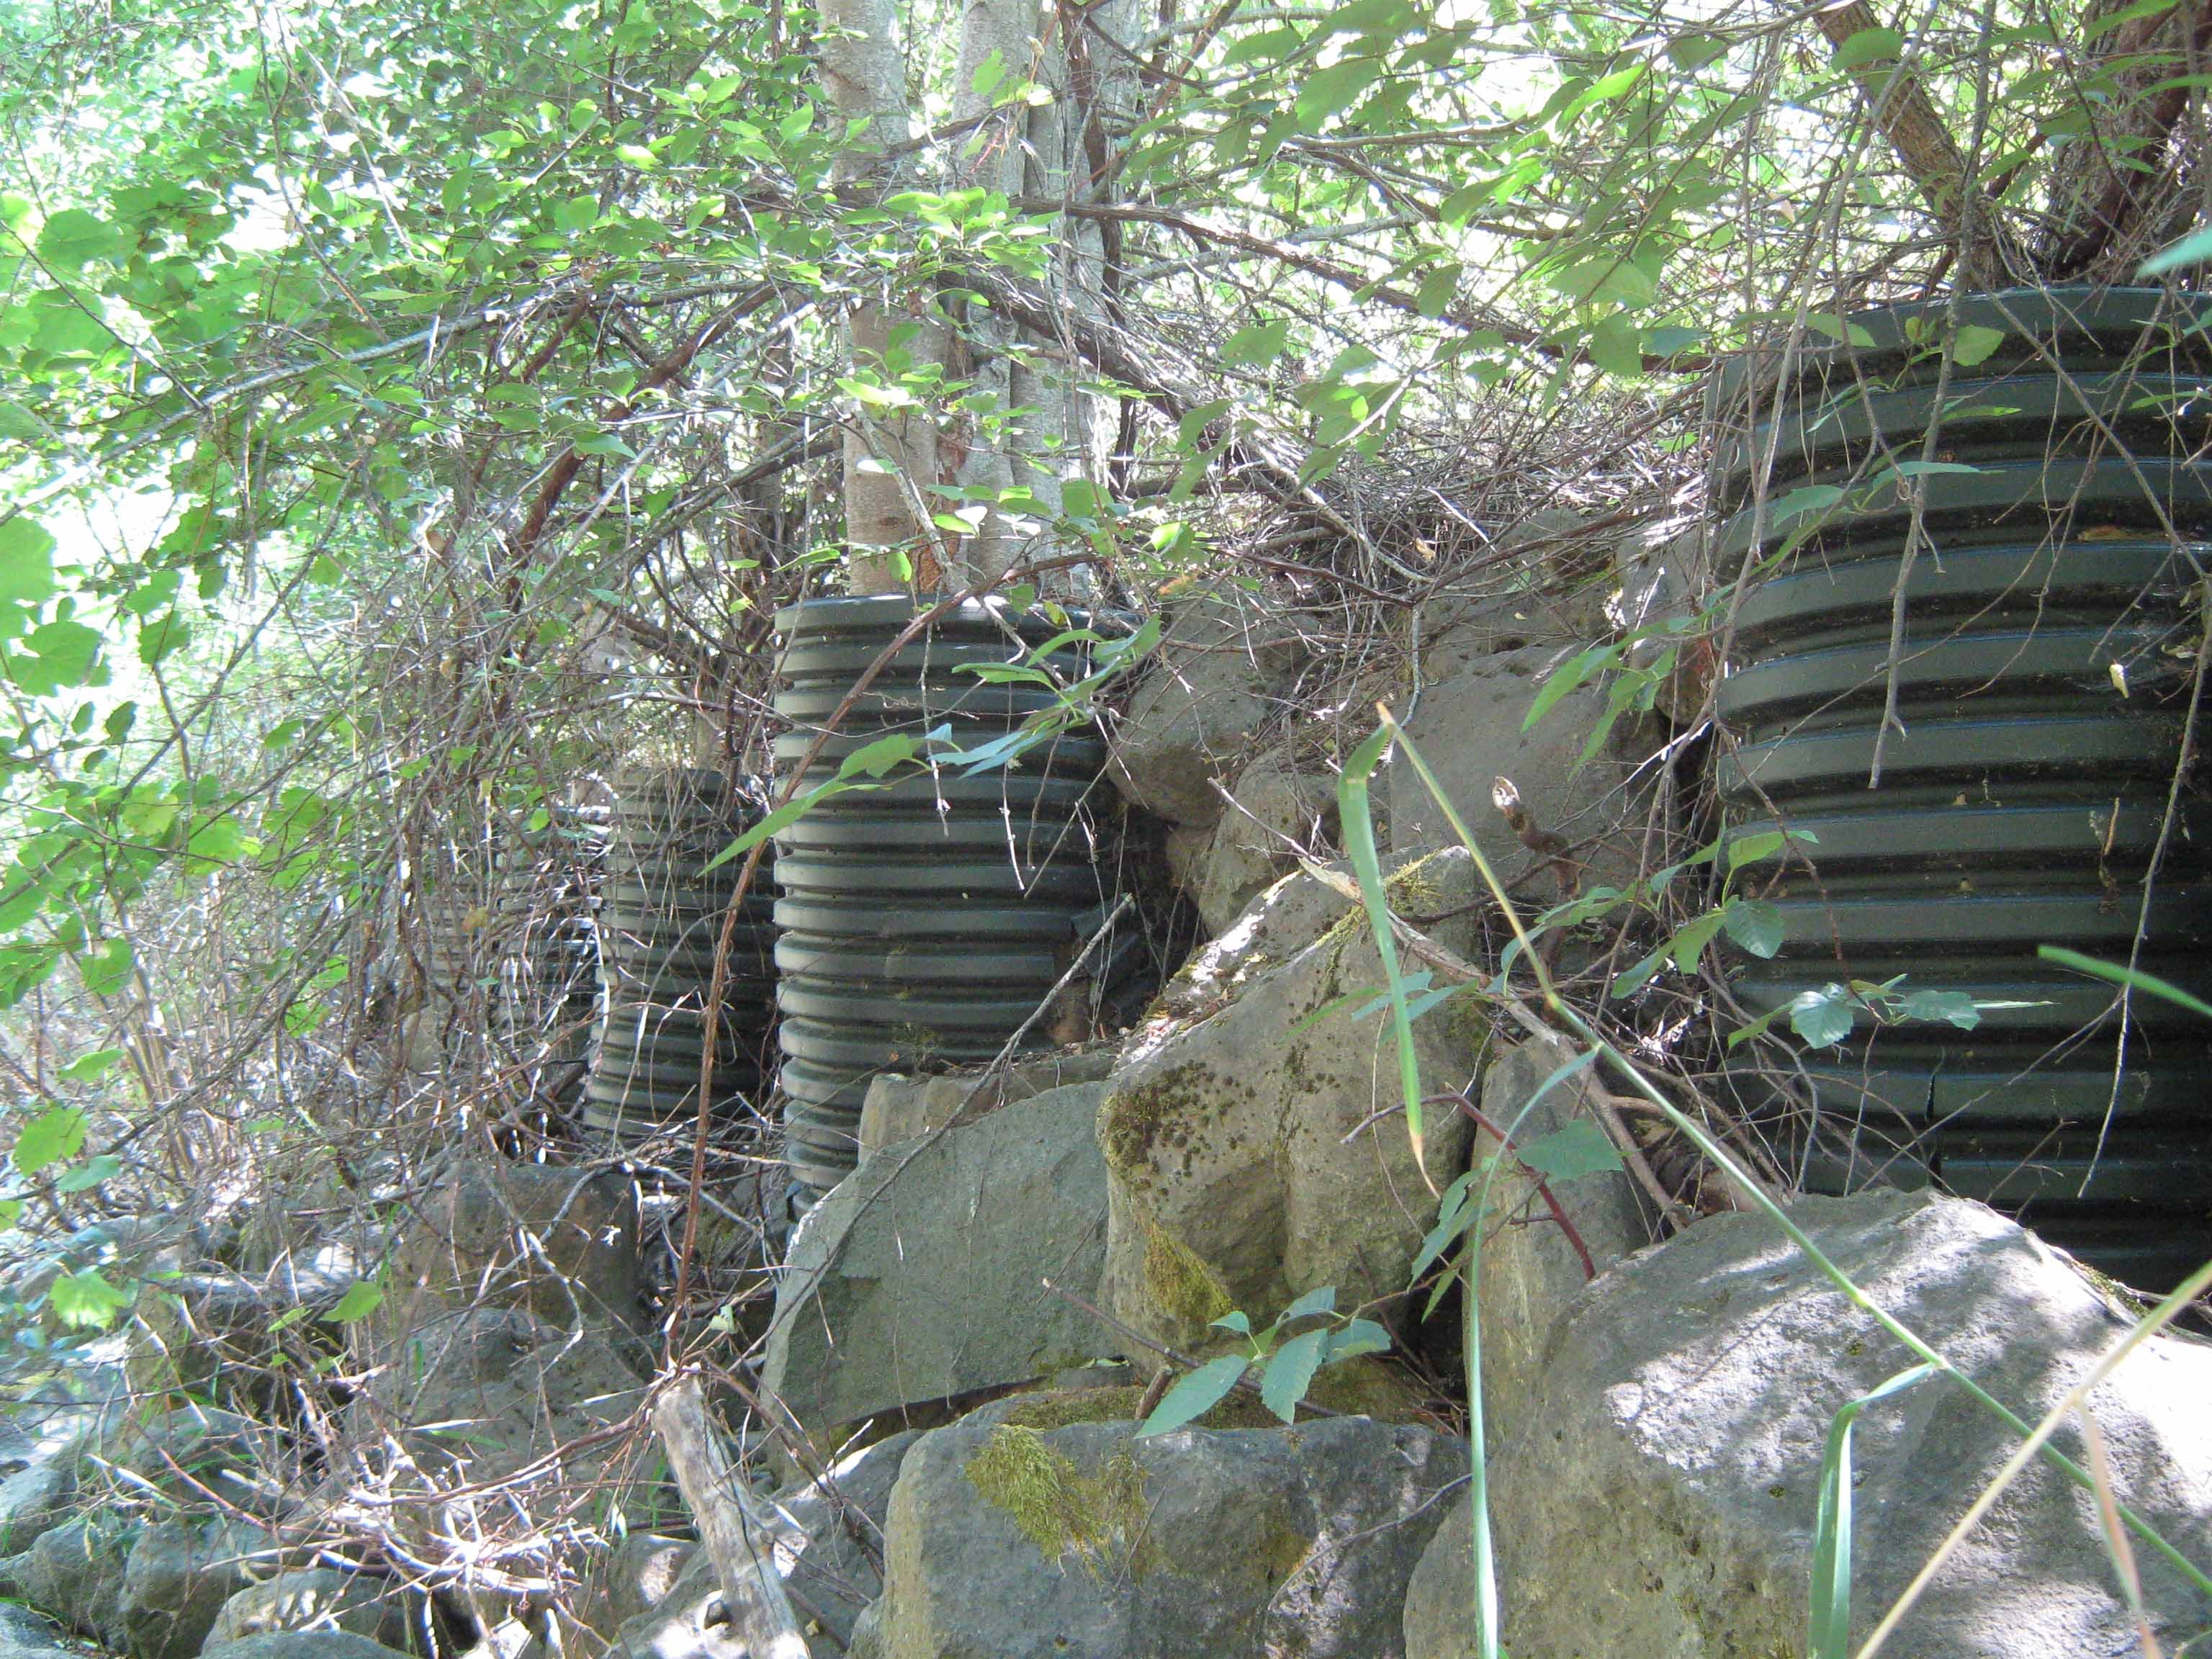
Figure 22: Weaver Creek (2012), Mature Vegetation in Plastic Tubes
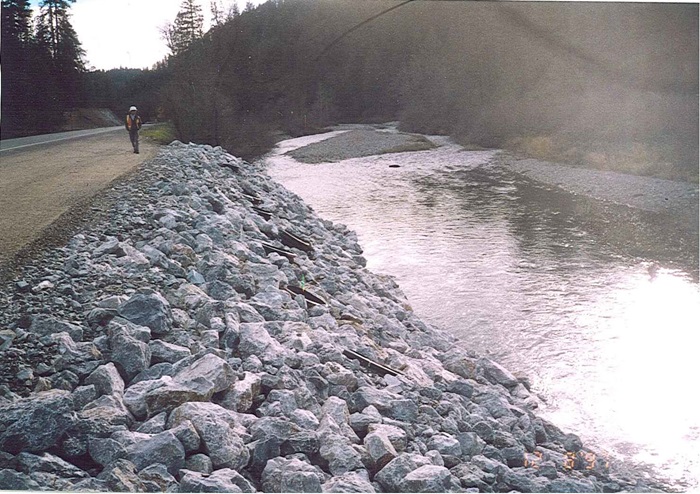

![]()
One such proprietary cardboard tube on the market is called SONOTUBE, but other products exist as well that will prevent sole sourcing. These tubes vary in diameter from 6 to 36 inches also with variable lengths that can be cut in the field as needed to fit the project site. After the cuttings and tubes have been placed in the subgrade, the tubes can be backfilled with either native soil mixed with water or imported topsoil mixed with water. Over time, the tubes will degrade and will not inhibit growth and expansion of the willow cuttings.
As described in Section 3.1, woody vegetation within the bank-toe zone and main channel can cause significant increase of velocity in the longitudinal direction, as well as significantly increase turbulence intensity that can lead to localized scour. In order to avoid this problem, the active channel margin is set as the lower limit of planting in the hybrid revetment. This means that willow cuttings will not be placed below the active channel water surface limit. The upper limit of the hybrid revetment is the design height, which is design high water plus freeboard. As mentioned in Section 7.1.1.3, willow cuttings will be planted to the upper limit even when the RSP portion of the hybrid revetment ends at the stream top of bank.
In Figure 24, a schematic depiction of active channel margin is shown in cross section and a stream photograph is marked with the active channel margin. CDFW (2002) defines active channel as the ordinary high water level elevation delineating the highest water level maintained for a sufficient period of time to leave evidence on the landscape, such as the point at which cleanly scoured substrate of the stream ends and terrestrial vegetation begins. The active channel height and limit should be located in the field by the civil engineer and plotted on the hybrid revetment typical cross section for reference.
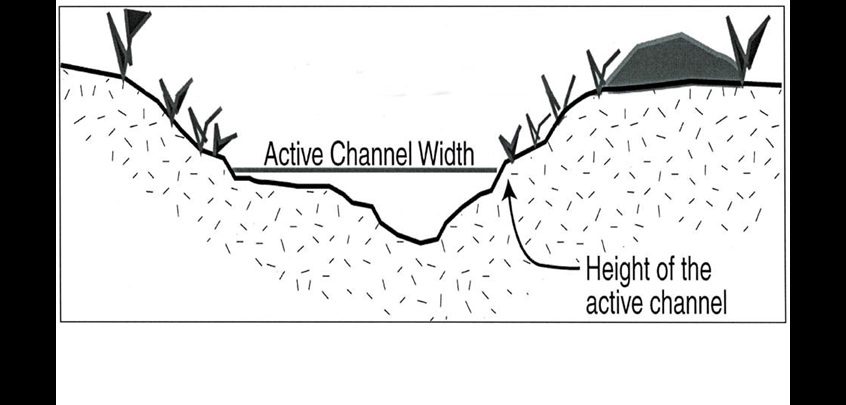

Figure 24 - Active Channel Delineation (adapted from CDFW (2004))
Recognizing that survivability is an issue and excessive planting is often practiced to combat this issue, restraint needs to be practiced to prevent high plant density. By planting in a more controlled manner, the potential can be reduced for stream cross-sectional area reduction that can cause a decrease in stream capacity, increases in sediment deposition, and broadening of floodplain footprint. Also, controlled planting around culvert and bridge openings can preserve their conveyance integrity.
The goal for hybrid revetment design is to have medium woody vegetation density, realizing that the possibility for volunteer vegetation exists and may increase the intended plant density. For woody vegetation, medium density can range from mature trees or shrubs with full foliage where their canopies or outer layers have spacing between them, to mature trees or shrubs where their outer layers touch but are not interwoven. In determining cutting spacing and pattern to meet medium density goal, consideration should also be given to existing vegetation density in the project surroundings.
In the development of the hybrid revetment design, the civil engineer will request the landscape architect to provide the following willow cutting recommendations in a stamped report: longitudinal and lateral spacing in plan-view, pattern in plan-view, orientation with streambank (vertical or perpendicular), diameter range, embedment depths into subgrade for cuttings and tubes, protrusion length of tubes from RSP outer layer, protrusion length of cutting from tubes, and type of soil backfill for tubes and cuttings. Also, this report needs to include special provision(s) for cutting harvesting/installation and tube material/installation requirements, as well as pay item(s) and unit cost for the cuttings and tubes.
It is especially important for the landscape architect and civil engineer to discuss the recommended spacing and patterns of the cuttings and the predicted vegetation density in their mature state, including possible projection and encroachment of willows into the stream main channel that can cause conveyance reduction. From these discussions, the civil engineer can assess roughness values and potential cross-sectional area reduction in the post-construction condition, which will be applied to the hydraulic model. Due to floodplain and flood control liabilities, the civil engineer must approve of the landscape architect's recommendation for cutting and spacing pattern before they are implemented into the hybrid revetment design.
Because the willow cuttings are a part of a revetment with intent to stabilize a streambank, the cuttings will be shown on the civil engineer's typical cross section and drainage plan (see Appendix B for example). In the case where the RSP portion of the revetment ends at the stream top of bank, but planting continues above to the design high water plus freeboard limit, these will also be shown on the civil engineering plans. This practice will be followed for all willow cuttings within the longitudinal and vertical limits of the hybrid revetment determined and set by the civil engineer.
Vegetation may be needed outside the vertical and longitudinal limits of the hybrid revetment for purposes other than streambank stabilization. This type of planting will be shown on the landscape architect plans. It is very common for resource agencies to require plant mitigation in their permits that includes other woody riparian vegetation such as cottonwoods, alders, and sycamores. The mitigation planting can be done outside of the hybrid revetment, but the civil engineer will have responsibility for any planting at or below the 100-year base flood elevations, or 200-year within CVFPB jurisdiction, to ensure floodplain compatibility with local and Federal agency laws. If temporary irrigation for the hybrid revetment and/or the mitigation planting is needed during the plant establishment period, the landscape architect will provide its full design, plans, specifications, and estimate for the project.
8.1 Post-Construction Modeling and Analysis
After the revetment design is completed, a post-construction model will be created to predict and analyze any stream and drainage structure conveyance differences with the pre-construction model, in addition to assessing floodplain impacts. In the post-construction condition, the vegetation in the hybrid revetment is considered to be in a mature state.
8.1.1 Post Construction Manning's n-Values
When determining roughness values for the post-construction model, the effects of the hybrid bank revetment(s) on the main channel n-value must be taken into account. For the portion of the stream that will contain the hybrid revetment, a weighted n-value calculation method is suggested within the main channel. The weighted n-value will be calculated by segregating the main channel into three components: the left bank, the right bank, and the stream bed. The bank(s) that will receive the hybrid revetment will require a new n-value calculation. The stream bed and possibly the other bank (if revetment is only constructed on one bank) will use the main channel n-value determined for pre-construction that may have been refined during the calibration process of the HEC-RAS pre-construction model.
Of the six parameters (n0, n1, etc.) used in determining a main channel n-value discussed previously, the n0 (bed and bank materials), the n1 (degree of irregularity), and the n4 (vegetation density) parameters will be affected by the addition of a hybrid revetment on a bank. The other parameters should be the same from the pre-construction calculation, while the n0, n1, and n4 values will be reevaluated based solely on the altered bank(s) receiving the hybrid revetment. Using the previous three parameters and the reevaluated n0, n1, and n4 values, an effective n-value can be calculated for the isolated bank component.
Example: Post-Construction Effective n-value Calculation for Isolated Bank Containing Hybrid Revetment
Reevaluated n0= 0.028 Left bank will have RSP as surface material associated with hybrid revetment
Reevaluated n1= 0.010 While eroded left bank is repaired with hybrid revetment, the rock and vegetation will still create moderate roughness on the left bank, therefore n1 will be the same for the post-construction condition.
Reevaluated n4= 0.050 Left bank will ultimately contain mature willows with foliage incorporated into RSP. Initial spacing of willows will be done in a manner such that 5 feet between individual willow outer canopy is predicted at maturity.
n2= 0.000 Pre-construction condition
n3= 0.001 Pre-construction condition
m5= 1.15 Pre-construction condition
ne= (n0+n1+n2+n3+n4) m5
ne= (0.028+0.010+0.000+0.001+0.050) 1.15
ne= 0.102 (Isolated Hybrid Revetment Bank)
After an n-value for the hybrid revetment bank(s) has been calculated, the weighted effective n-value for the post-construction main channel within the revetment limits can be determined. The n-value for each component in the main channel will be weighted by its wetted perimeter (Pw) based on the 50-year water surface determined from the pre-construction HEC-RAS model. In MicroStation or AutoCAD, the 50-year water surface can be plotted on a stream cross section or a series of stream cross sections within the hybrid revetment longitudinal station limits, and software tools can be used to measure the wetted perimeter of the left bank component, the stream bed component, and the right bank component. If the 50-year water surface should extend above the main channel top of bank where flow has spilled into the overbank channels, measure the wetted perimeter of the left and right banks from top of bank to bank-toe since the main channel is the area of interest for the weighted n-value computation.
Example: Post-Construction Main Channel Weighted Effective n-value Calculation
Left Bank Component: ne1= 0.102, Pw1= 47 feet Hybrid revetment
Stream Bed Component: ne2= 0.041, Pw2= 38.5 feet During calibration process, pre-construction ne=0.047 was refined and is now ne= 0.041
Right Bank Component: ne3= 0.041, Pw3= 44.5 feet During calibration process, pre-construction ne=0.047 was refined and is now ne= 0.041
nw= (Pw1 ne1 + Pw2 ne2 + Pw3 ne3) Pwt-1
Pw1= left bank wetted perimeter
ne1= left bank effective n-value
Pw2= stream bed wetted perimeter
ne2= stream bed effective n-value
Pw3= right bank wetted perimeter
ne3= right bank effective n-value
Pwt= sum of wetted perimeters
nw= weighted main channel effective n-value
nw= ((47) (0.102) + (38.5) (0.041) + (44.5) (0.041)) (130)-1
nw= 0.063 (Post-Construction Main Channel Within Hybrid Revetment Limits)
As for the main channel outside the hybrid revetment limits, the estimated and possibly refined pre-construction n-value will be used in the post-construction model cross sections.
In many cases, the hybrid revetment will be predominantly contained within the main channel, and it will have negligible effect on the floodplain overbank n-values, especially considering wide floodplains. This means that the pre-construction n-values for the left and right floodplain overbanks can also be used in the post-construction HEC-RAS model. On the contrary, if a floodplain is narrow and its main channel is shallow having small capacity, the 50-year design water surface could be well above the main channel. To meet the design height criteria, this scenario could require extensive planting above the RSP portion of a hybrid revetment into the floodplain overbanks. Planting in a narrow floodplain could cause significant change to the overbank pre-construction n-value(s). In this situation, the overbank pre-construction n-value(s) should be modified accordingly for the post-construction condition within the revetment longitudinal limits.
8.1.2 Post-Construction Hydraulic Model
Once the post-construction roughness values have been determined based on the hybrid revetment design and the predicted mature form, the post-construction HEC-RAS model can be created.
This new model creation can be done simply by starting with the HEC-RAS pre-construction model and updating it with geometry and conveyance characteristics of the hybrid revetment and of course save the model under a new name. The stream cross sections having the new bank revetment can be edited with proper section coordinates to represent the repaired bank(s). After conferring with the landscape architect concerning the possibility of continuous lateral encroachment by the mature willows toward the middle of the main channel, any affected cross sections need to be adjusted in HEC-RAS to appropriately depict change in cross-sectional area (capacity). For instance, if willows are expected to horizontally encroach three feet into the middle of the main channel at medium to high plant density, where the willow outer layers may be consistently touching or even interwoven, the stream bottom width could be reduced by this three feet, which would create a lateral shift in the hybrid revetment bank and simulate capacity loss. By performing this task in HEC-RAS, the possible effects of the hybrid revetment on capacity and conveyance can be more accurately modeled. If it is determined that the willows will not cause any significant change in stream capacity, these steps do not need to be performed.
In addition to geometry changes, the new n-values associated with the hybrid revetment predicted post-construction condition must be edited for the appropriate cross sections. With the addition of the hybrid revetment, main channel roughness values will certainly be affected, but the floodplain overbank roughness values may also require editing.
Because the hybrid revetment will promote some sediment accumulation over its rock portion, the possibility of volunteer undergrowth vegetation (i.e. grass, weeds, brush, and blackberries) definitely exists. Since the volunteer plant root systems may be shallow due to the small depths of sediment, it is likely that these plants will not be very stable and will be washed away during larger storm events. With that said, it may be worthwhile to be conservative and create a “worst-case" HEC-RAS hydraulic model to analyze possible changes in base flood elevations. For a worst-case model, the n-values associated with the hybrid revetment will need to be re-estimated considering a higher plant density. Also, the area (capacity) of affected cross sections may need to be edited and adjusted.
Through the development of a post-construction and possibly a worst-case hydraulic model, potential floodplain and/or drainage structure impacts can be assessed with the addition of a hybrid revetment in the stream.
See Appendix B for sample post-construction and worst-case HEC-RAS models, as well as their comparison to the pre-construction condition.
9.1 Hybrid Revetment Project Development
The following are basic steps to use as a guide in the development of a hybrid revetment design:
Step 1: Gather project site information, such as As-Built plans, historical flood and hydrology records, FEMA Maps and Flood Insurance Studies, stream/rain gage data, GIS data, land-use and soil maps, USGS Quadrangle maps (Images and DEM's), etc.
Step 2: Perform preliminary field investigation of site to determine longitudinal and lateral limits for topographic survey.
Step 3: Request stream topographic survey and DTM including its floodplain if possible.
Step 4: Use WMS, or ArcGIS, or Civil 3D Map, or MicroStation, or AutoCAD, or combinations of these software products, to delineate basins and sub-basins for determining tributary area for hydrologic analysis/modeling.
Step 5: Find appropriate data for hydrologic analysis, such as basin areas, basin slope and length, precipitation, curve numbers, times of concentration, channel routing information, storm type, storm distribution, etc.
Step 6: Choose appropriate hydrologic method(s) and generate peak design flows and/or hydrographs for the following storm events at a minimum: 50-year (2% probability), 100-year (1% probability), and 200-year (0.5% probability) if in CVFPB jurisdiction.
Step 7: Determine initial longitudinal and lateral limits of pre-construction hydraulic model.
Step 8: Create stream horizontal alignment and extract existing stream cross sections in Civil 3D.
Step 9: Perform field investigation to find calibration and boundary condition data for hydraulic model, such as flow-depth, velocity, flow, watermarks, etc. Take photographs of project site to use in estimating n-values for main channel and floodplain overbanks, to use delineating active channel limits, and to use in creating vegetation inventory at project site. Perform rapid assessment in field and assess stream stability according to NPDES permit requirements.
Step 10: Determine initial location and length of hybrid revetment.
Step 11: Refine longitudinal and lateral limits of hydraulic model and extract more stream cross sections from Civil 3D if necessary. Export stream cross-sectional geometry from Civil 3D to HEC-RAS geo file.
Step 12: Estimate pre-construction n-values and determine boundary conditions for HEC-RAS model. Develop HEC-RAS pre-construction model. See Appendix B for example pre-construction model.
Step 13: Using field data, calibrate pre-construction hydraulic model and refine estimated n-values as necessary. Also, refine and finalize revetment length and location.
Step 14: Request streambank (revetment location) soil sampling, sieve analysis, and gradation curve generation from District Material Lab with a minimum of 3 samples taken from the surface to a1-foot minimum depth, or 1 sample per 100 feet of revetment length, whichever is greater.
Step 15: From calibrated (final) pre-construction HEC-RAS model, find maximum 50-year flow-depth, velocity, and water surface width within initial limits of proposed hybrid revetment.
Step 16: Estimate scour depth using appropriate HEC-RAS data or field observations.
Step 17: Calculate RSP outer layer size and class. Determine the need for Backing and inner RSP layers. Find total thickness of RSP layer(s).
Step 18: Determine RSP design height with consideration of freeboard and refine RSP length if necessary.
Step 19: Perform criteria checks using base soil and universal gravel filter information. If criteria check fails, determine new gradation of gravel filter. Determine gravel layer thickness.
Step 20: Determine subgrade limits.
Step 21: Delineate active channel limits in cross-section and plan views.
Step 22: Meet with landscape architect and request the following information concerning the live cuttings for the hybrid revetment: longitudinal and lateral spacing in plan-view, planting pattern in plan-view, orientation type (perpendicular or vertical), plant embedment length, tube embedment length, plant protrusion length from RSP outer layer, tube protrusion length from RSP outer layer, cutting diameter, and soil backfill in tubes.
Step 23: Determine live cutting total length and tube total length considering RSP and gravel filter combined thickness, cutting orientation, and other information from landscape architect.
Step 24: Confer with landscape architect regarding predicted mature vegetation density, possible encroachment of mature vegetation into main channel causing cross-sectional area reduction, possible planting (type and density) above 50-year water surface plus freeboard elevation to satisfy permit requirements, and temporary irrigation for plant establishment period.
Step 25: Estimate post-construction n-values with consideration of the RSP and vegetation components of the hybrid revetment and any additional planting.
Step 26: Modify stream geometry for cross sections containing the hybrid revetment as necessary, and modify n-values for these cross sections in development of a post-construction HEC-RAS model. See Appendix B for example post-construction HEC-RAS model
Step 27 (Optional): Estimate worst-case n-values for the hybrid revetment and develop a worst-case HEC-RAS model. See Appendix B for worst-case HEC-RAS model example.
Step 28: Compare pre-construction hydraulic conditions with post-construction and possibly worst-case conditions. Perform floodplain assessment.
Step 29: Prepare Location Hydraulic Study. If significant floodplain encroachments are found, perform activities for FEMA Conditional Letter of Map Revision (CLOMR). Coordinate with local agency per HDM Index 804.9.
Step 30: Prepare hybrid revetment plans. See Appendix C for example.
Step 31: Request special provision for live cuttings and tubes, as well as their pay item(s), quantities, and costs from the landscape architect.
Step 32: Using Civil 3D, prepare subgrade staking notes for surveys and construction.
Step 33: Prepare finished grade design cross sections of hybrid revetment for construction. See Appendix C for example.
Step 34 (If needed): After construction completion and As-Built creation, perform activities for FEMA Letter of Map Revision (LOMR) in construction with the affected local agency.
10.1 Construction Order of Work
The following simple order of work should be placed on the Typical Cross Section plan sheet so that it is easy for the contractor's field personnel and Caltrans' inspectors to reference during construction. In addition to the benefit of specific direction that can simplify construction and inspection, this order of work can provide more uniform and consistent bids for the hybrid revetment between potential contractors.
Hybrid Revetment Order of Work:
- Perform excavation to subgrade limits
- Plant live willow cuttings and place tubes into subgrade at proper embedment depth, excavating into subgrade as needed for individual cuttings and tubes.
- Fill tubes with native or imported soil and water mixture
- Place gravel filter over subgrade.
- Place RSP layer(s) at proper thickness over gravel filter.
- Place and compact native backfill over RSP
11.1 References
Admiraal, D.M., (2007), “Streambank Stabilization Using Traditional and Bioengineering Methods: A Literature Review," University of Nebraska-Lincoln, The Nebraska Department of Roads.
Bathurst, J.C., Thorne, C.R., and Hey, R.D., (1979), “Secondary Flow and Shear Stress in Bends," Journal of The Hydraulics Division, American Society of Civil Engineers (ASCE).
California Department of Fish & Wildlife (CDFW), (2002), Culvert Criteria for Fish Passage.
CDFW, (2004), Salmonid Habitat Restoration Manual (Part IX Fish Passage Evaluation at Stream Crossings), Volume 2, 4th Edition.
Chaudry, M.H., (1993), Open-Channel Flow, Prentice Hall, Inc., Englewood Cliffs, NJ.
Chow, V.T., (1959), Open-Channel Hydraulics, McGraw-Hill Book Co., Inc., Boston, MA.
Cowan, W.I., (1956), “Estimating Hydraulic Roughness Coefficients," Agricultural Engineering.
Czarnomski, N., (2010), “Influence of Vegetation Density and Projected Area on Streambank Hydraulics," Water Resources Engineering Program, Oregon State University.
Das, B. M., (1985), Principles of Geotechnical Engineering, PWS-KENT Publishing Company, Boston, MA.
Federal Highway Administration (FHWA), (2009), HEC-23 Bridge Scour and Stream Instability Countermeasures: Experience, Selection, and Design Guidance, Third Edition.
Fischenich, C., (2001), “Stability Thresholds for Stream Restoration Materials," EMRRP Technical Notes Collection (ERDC TN-EMRRP-SR-29), U.S. Army Engineer Research and Development Center, Vicksburg, MS.
Kondolf, G.M., Piegay, H. (editors), (reprint 2004), Tools In Fluvial Geomorphology, John Wiley & Sons Ltd., West Sussex, England.
Lane, E.W., (1955), “The Importance of Fluvial Geomorphology in Hydraulic Engineering," Proc. ASCE, Paper 745.
Leopold, L.B., Wolman, M.G., Miller, J.P., (reprint 1992), Fluvial Processes in Geomorphology, Dover Publications, Inc., New York, NY.
Maynord, S., (1996), “Toe-Scour Estimation in Stabilized Bendways," Journal of Hydraulic Engineering, Volume 122.
National Highway Institute (NHI), (2004), FESWMS-2DH/SMS Training.
National Resource Conservation Service (NRCS), (2008), “Vegetative Streambank Stabilization," Practice Standards and Specifications.
Pilarczyk, K.W., (2000), “Design of Revetments," Dutch Public Works Department, Hydraulic Engineering Division.
Simon, A. Collison, A.J.C., (2002), “Quantifying the Mechanical and Hydrologic Effects of Riparian Vegetation on Streambank Stability," Earth Surface Processes and Landforms.
State of California, Dept. of Consumer Affairs, (2013), Professional Engineers Act.
U.S. Army Corps of Engineers (USACOE), Hydrologic Engineering Center, (2010), HEC-RAS v4.1 Hydraulic Reference Manual.
U.S. Geological Survey (USGS), (reprint1989), “Guide for Selecting Manning's Roughness Coefficients for Natural Channels and Floodplains," Water-Supply Paper 2339.
Zipparo, V.J., Hasen, H., (editors), (reprint 1993), Davis' Handbook of Applied Hydraulics, McGraw-Hill, Inc., United States.