Making Strides Toward Saving Lives
Safe System Approach Seeks to Eliminate Fatalities, Serious Injuries on Roadways

At Caltrans, safety is paramount. The department has developed various approaches to design, build, and operate roadways with an emphasis on safety. Yet transportation professionals and policy makers continue to grapple with increases in road traffic fatalities, injuries, and crashes in California and throughout the world.
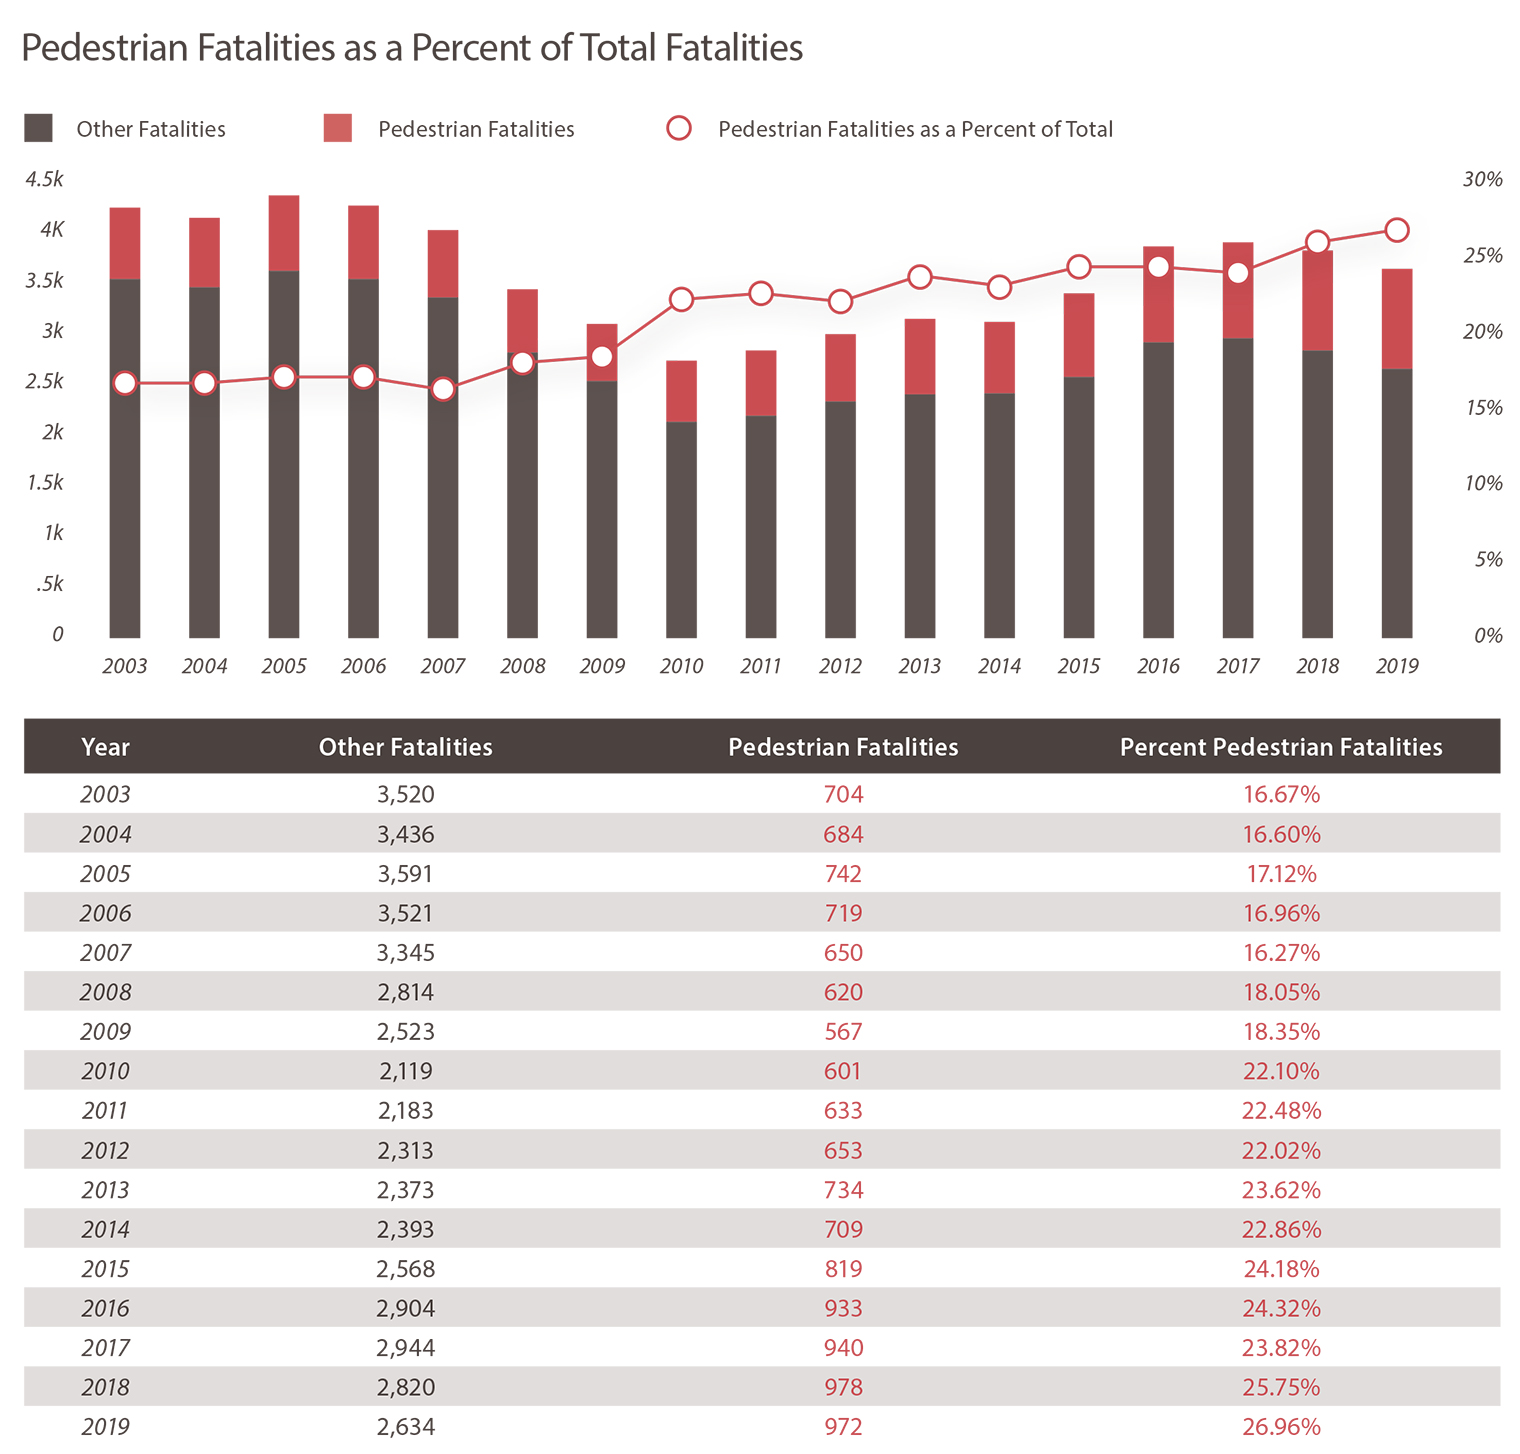
In California, fatality and serious injury numbers have continued to rise during the last decade. Based on the most recent figures available, 3,606 lives were lost (2019), with 16,158 persons (2018) seriously injured on California’s roadways.
Those annual statistics represent one-year totals, but are not anomalies. On average, 10 people are killed in road traffic crashes each day in this state, of which more than two are our most vulnerable users: people who bike and walk.
This tragic toll isn’t unique to California. In 2019, an average of more than 100 people lost their lives on U.S. roads each day. According to the Federal Highway Administration (FHWA), the number of pedestrians struck and killed in vehicle crashes in the past decade increased by more than 50 percent nationally.
Figure 1: Statewide Integrated Traffic Records System

Further, people in communities of color are 50 percent more likely to become a fatality while walking or bicycling compared with all Americans, according to the Centers for Disease Control and Prevention.
The pedestrian percentage of total fatalities is on the rise, far outpacing the percentage of those who walk as their mode of transportation — an increasingly disproportionate safety impact for pedestrians in California. For example, in 2012, pedestrian trips made 16 percent of total trips, yet pedestrian fatalities represent nearly 25 percent of total fatalities, according to the CA Household Travel Survey.
Figure 2: Safety is an Equity Concern (Source: 2015 Safe Routes to School National Partnership)

Continuing Caltrans’ commitment to protect the end users of the transportation system, the Department is adopting the Safe System approach to the design, building, maintenance and management of the transportation infrastructure of the State Highway System. Caltrans has formally committed to a Safe System approach by including it as part of the 2020-24 Strategic Highway Safety Plan and Caltrans 2020-24 Strategic Plan (story in this issue), and the Division of Safety Programs is following up by drafting a Director’s Policy aimed at affirming this safety strategy.
The Safe System approach aims to eliminate fatal and serious injuries for all road users by creating a forgiving transportation system and keeping impacts on the human body at tolerable levels. The Safe System approach is defined by six principles.
- Reduce death and serious injury to zero
- Humans make mistakes
- Humans are vulnerable
- Responsibility is shared
- Redundancy is crucial
- Safety is proactive and reactive
Making a commitment toward zero traffic deaths involves addressing all aspects of safety through the following five Safe System elements that, together, create an approach with layers of protection for road users: safe road users, safe vehicles, safe speeds, safe roads, and post-crash care.
In the U.S., the FHWA has released new safety policies and recommendations in support of Safe System. FHWA views California as a pilot state for the Safe System approach and Caltrans is positioning itself to be a national leader with a dedicated office devoted to traffic and pedestrian safety, and the adoption of programs that strengthen safeguards for all who depend on the State Transportation System.
Case Study #1: Pedestrian Safety
One example of how Caltrans is moving toward the Safe System approach is its 2019 Pedestrian Systemic Safety Monitoring Program. This program incorporates a predictive (or systemic) approach into its modeling and analysis that showcases how proactive tools can be used to identify and mitigate risk in the transportation system to protect pedestrians. The foundation of the monitoring program is built on a systemic safety model developed by the Safe Transportation Research and Education Center at the University of California, Berkeley. It identifies locations with crash risk based on their contextual characteristics that match high crash locations, not crash history, and variables that include children, seniors and equity concerns.
Case Study #2: Developing a Safe System Approach to Setting Speed Limits
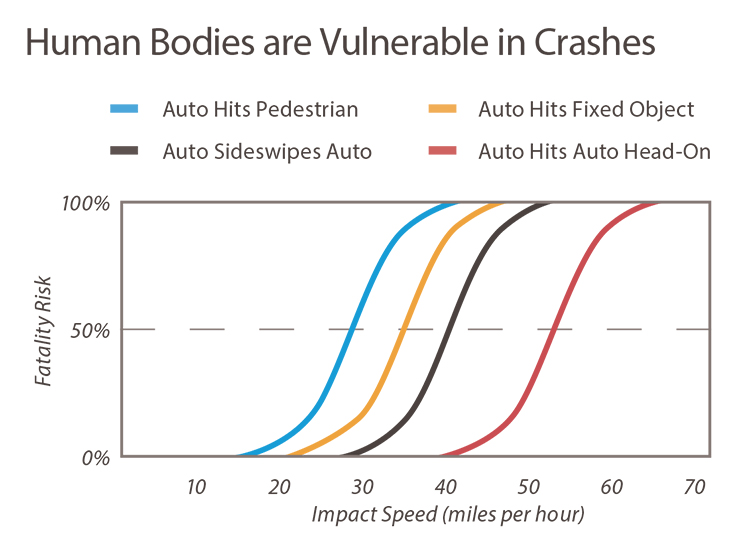
Another example of Safe System Approach implementation is a new Caltrans research effort centered around speed management based on the principle that humans are vulnerable.
Figure 3: Human bodies are vulnerable in crashes (Source: Roads and Traffic Authority of New South Wales)

People have a limited ability to tolerate crash impacts before death and serious injuries occur — a central tenet of the Safe System approach. The management of kinetic energy transfer to within survivable limits is fundamental to understanding how to design and operate the road system consistently within the Safe System philosophy. The Safe System approach focuses not just on vehicle speed, but on managing transfer of kinetic energy. Just a small increase in vehicle speed dramatically increases deaths and serious injuries.
Safe System is an integrated transportation approach designed to include all users of the system, stakeholders and industry. It’s a vital step as Caltrans moves toward designing, building and managing a 21st century transportation system.
Sources: Rachel Carpenter, Chief Safety Officer; Caltrans Division of Safety Programs, U.S. Department of Transportation, Office of Safety.

