Caltrans Key Strategic Management Plan Performance Measures
Goal: Safety and Health
Provide a safe transportation system for workers and users, and promote health through active transportation and reduced pollution in communities.
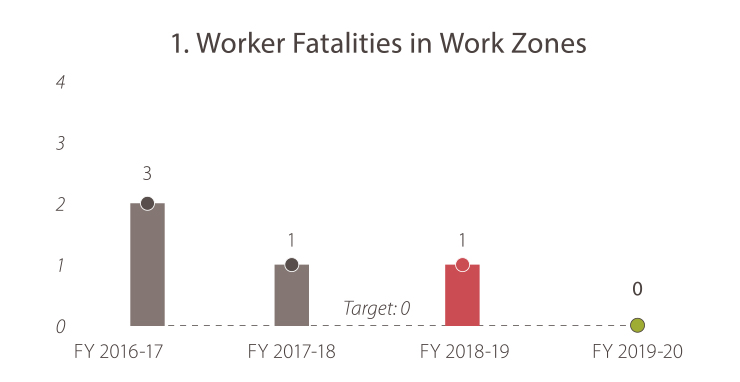
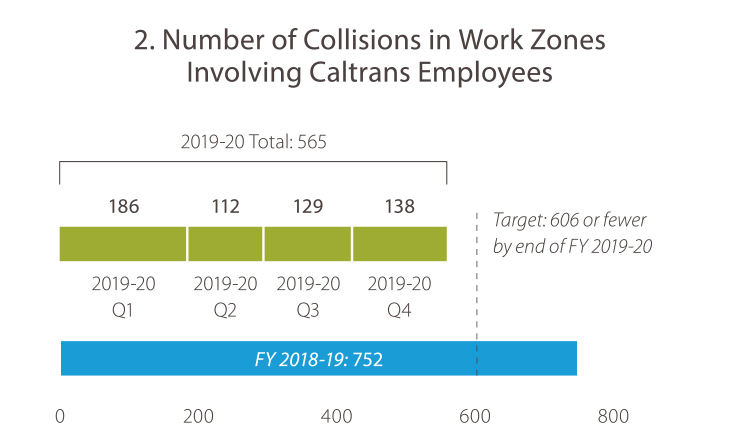
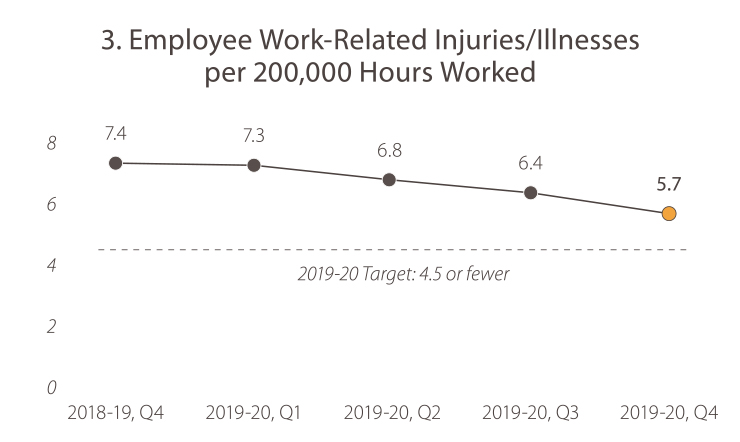
Measures the number of Caltrans employees killed in the line of duty on the State Highway System.Measures the number of motor vehicle incidents involving Caltrans employees working on the State Highway System. These can occur in Caltrans vehicles, rental vehicles or personal vehicles being driven for work. Incidents may involve the traveling public, other Caltrans employees or stationary objects such as other Caltrans vehicles, cones and barriers.Calculated using the formula (number of injuries and illnesses X 200,000) / total employee hours worked). Represents the number of injuries per 100 full-time employees over a given 12-month period. Factors that contribute to decreasing numbers would be fewer overall injuries or more total hours worked without an increase in injuries.
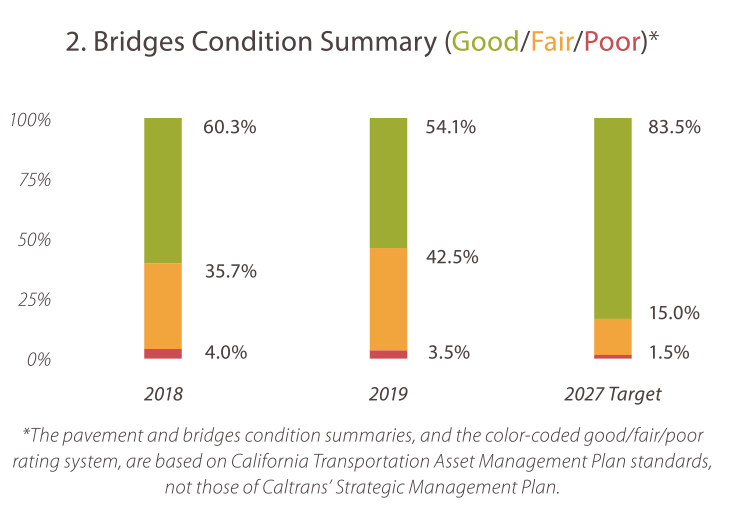
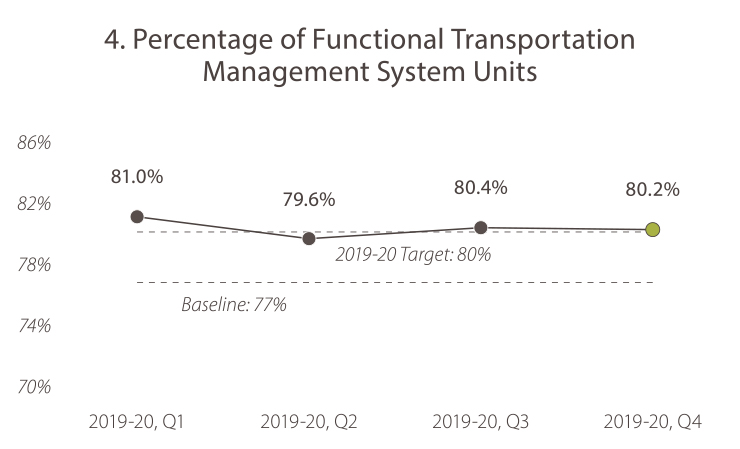
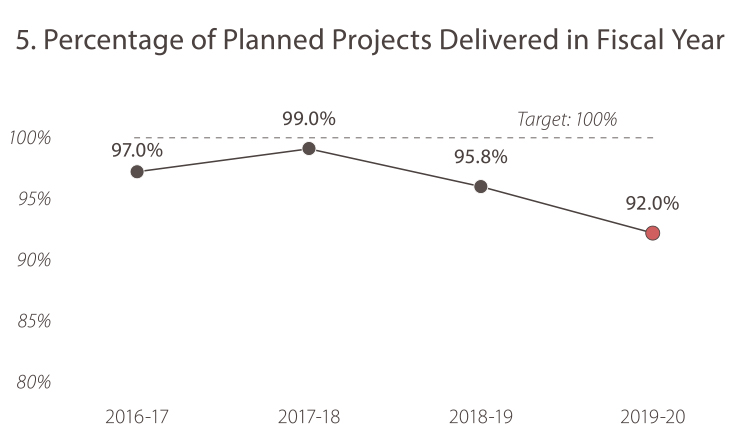
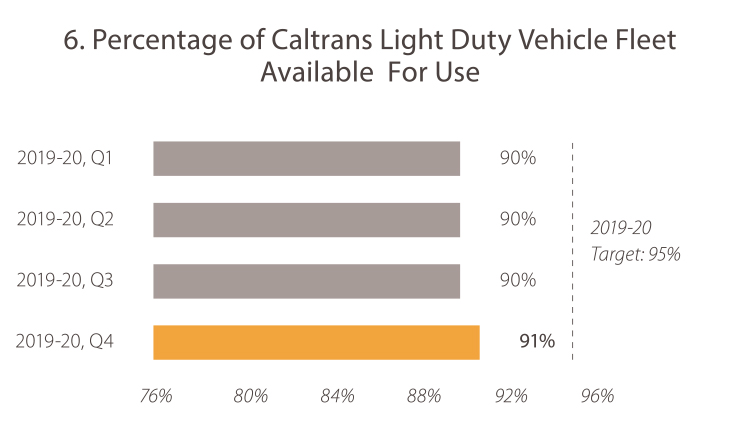
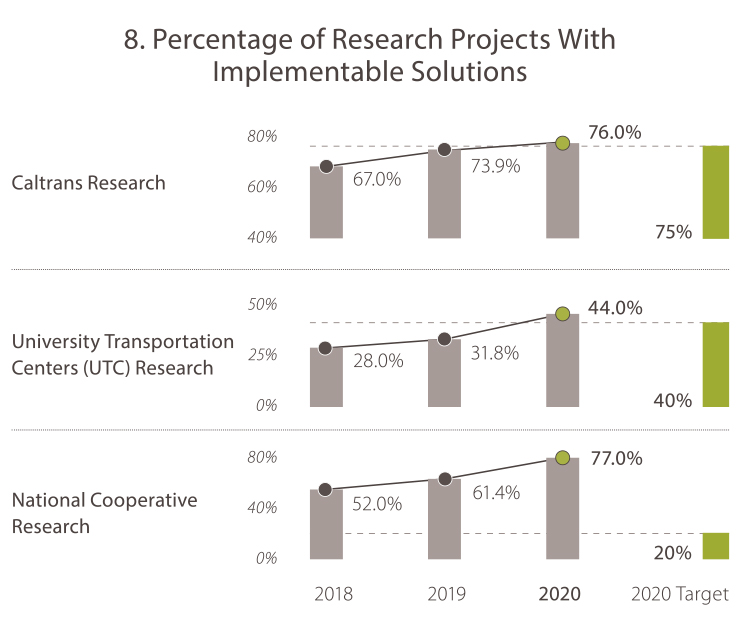
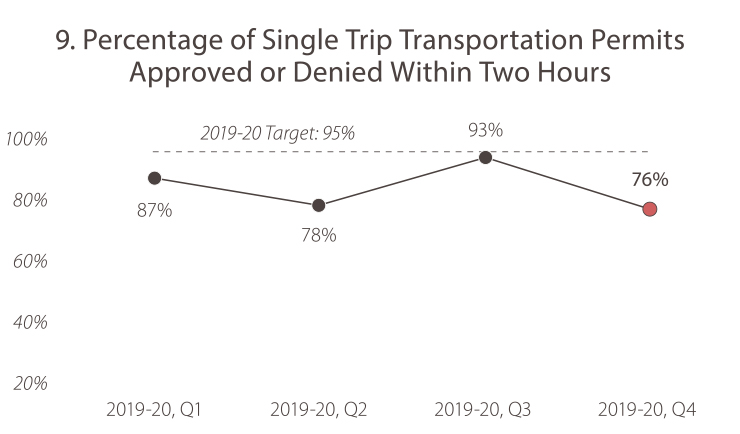
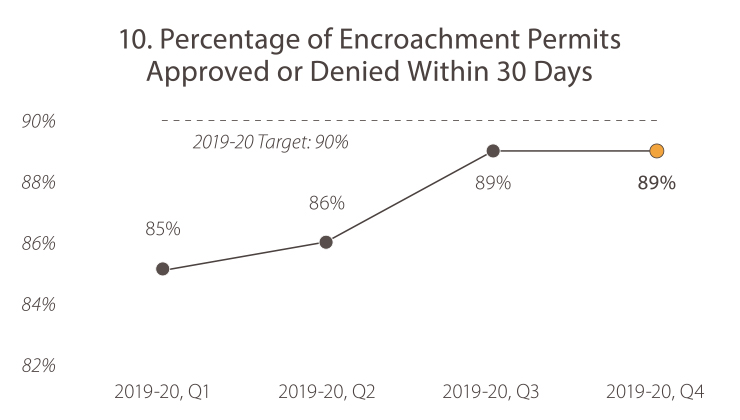
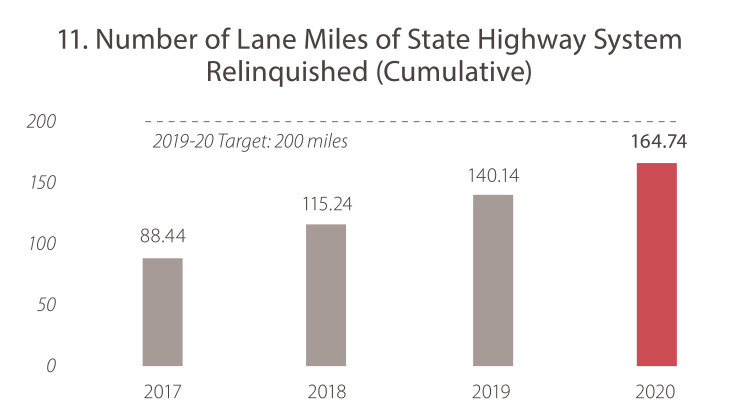
The most recent data shows that Caltrans is trending toward meeting its pavement performance targets. Pavement condition is determined on an annual basis. The percentage of State Highway System pavement that meets federal, SB 1, and Caltrans criteria improved in 2019 when compared with 2018. This trend is projected to continue, aided by continuing SB 1 revenues for road projects, and SHS pavement condition is on track to reach 2027 performance goals.Because of the complex nature of major bridge projects, the time frame for delivery averages about nine years. The first few years of performance measurements show minimal progress until the increase in the completion of bridge projects. Many projects have been expedited, and additional projects were added to the project stream to utilize the additional funding from sources such as SB 1. Caltrans’ Bridge Program continues to work closely with regional districts to assure all bridges identified as being in poor or fair condition are being addressed. Of the estimated 212,181 culverts statewide, more than 172,200 culverts had been inspected by end of FY 2019-20 (81 percent). Of the total number of culverts inspected, more than 153,400 are in good and fair category (90 percent of the total inspected). Maintenance crews are working diligently statewide to complete the statewide inventory and inspections by the end of FY 2023. It is expected that with the number of culverts being repaired currently, and those that will be fixed in the coming years, Caltrans will successfully meet and maintain the 90 percent good/fair target of the total inventory as part of its strategic goal.Caltrans’ Transportation Management Systems consists of about 20,000 electric and electronic units that work together to control highway operations, provide traveler information and collect data on highway usage. The percentage of functioning TMS units has hit 80 percent in the last two quarters, exceeding a 77 percent baseline target. The overall target is to bring Caltrans’ TMS to a 90 percent good condition in terms of functionality and expected life cycle by 2027.For FY 2019-20, there were several factors that impacted delivery. The COVID-19 pandemic disrupted the delivery process while staff shifted into a telework model. COVID-19 also caused partner agencies to close in some instances, making it impossible to move forward. Also, Caltrans has made a conscious decision to take more risks and plan to deliver a higher number of projects with higher levels of intelligent risks.The closing quarter of FY 2019-20 showed a 91 percent fleet availability performance mark, a slight improvement from the previous quarter. In this quarter, priorities have been on preparing vehicles/equipment for winter operations. This includes repairs and preventive maintenance on 1,539 pieces of equipment critical to keep California’s highways open. Over the past four quarters, Caltrans fleet has remained at 89 percent to 92 percent availability.Caltrans Research: Implementable research projects have been improving for the past three years due to increased emphasis on partnerships with internal Caltrans customers and its research partners. UTC Research: UTCs consist of internationally recognized centers of excellence with expert researchers dedicated to addressing transportation challenges. Focused cooperation has led to continually improved research scopes that have yielded more implementable solutions over the last three years. National Cooperative Research: The National Cooperative Highway Research Program is a national program under the Transportation Research Board. Caltrans subject matter experts continue to engage at the national level on dozens of panels, and pooled fund studies are used to help solve common transportation problems and develop innovative solutions. Single-trip transportation permits are issued for a single trip from a particular origin location to a destination location. These trips are generally not repeated. The drop in the percentage of single-trip permit processing can be attributed to COVID-19, with the restriction in number of employees who could come to work.Encroachment permits are issued to allow other public agencies or private entities to encroach on state highway right-of-way to perform their work. Caltrans maintained the pace of encroachment permit issuance in the quarter despite COVID-19 because the work required could be done remotely without the need for employees to come to the office.The goal of relinquishing lanes miles of the State Highway System to local agencies is to allow the appropriate government agency to manage important transportation facilities. The initial goal was to relinquish 50 lane miles by 2020, which was increased several times as each target was met, ending with a final goal of 200 lane miles. The districts worked with local partners to identify candidate routes and successfully relinquished 155.12 lanes miles during the final quarter of 2019-20.
Goal: System Performance
Utilize leadership, collaboration and strategic partnerships to develop an integrated transportation system that provides reliable and accessible mobility for travelers.
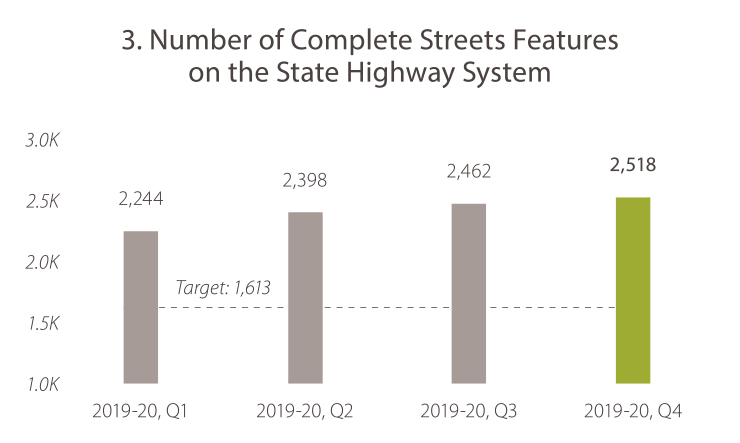
This measure tracks the consistency of updates to closures status logged in Caltrans’ Lane Closure System (LCS). There are many data elements that contribute to traveler information, and these are presented to users through Caltrans QuickMap and the Commercial Wholesale Web Portal. The LCS manager is working with the underperforming districts to update their information to maintain an accurate report of closure status.This measure tracks the availability of the latest information on Caltrans’ QuickMap. The refresh rates on the GPS-enabled app vary from map layer to map layer, but all are less than 10 minutes.Caltrans is dedicated to Complete Streets projects that remake selected state highway sections to be safer and more friendly to pedestrians, cyclists and communities. In fiscal year 2019-20, Caltrans recorded 2,518 Complete Streets features, a 16 percent increase from FY 2018-19’s total and far exceeding a target of 1,613 project features set for FY 2019-20.
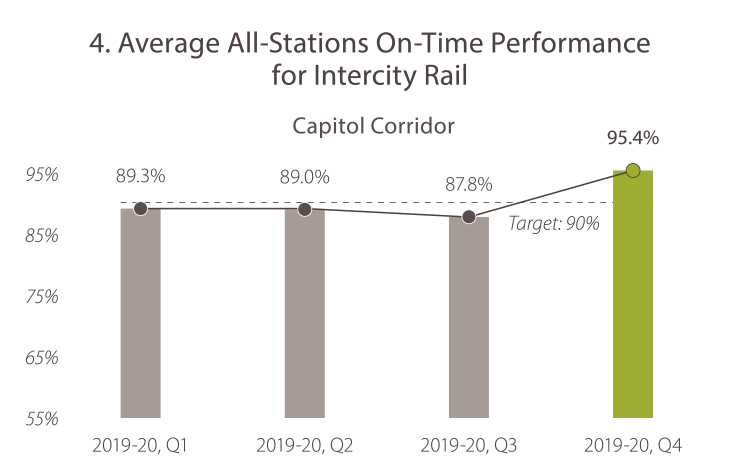
(a) Performance improved since the last quarter as a result of the Capitol Corridor Joint Powers Authority making corridor enhancements such as security fencing using minor capital and maintenance funding as well as decreased traffic due to the COVID-19 pandemic.
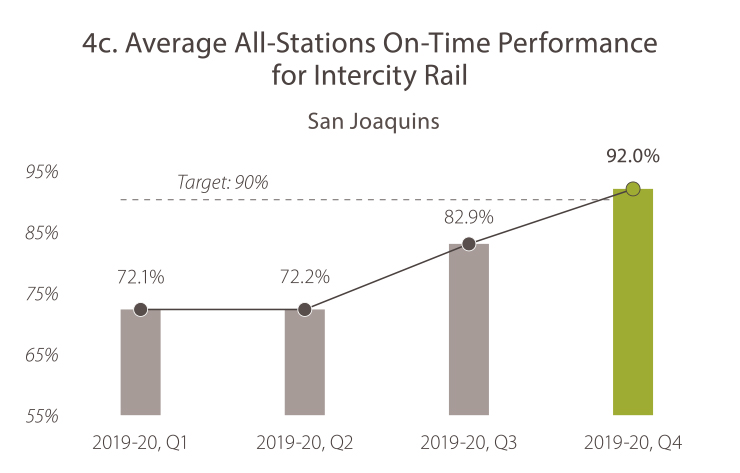
(b) Performance improved since the last quarter as a result of the San Joaquin Joint Powers Authority continuing to work with Amtrak and host railroads to identify and address frequent delay sources, as well as decreased traffic due to the COVID-19 pandemic.
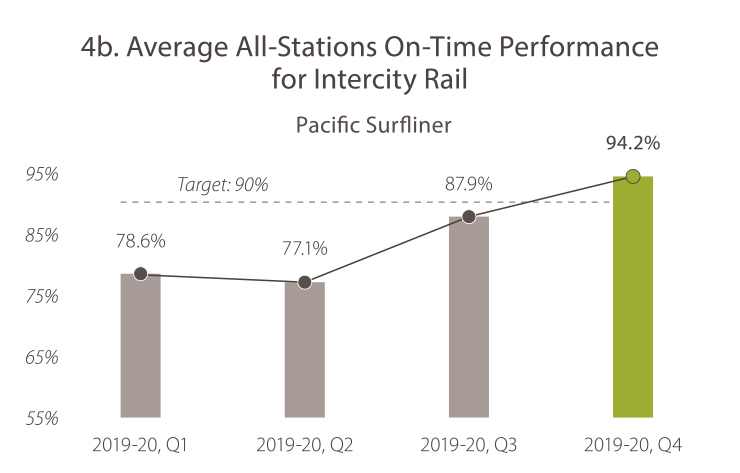
(c) Performance improved since the last quarter as a result of the Los Angeles–San Diego–San Luis Obispo Rail Corridor Agency continuing to work with Amtrak and host railroads to identify and address frequent delay sources, as well as decreased traffic due to the COVID-19 pandemic.
Goal: Organizational Excellence
Be a national leader in delivering quality service through excellent employee performance, public communication and accountability.
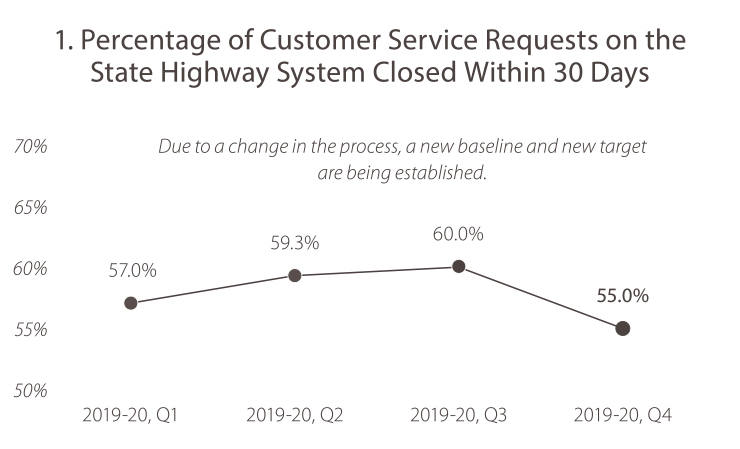
The percentage of Customer Service Requests that were closed within a 30-day period for calendar year quarter one (January-March) was 60 percent. For the second quarter (April-June) that number dropped slightly to 55 percent as Caltrans developed new directives as a result of COVID-19 safety protocols.Since 2015, the Lean 6-Sigma Program has performed over 60 process improvement projects through the Caltrans Green Belt Certification Program to meet its yearly goal of 15 projects per year. However, due to COVID-19, the certification program has gone virtual and only nine projects could be performed. The downward trend should be temporary with the adoption of a new framework emphasizing virtual learning and teamwork.