
Highway System Gets Good Marks on Report Card
Caltrans' Annual Inspections Show Bridge and Striping Improvements, Among Other Positives
From March through August, Caltrans’ Division of Maintenance performs a thorough inspection of the State Highway System (SHS). The test results from 2019 show that key components of the SHS are getting healthier.
Under the Level of Service (LOS) program, Caltrans inspection teams drive and sometimes walk along random one-mile segments of the SHS. In most of the Department’s 12 regional districts, approximately 20 percent of the total centerline miles of state highway are evaluated. The highest LOS score that any segment can receive, for any of the 35 evaluated criteria, is 100.
The purpose of the program is to help Caltrans’ Maintenance division establish its priorities for the fiscal year — where and how best to allocate available resources. The division’s 2016 Strategic Management Plan (SMP) identifies 10 high-priority “maintenance activities” on those mile-long segments that each receive an LOS score and determine where best to focus repair efforts. The management plan sets statewide LOS score goals of 70 to 90 for each activity. Those goals are to be achieved by 2021.
The top 10 priority activities listed in the report are pavement, bridge maintenance, guardrail repair, striping maintenance, sign maintenance, traffic signals maintenance, roadway lighting maintenance, tree/brush encroachment prevention, litter/debris removal and graffiti removal.
Revenues generated by the Road Repair and Accountability Act of 2017, or Senate Bill 1 (SB 1), has allowed the Maintenance division to tackle problems or deficiencies that have been cited in previous LOS reports.
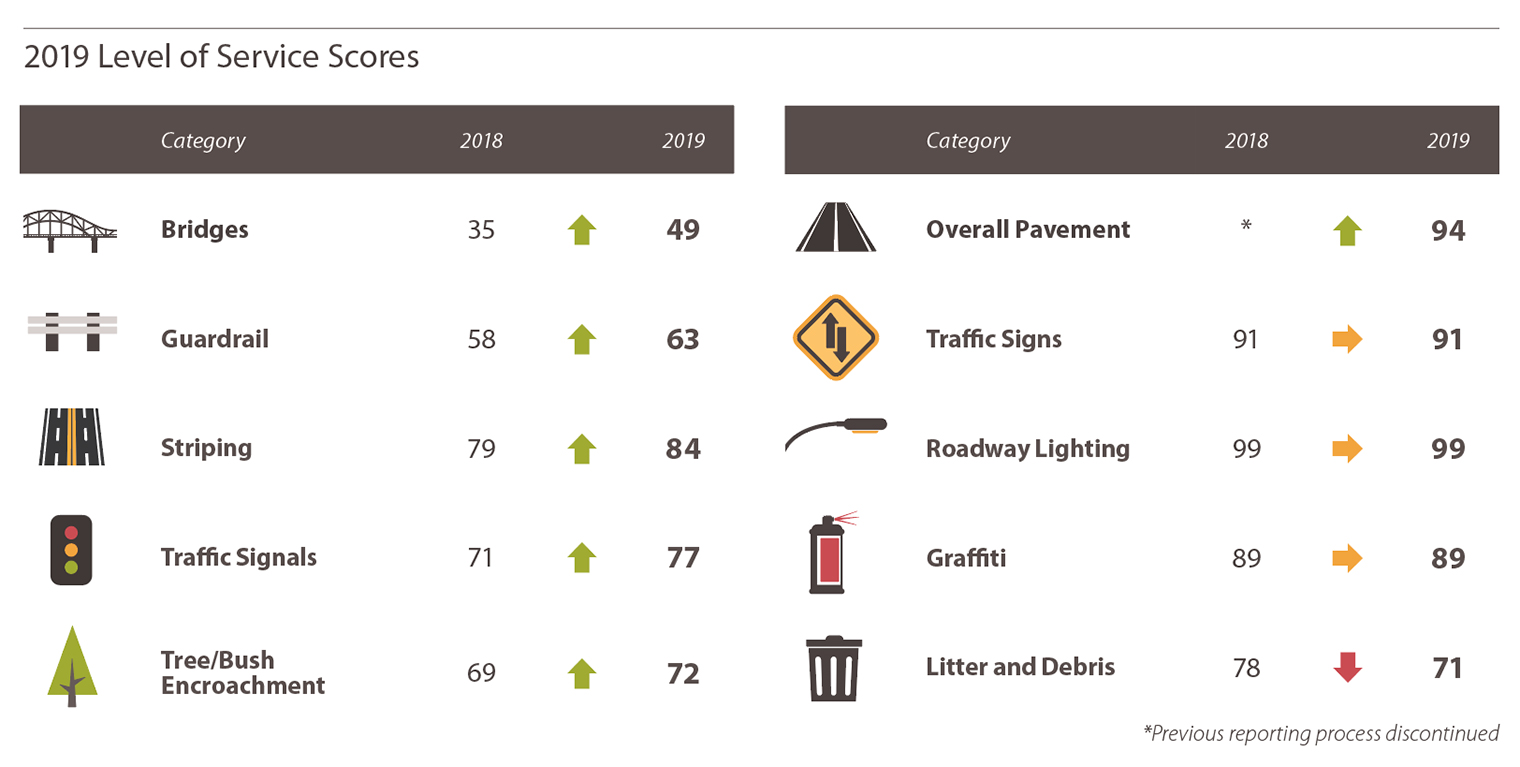
Of nine high-priority categories identified in Maintenance division’s strategic plan, five attained higher LOS scores in 2019 than the previous year. The condition of bridges statewide improved the most, jumping 14 points to an overall score of 49. Other areas showing improvements were guardrails (63, five points higher than 2018’s score), striping (84, up four points); traffic signals (77, six points higher); and tree/brush encroachment, (72, up three points).
Overall pavement condition earned a 94 LOS score in 2019. To measure pavement, Caltrans uses a specialized van outfitted with laser-scanning technology that more precisely finds and maps road flaws than the previous visual inspection process. The Automated Pavement Condition Survey analyzes 100 percent of State Highway System lanes each year, and offers a far more complete, and accurate, look at pavement conditions around the state.
The 2019 pavement rating exceeded the performance target set of 90 (based on a score of 100) by SB 1, based on the amount of pavement cracking, spalls (deteriorated sections of concrete) and potholes along roadway segments.
Traffic signs overall rated a 91 LOS score, the same as 2018. That exceeds the SMP goal of 90 by the year 2021. The signs in four of the districts — 1 (based in Eureka), 2 (Redding), 5 (San Luis Obispo) and 11 (San Diego) — were rated at 98 or 99.
The LOS score for roadway lighting, 99, also was the same as it was in 2018. That nearly perfect result far exceeds the 2021 SMP goal of 70.
The LOS score for graffiti, 89, also was unchanged from the previous year.
Litter, Debris Issues Remain a Challenge
Meanwhile, the litter/debris category continues to be a problem. The 2019 statewide LOS score was 71, seven points lower than in 2018. It was the only high-priority activity that scored lower on the LOS survey than it did the year before.
Caltrans’ LOS inspection teams evaluated about 20 percent of all state highways in every district other than District 12. There, 40 percent of roadways were evaluated due to the Orange County district’s relatively small highway inventory.
Other parts of the SHS that fall outside the top 10 categories also were scrutinized. The teams also inspected all rest areas (81 statewide), vista points (113) and park-and-ride (239) sites. In every district, inspection teams evaluated landscaping alongside dozens of the one-mile roadway segments — 448 landscape segments statewide.
Ten to 20 percent of the segments evaluated by LOS teams were subsequently, and randomly, re-inspected by three quality assurance teams assigned to the southern, central and northern parts of the state. Those follow-up teams consisted of two retired Caltrans managers on special assignment. If there was a significant difference between the original and follow-up scores, the involved teams met and worked out the discrepancies.
Armed with the fresh roadway-health data collected by the LOS program, the Maintenance division used a software program to prioritize spending for the upcoming 2020-2021 fiscal year. The Budget Allocation Tool breaks down Maintenance spending not by 12 Caltrans regional districts, but by 29 “budget zones” determined by “like” challenges such as average daily traffic levels and climate so appropriate comparisons can be made. For example, budget zone “LoMt-1” takes in all of District 1 (North Coast), with relatively light traffic counts in a low-mountain climate. Districts 4 (San Francisco Bay Area) and 7 (Los Angeles area), meanwhile, are each divided into four budget zones according to climactic and traffic conditions.
Source: Manuel Morales, Caltrans LOS Statewide Coordinator, Division of Maintenance.