
Connecting the (Data) Dots
Caltrans and the State Have Built a Tower of Information. GIS Makes It Accessible.
With help and contributions from Caltrans, the state of California has created a vast data storehouse detailing its services, facilities and geographic information available at the click of a mouse to the public.
The California State Geoportal debuted last December. The site uses the latest Geographic Information Systems (GIS) technology to gather millions of points of data generated by state government and organize it into map-based or 3D visual representations.
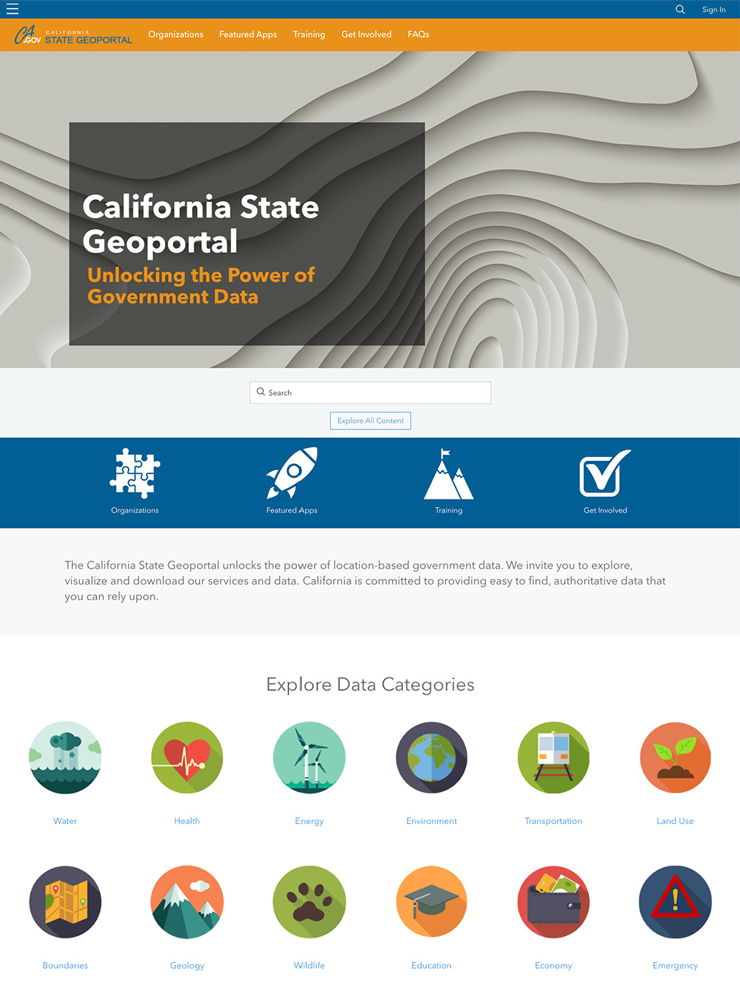
Visitors to the site can get big picture views of location-based information grouped by category, or drill down to find more granular detail about state services or operations. There are 12 general data categories presented on the site, including water, health, energy, environment, education, emergency, and transportation, with data supplied by state departments or agencies overseeing those functions.
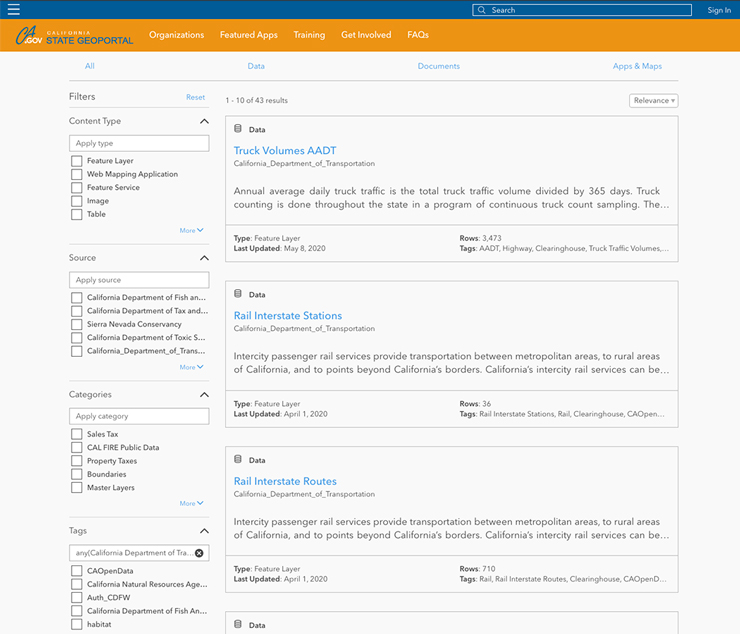
Caltrans, through its Division of Research, Innovation and System Information (DRISI), posts 42 datasets about the State Highway System that each contain layered map levels of information. Site visitors can choose overlays embedded with the particular data points of information they are seeking about the highway system, its location and its functions.
For example, a family that plans to travel along U.S. 395 through the state can call up the dataset showing the number of rest stops along the route (five), listed on a graphic table, and a map displaying the services of each (vending, dog walk, RV facilities, etc.). Or, since the route travels the dramatic east side of the Sierra Nevada, they can find out how many vista points there are (10), and exact locations.
The Caltrans-supplied transportation component of the state geoportal doesn’t just serve vacationers. Emergency responders can get quick access to datasets giving specifics about Caltrans and local bridges, public airports, heliports or Caltrans’ postmile system to pinpoint locations of incidents on the highway system. Trucking firms whose business depends on knowing state highway restrictions and conditions can pull up information on allowable weight loads for specific routes, locations of freight intermodal points for transfers, or the status of inspection facilities.
Commuters visiting the state site can view where traffic bottlenecks are, average daily traffic counts, locations of park-and-ride locations, or, tiring of the daily drive, look up train and bus facilities.
Caltrans continually refreshes and verifies its existing information on the state geoportal, and is working on new categories of collected transportation data to introduce. The Department also collects and posts GIS-based data on its website that’s readily available to the public, featuring 57 map datasets separated into highway, railroad, airport and boundary categories.
Caltrans Embraced GIS Use Early
The state geoportal is the leading edge of the data revolution that Caltrans and other state agencies have been rolling out for public viewing and reference.
As steward of the State Highway System, Caltrans was one of the early users of geospatial technology, which refers to the acquisition, manipulation, and storage of geographic information. GIS is one form of geospatial technology, the computer rendering of location-based data into digital map layers that can be viewed, organized, analyzed and integrated through geographic software programs.
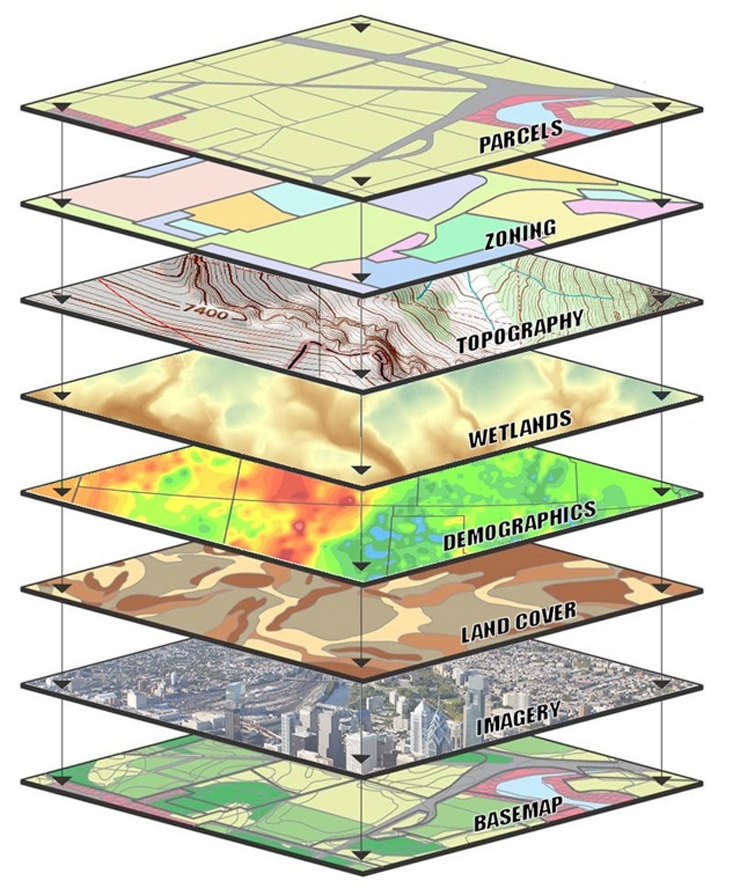
The use of GIS at Caltrans began in the early 1990s, when the Department first began collaborating with GIS pioneer and industry leader Esri (Environmental Systems Research Institute), based in Redlands. With leaps forward in technology — more powerful computers, internet capability, and sophisticated geographic software programs — GIS became an indispensable tool that allowed Caltrans planners and engineers to plot project details in a digital realm.
Not only could data be visualized through GIS mapping, but layered in a “sandwich” fashion, enabling project managers to evaluate information and spot patterns, relationships and potential problems that may have previously gone undetected.
Today, almost every division involved in highway system maintenance, project planning and delivery, traffic operations, and asset inventory and management relies on GIS technology. Each of Caltrans’ 12 regional districts has a GIS coordinator, and most maintain separate branches that serve as local data repositories and supply expertise for offices that use GIS mapping. Caltrans sets GIS policies and manages statewide data operations from its Sacramento headquarters.
Opening Up Data Access
GIS usage has been an integral part of Caltrans operations for years, but much of the data generated was kept internally and not easily shared.
But the ability to present complex sets of geographic data via two-dimensional and 3-D Web-based interfaces has opened up new ways to communicate with the public about state government, and Caltrans, operations.
The state geoportal, with Caltrans’ contributions, is one example of this transparency. But Caltrans and CalSTA websites offer other road-related information conveyed through GIS mapping. Some examples:
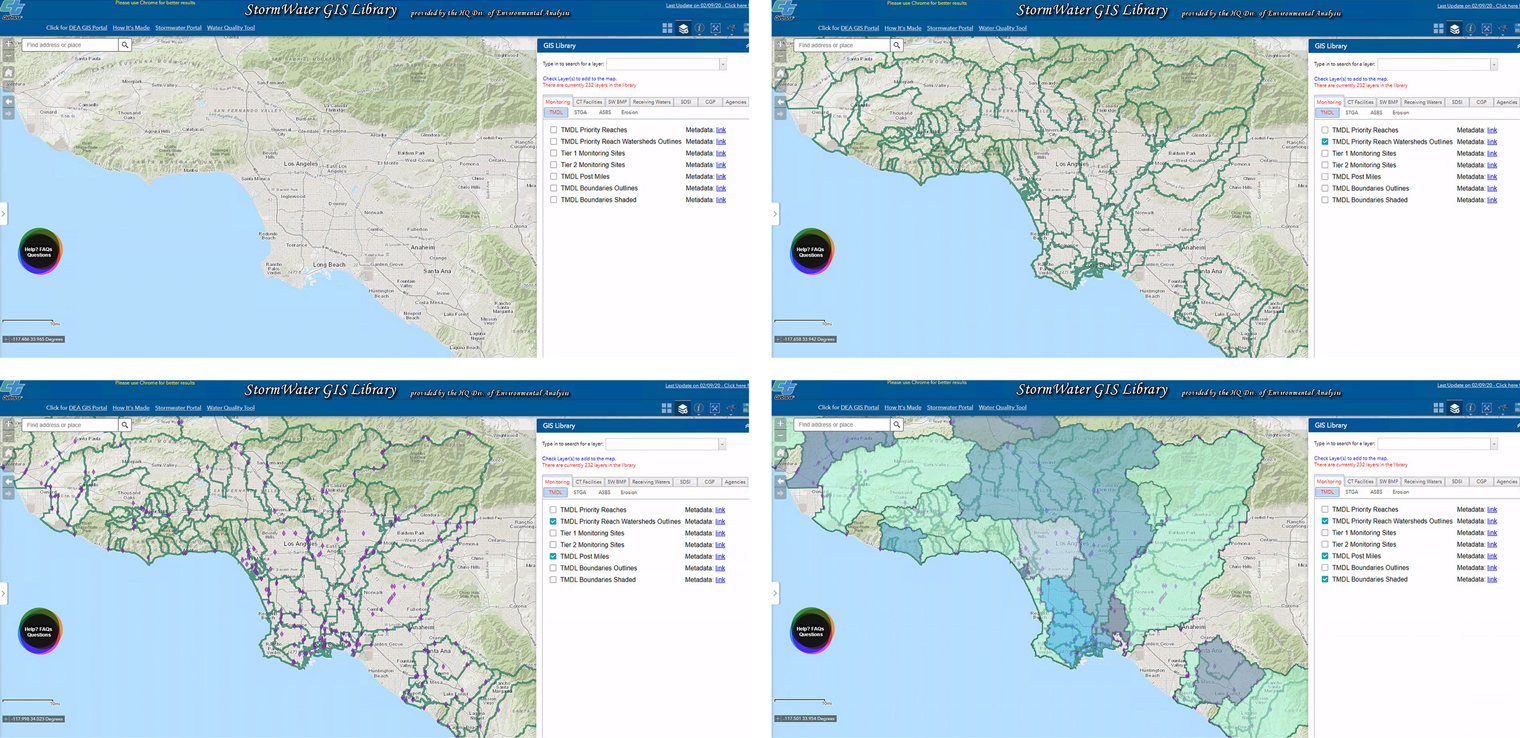
QuickMap — Perhaps the best known, and used, GIS-enabled service on Caltrans’ website is QuickMap, which displays real-time traffic information to help travelers make smart decisions before they take to the road. QuickMap uses a Google Maps application infused with information supplied by Caltrans, Waze and other sources. QuickMap averages 104,000 visitors a month – more than double the number in 2018 -- and the mobile application has been downloaded more than 397,000 times to Android and iOS devices.
SB 1 — Several Caltrans districts offer updates on projects within their boundaries that receive funding from the Road Repair and Accountability Act of 2017, known as SB 1. CalSTA hosts the Rebuilding California site that features a layered GIS map of SB 1 projects around the state allowing visitors to view selected locations, stages and type of work, among other details.
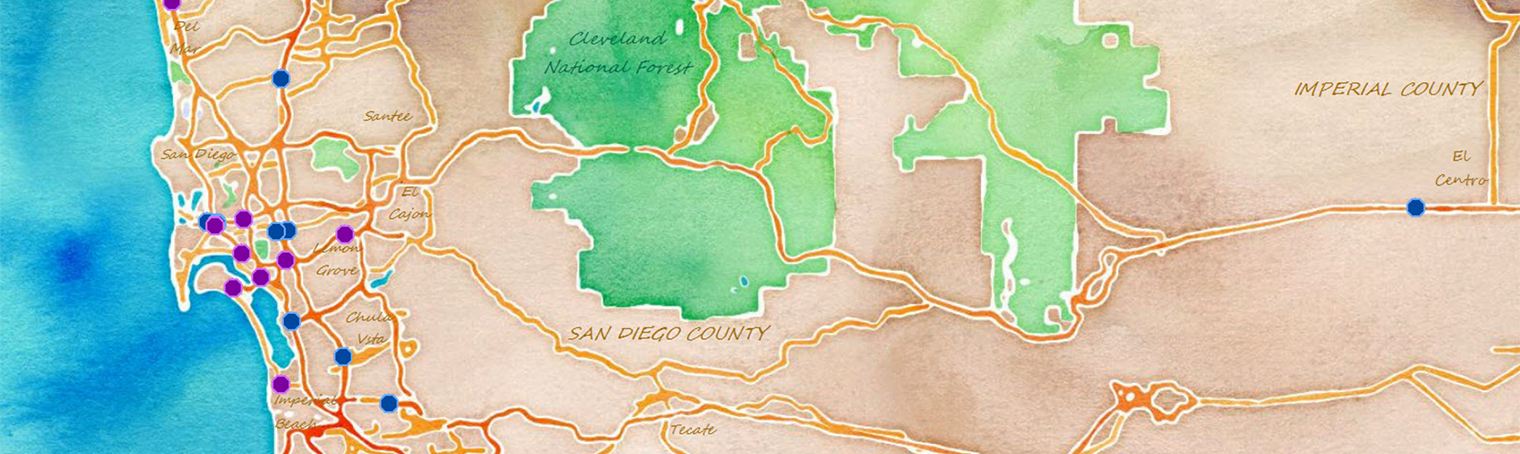
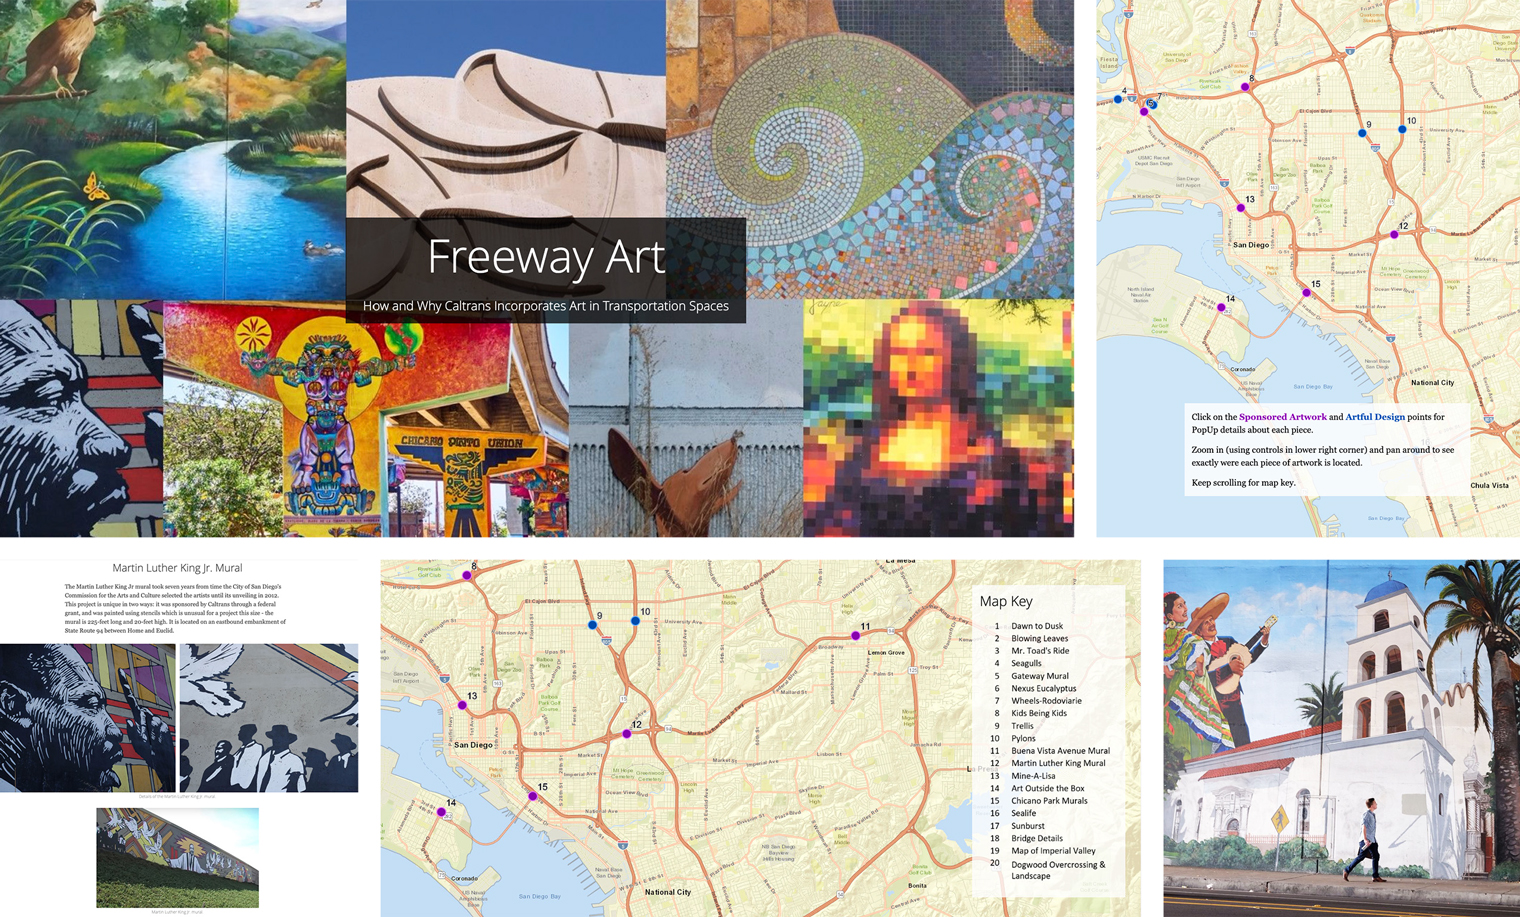
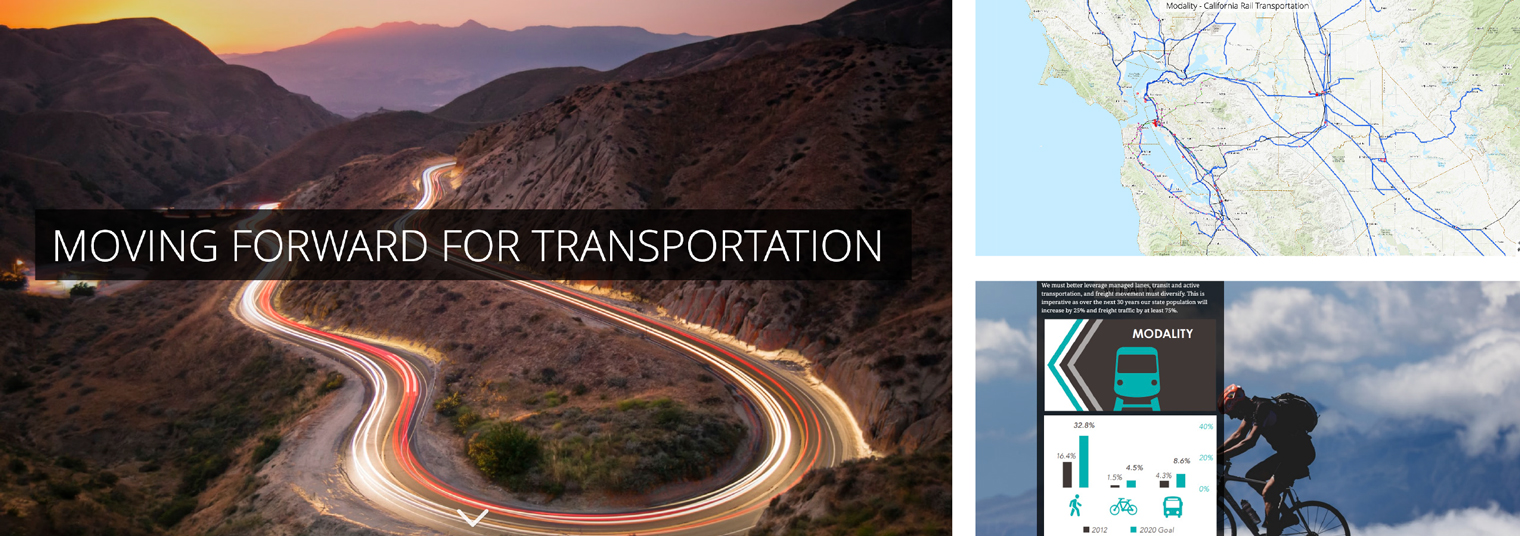
StoryMap — Caltrans districts are beginning to utilize this new GIS-based form of storytelling that merges layered maps, photos and text into themed presentations. Using Esri’s ArcGIS software program, Caltrans GIS specialists in District 11 (San Diego area) and Bishop-based District 9 created web pages that tell vivid stories about transportation attributes in their region. D11 assembled a pictoral StoryMap display to describe how local artists transformed nondescript highway underpasses, walls and ramp sides into vibrant expressions of art around the San Diego area. The east side of the Sierra Nevada serves as the stunning backdrop for a D9 StoryMap guide to the district’s best bicycling routes, from the Mojave Desert to Yosemite National Park.
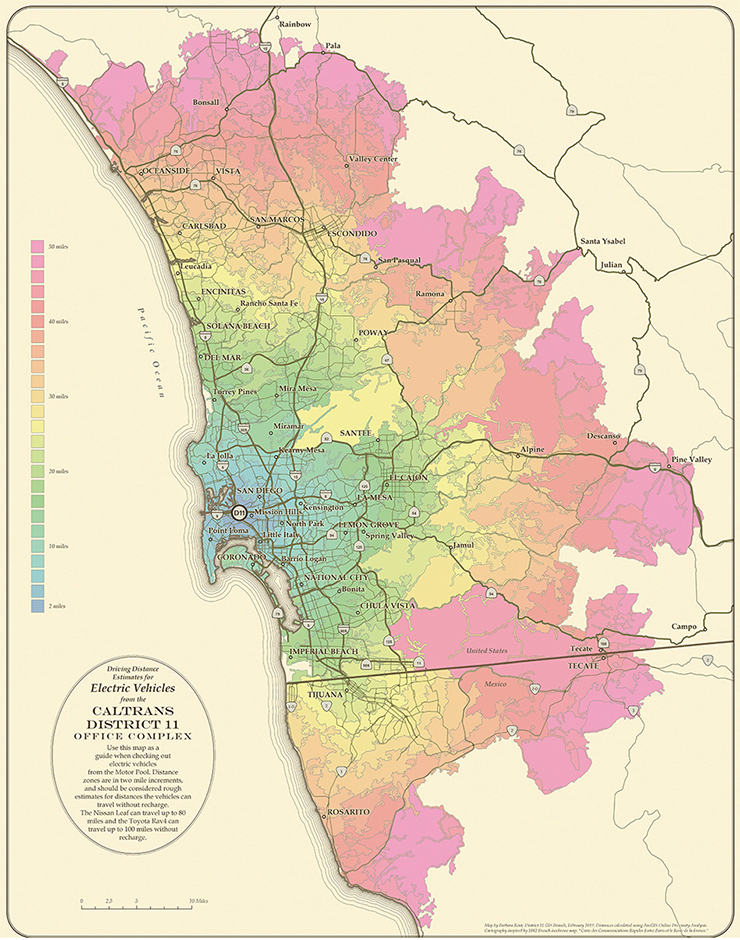
District outreach — District 4, representing the nine-county San Francisco Bay Area, and D11 in Southern California spotlight transportation options or services on their public-facing webpages. The San Diego district site shows the locations and features of park-and-ride and bicycle facilities, a driving distance estimator, culverts and the Freeway Art StoryMap, among other services. In Northern California, Oakland-based D4 produced a GIS-enabled map of bike routes and facilities that’s part of its area bicycle plan, as well as a self-help online version of their public map counter that provides various right of way-related maps grouped by decade.
Outreach to partners — All 12 Caltrans districts have been active in sharing GIS-enabled data of the regional transportation network with transportation partners. For example, District 5, representing the Central Coast area, has built a catalogue of GIS data detailing its active transportation (mostly bike, pedestrian and scooter) projects and facilities that partners can use and reference. The information also serves to point out gaps in the region’s non-motorized travel network.
GIS also played a role in Caltrans’ disaster response following the deadly 2018 Camp Fire in Paradise. Surveyors from Marysville-based District 3, whose territory includes the Paradise-Chico area, used GIS mapping to count the number of trees killed within highway right of way, and estimate the amount of hydroseeding needed to rejuvenate burned areas.
Caltrans’ GIS staff also have produced maps that were singled out for national recognition. GIS-enabled maps created in D11 and D3 have been chosen for inclusion in the prestigious Esri annual map book that features the year’s most innovative or creative work in digital geographic mapping, and serve as a resource for other map designers around the world.
Caltrans’ Data-Driven Future
The data visualization field has grown by leaps and bounds in recent years, transforming the way people consume and use information in their lives. Caltrans is committed to using GIS as a way to increase public knowledge about the operations and condition of the state travel network, and sharing data with its transportation partners to make the system safer and more reliable through this century and beyond.
Sources: April Nitsos, Chief; Chad Baker, Geospatial Data Officer; Walter Yu, Enterprise Data Manager, Caltrans Office of Data Services and Technology, Division of Research, Innovation and System Information; California State Geoportal.