
Paving the Way to a Better Travel System
Highway Rehabilitation Is Meeting Most SB 1, Caltrans Performance Targets

Caltrans continues to hit most of its performance marks set for improving the State Highway System with the help of funds raised through the Road Repair and Accountability Act of 2017 (Senate Bill 1).
The most recent progress report presented to the California Transportation Commission showed that rehabilitation of the system is mostly on track, based on two sets of standards used to evaluate the pace of repairs for core highway components. Performance benchmarks for pavement, bridges and tunnels, culverts, and the transportation management system (TMS), the electronic heart of the highway network, were established in 2017 after passage of the landmark SB 1 transportation funding law.
Based on the progress made through April 2020, Caltrans appears on pace to reach or exceed most of the SB 1 targets based on a 10-year window. By 2027, Caltrans says it should bring 98 percent of its pavement statewide up to good or fair condition, reach a 90 percent Level of Service rating for pavement flaws, fix an additional 500 bridges beyond pre-SB 1 levels, and improve its culvert/drainages to a 90 percent good/fair condition.
Only the Department’s TMS — its vast, interconnected grid of signals, signs and sensors — is listed as uncertain at this time to reach a 90 percent good condition status by 2027, despite recent improvements.
In addition to the SB 1 targets, Caltrans uses its 2018 Transportation Asset Management Plan (TAMP) to assess the condition of the highway system each year. The plan took inventory of the highway system’s many physical components, rated the condition to establish a baseline, and set objectives to preserve and improve those assets.
The TAMP evaluates the same major highway categories as SB 1, but uses more precise metrics for pavement and bridges. The plan also analyzes the condition of seven supplementary classes of highway assets.
Using TAMP standards, Caltrans bridge and tunnel network is in danger of missing 2027 performance targets unless corrective steps are taken. Caltrans’ TMS is also on the TAMP watchlist regarding its assigned performance goal.
Here are the 2019-20 Performance Benchmark Report’s major findings, by highway asset category.


Pavement
SB 1: Caltrans is required to have 98 percent of its pavement statewide up to good or fair condition by 2027. For Class I pavement, consisting of interstate highways and other major arterials, urban freeways and expressways, Caltrans has already exceeded the 2027 standard with a 98.8 percent good/fair rating by the end of 2019. Only 1.2 percent of Class I pavement was rated as poor.
There are 27,151 lane-miles of Class I highways in the state, Caltrans’ largest pavement category representing more than half of 50,259 lane miles in the SHS.
For Class II and III pavement, the good/fair percentages are 99.2 percent and 99.1 percent, respectively. Class II pavement, mostly on non-interstate routes, makes up 16,400 lane miles, or about one-third of the SHS. State routes in Class III category lie in mostly rural, remote sections of the state.
In the pavement subcategory that tracks the maintenance of potholes, cracks and spalls (corroded areas of concrete), Caltrans recorded a 94 score, exceeding the 90 percent Level of Service mark required by SB 1. Caltrans now uses a laser-scanning system to evaluate pavement conditions as part of SB 1 and TAMP performance standards, replacing a previous method that relied on limited visual inspections.
TAMP: The good/fair/poor categories for pavement classes are considered separately under TAMP. Under the stricter TAMP standard, the 1.2 percent of Class I roads rated as poor exceeds the 1 percent target, but is tracking in the right direction to meet the 2027 target date. Class II and III roads, with only .9 and 1 percent rated in poor shape, respectively, in the most recent survey, are well under the 2 percent target set by TAMP.

Bridges and Tunnels

SB 1: The law calls for Caltrans to fix an additional 500 bridges total beyond the established baseline of 1,140 over a 10-year period (114 bridges per year on average pre-SB 1). Based on current projections, Caltrans expects to meet the 1,640 total bridge fix mark by fiscal year 2024-25, and projects it will make defined improvements to 1,915 bridges by the 2027 target date.
TAMP: Although Caltrans is making progress, and expects to continue to, in the repair/rehabilitation of its bridge/tunnel system, the improvements are not coming quickly enough for TAMP standards. The percentage of bridges/tunnels rated in good condition dropped 6.2 percent, to 54.1 percent, from the end of 2018 to the same period a year later. The 2027 target calls for Caltrans to bring 83.5 percent of bridges to good condition.
The number of bridges found to be in fair condition in the most recent survey rose 6.8 percent, to 42.5 percent. Bridges determined to be in poor condition made up 3.5 percent of Caltrans’ inventory, a .5 percent drop from the previous year.
Bridges present unique circumstances and challenges. Because of long planning, permit, and construction windows — an average of nine years for a bridge delivery project — improvements aren’t realized or recorded quickly. While Caltrans expects steady improvement as a whole in the bridge/tunnels category through 2027, many projects initiated recently or in the next few years will likely not be counted as improvements for SB 1 purposes. Nonetheless, steady improvement in overall bridge conditions through 2027 is forecast in Caltrans’ modeling.
Caltrans already is working to shorten bridge project timelines, by quickening the pace of project development, scheduling, and inspections.
Culverts
SB 1: The highway drainage system is another area in which Caltrans has made good progress rehabilitating. About 75 percent of Caltrans’ 212,181 culverts had been assessed by April 2020. Completion of the statewide inspections is expected by 2023.
To this point, 72.2 percent of the Caltrans culvert system, measured in linear feet, was rated in good condition, a 3 percent rise in one year. Drainages rated as fair showed a corresponding 3 percent drop, to 18 percent, while there was no change in the poor condition category at 9.8 percent – but this mark is already below the 10 percent performance measure threshold.
It’s expected that Caltrans will continue to use additional maintenance crews to clean out clogged culverts and repair ones in poor condition to improve on the 90 percent good or fair condition benchmark by 2027.
TAMP: The Caltrans plan uses the same performance measures for culverts as SB 1.
TMS
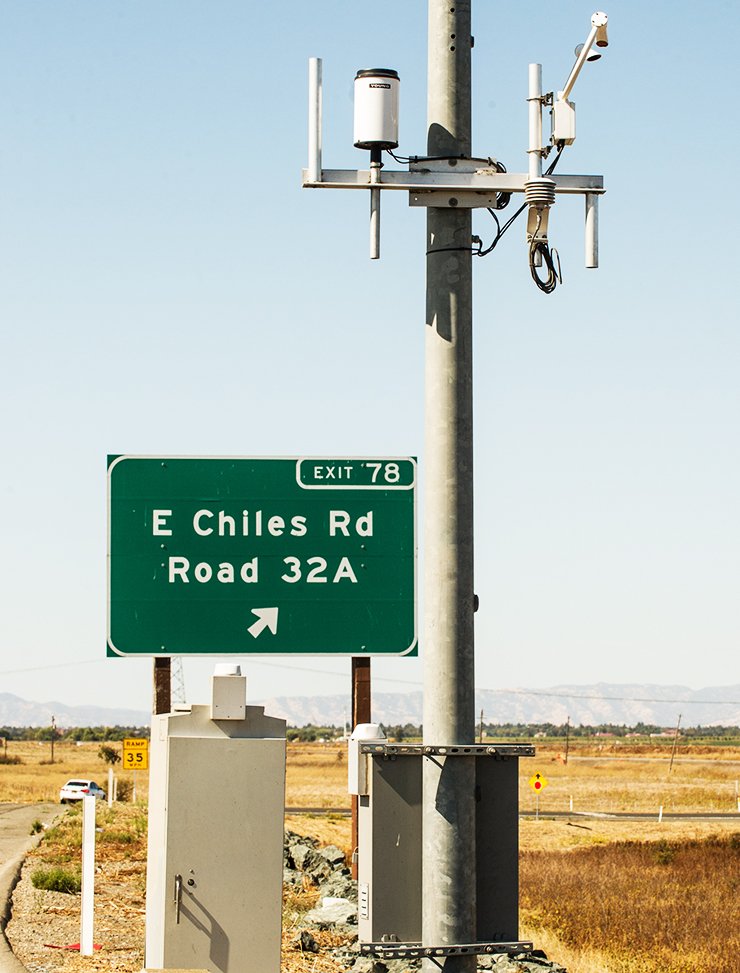
SB 1: The electrical/electronic system that controls highway operations posted a 7.2 percent jump in functionality and expected life cycle from the previous year, with 74.6 percent of the components rated in good condition as of April 2020. That trend should continue, the progress report said, but TMS improvements could fall just short of the SB 1-required 2027 benchmark. However, Caltrans projections show that the percentage of TMS components rated in good condition is already exceeding CTC-adopted expectations at this point, and could well hit improvement targets at the end of the 10-year cycle.
Caltrans’ TMS consists of about 20,000 units that work together to reduce highway delay, provide traveler information and collect data on highway behavior. TMS components are only classified in good condition — working — or poor, having failed or exceeded an assigned life cycle.
TAMP: The Caltrans plan uses the same performance measures for TMS as SB 1.Sources: Caltrans Office of Asset Management; 2019/20 Performance Benchmark Report