
SB 1: Progress Made, Challenges Remain
Pavement Shows Most Improvement of Four Major Highway Categories
The Road Repair and Accountability Act of 2017 (Senate Bill 1) has passed a major timeline milestone, one-fifth of the way through a promised 10-year transformation of California’s transportation network.
A recent progress report presented to the California Transportation Commission shows that Caltrans, to this point, is meeting or making significant strides on key SB 1 performance targets set for pavement, bridges, drainages, and its signals, signs and sensors system.
But challenges remain in the pace of improvements to the bridges that Caltrans maintains, although solid progress has been made to that critical part of the State Highway System (SHS).
Caltrans analyzed the condition of its major highway components as part of an annual progress report required by the CTC. In addition to the SB 1 targets, the report measured Caltrans’ performance in the same categories established in its 2018 Transportation Asset Management Plan (TAMP) that counted and assessed the condition of the highway system’s many physical components, and set objectives to preserve and improve those assets.
The progress report noted that Caltrans was on track, at current and projected rates of repair and rehabilitation, to meet SB 1 performance standards for pavement overall, bridges, and culverts by the end of the 10-year reporting period. The interconnected grid of electrical devices and hardware known as TMS (transportation management system) was placed on monitor status, meaning it’s still uncertain whether the pace of improvements will be enough to achieve 2027 goals. That same rating was accorded for a separate SB 1 category, pavement maintenance based on the number of potholes, cracks and concrete corrosion found on state routes.
SB 1, which became law in 2017, requires that Caltrans upgrade 98 percent of all three classes of state highway pavement to good or fair condition by 2027. The Department also must achieve a 90 percent rating based on Level of Service (LOS) standard for pavement deficiencies.
Caltrans now uses a laser-scanning system to evaluate pavement conditions as part of SB 1 and TAMP performance standards, replacing a previous method that relied on limited visual inspections. The new automated survey has already produced greater accuracy in grading road conditions than the old method of dispatching field crews for inspections. (See accompanying story below).
SB 1 also requires that Caltrans fix 500 bridges over and above a previous annual average number of repair projects, bring its culvert system to a 90 percent or better good or fair rating, and ensure that at least 90 percent of the TMS network is in good condition.
Caltrans’ TAMP rates the same highway categories, but uses more precise performance metrics for pavement and bridges.
Based on the TAMP scale, all three classifications of highway pavement are on track to reach or exceed 2027 “good” condition goals. Caltrans’ culvert system was likewise improving at projected rates. The TMS system, as it was under the SB 1 reporting, was placed under a monitor status because of the possibility of falling short of long-term goals.
Under TAMP assessment standards, however, the overall condition of Caltrans bridges and tunnels lagged behind other parts of the SHS showing improvement. The early bridge and tunnel showing earned an “action required” warning, and Caltrans has intervened by taking corrective steps to quicken the pace of planned improvements (see below).
An updated SB 1 performance report was presented to the commission at its June meeting, past the Mile Marker’s deadline.
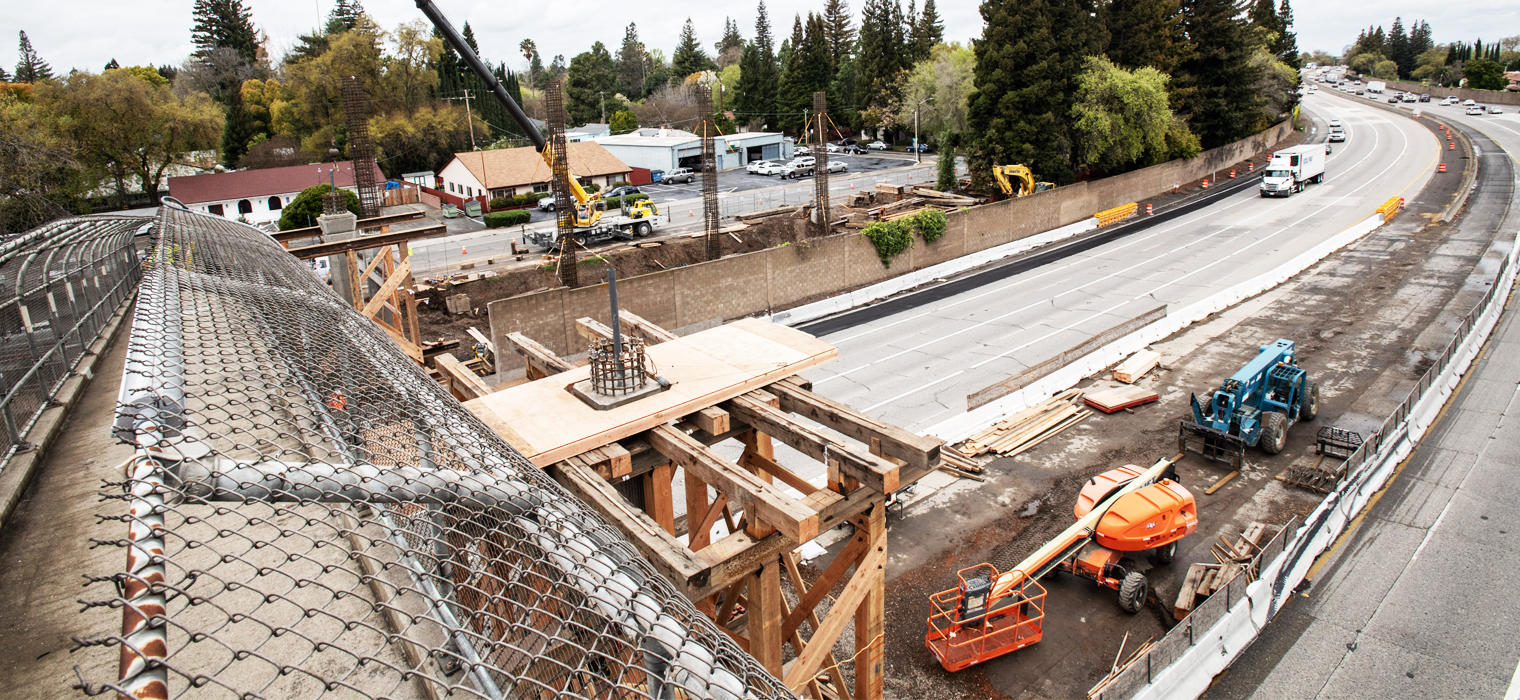
Bridges and Tunnels
High Marks: Caltrans is on pace to exceed the 2027 bridge-fix goal mandated by SB 1. The Department projects that of the almost 13,200 bridges it maintains in the state, least 1,900 will undergo fixes as defined by the CTC in the 10-year reporting period. SB 1 targets commit Caltrans to repairing or rehabilitating at least additional 500 bridges through 2027, an extra 50 a year, on top of the average of 114 that were being fixed annually prior to SB 1. Under the SB 1 formula, Caltrans is required to complete a total of 1,140 bridge fixes through 2027 – but will likely reach that goal by the 2024-25 fiscal year, two years earlier than required.
To earn credit as a “fix,” a bridge project must either 1) improve the condition of the span, either from fair to good, or poor to fair/good; 2) perform a seismic restoration that meets federal guidelines; 3) eliminate the vulnerability to scour conditions caused by water; or 4) address vertical clearance or load capacity issues.
Challenges: As measured by federal standards, the percentage of bridges rated in good condition dropped more than five points from 2017 to 2018, from 65.9 percent to 60.3 percent. Bridges that earned a fair rating from inspectors showed an almost five-point rise, from 30.8 percent in 2017 to 35.7 percent in 2018. The percentage of bridges rated in poor condition went from 3.3 percent to 4 percent in the same reporting period.
Caltrans estimates that percentage of bridges rated in good condition would steadily improve through the 10-year reporting period with the help of SB 1 funding. But even at the current rate of progress, that projected improvement would still fall short of the 2027 good condition target of 83.5 percent for Caltrans-maintained bridges and tunnels.
Unlike some other highway components, problems afflicting bridges and tunnels usually aren’t quickly remedied. Projects are slower to develop because of the environmental approval process and construction schedules. The timeline from problem diagnosis to completed project now averages nine years, depending on the complexity of the work.
Caltrans, with CTC approval, has implemented a series of corrective strategies to quicken the pace of rehabilitation and elevate more bridges into good condition status. To comply with its own highway improvement plan, Caltrans will attempt to shorten several phases of project development, from environmental reviews that can stretch up to a decade, to the pre-design stages that now average three years.
It’s hoped other changes in procedure for bridge repairs will shave time off the review process, and speed the completion of work. Projects will now be reviewed with an eye toward moving them up in the State Highway Operation and Protection Program (SHOPP) schedule, the state’s four-year master plan for highway rehabilitation work, and being delivered sooner. Toward that end, more timely re-inspections will be made to certify projects as complete.
To better track progress, Caltrans also will provide the CTC with more detailed information about bridge conditions and expectations for improvement when submitting a project.
Pavement
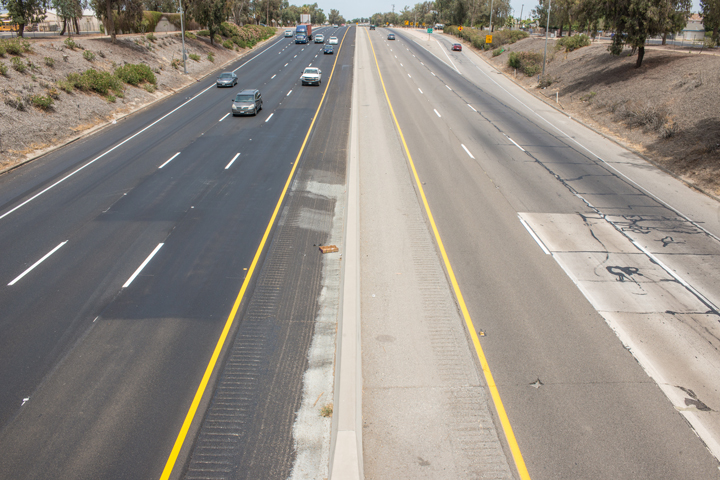
High Marks: Roadway surfaces, particularly on major highways, showed the most improvement of the priority categories in the most recent performance assessment. The percentage of pavement on Class I routes – consisting of interstate highways and other major arterials, urban freeways and expressways – determined to be in good condition improved almost 20 percent from the end of 2016 to the same time in 2018. Almost two-thirds of all Class I roadways, 65 percent, are in good condition, the survey found, up from 45 percent two years earlier – already exceeding the 2027 target of 60 percent.
Only 1.3 percent of Class I pavement was declared poor, and 16.7 percent was rated fair, according to Caltrans’ Automated Pavement Condition Survey. (See accompanying story.) There are 27,151 lane-miles of Class I highways in the state, Caltrans’ largest pavement category and representing more than half of 50,259 lane miles in the SHS.
Class II pavement, on non-interstate roads such as State Route 20 through Mendocino County, SR 29 in the Napa area, and SR 74 in Riverside, also showed significant improvement. Class II routes showed a 10.3 percent jump in the good condition, to 45.6 percent at the end of 2018 from the same period in 2016. Roads in fair condition declined to 53.3 percent from 57.6 percent, and less than 1 percent of Class II roads in the state were in poor shape. With almost 16,400 lane miles, Class II roads make up about one-third of the SHS.
Improvements in condition also extended to Class III roads in more remote areas, such as SR 167 in Mono, SR 36 in Humboldt and SR 58 in San Luis Obispo counties . About 5 percent more of those roadways moved into good condition, or 42.5 percent of the 6,700 lane-mile Class III total. Roads rated in poor condition dropped to 1 percent by 2018’s end, compared with 8 percent two years earlier. Class III routes rated as fair made up the biggest category at 56.5 percent.
All measures met or exceeded TAMP targets, and were on track to satisfy SB 1 requirements by the end of 2027.
SB 1 revenues were credited for the cycle of improvement. As of December 2019, Caltrans had completed 90 pavement projects, and repaired or replaced more than 2,400 lane miles of pavement.
Drainages (Culverts)
High Marks: Judged by either SB 1 or Caltrans’ TAMP standards, the culvert system that protects the SHS is showing steady improvement and projected to reach performance goals by the end of the 2027 reporting period. Culverts channel water under or away from roadways and bridges so the structures can better withstand the forces of erosion or flooding.
By the end of 2018, the most recent available figure, 69 percent of assessed culverts were reported in good condition and needed no repairs. About 21 percent were in fair shape, requiring minor maintenance or repair. Less than 10 percent of the culverts inspected were deemed poor and needed major rehabilitation or replacement. At the present rates of improvement, good and fair assessments are expected to climb to the 90 percent level by 2027.
Challenges: The pace of culvert inspections was emphasized in a 2018 audit of the program by Caltrans’ independent Inspector General. The Department responded by putting in place a performance plan to complete statewide inspections by 2023, adding 145 positions to expedite the process.
Transportation Management System (TMS)
High Marks: There was a marked improvement in the condition of Caltrans’ interconnected grid of electronic devices and hardware critical to the function of the highway system from 2016 to 2018. In the 2019 SHSMP, representing the 2017-18 fiscal year end, the percentage of TMS components in good condition statewide climbed more than eight points, to 67.4 percent. By the same token, elements judged in poor condition — beyond their life cycle or having failed uptime functionality — dropped in percentage by the same amount, from 41 to 33 percent. There is no fair category for TMS elements in either the SB 1 or TAMP measures. Thanks in part to SB 1 revenues, funding to improve the health of the electronic central nervous system of the highway network has more than doubled since 2015, to $216 million in 2019. In the two years since the passage of SB 1, the percentage of TMS in good condition statewide climbed more than seven percentage points, to 74.6 percent, while TMS elements rated in poor condition dropped to 25.4 percent.
Challenges: A performance audit of the TMS program in the 2017-18 fiscal year found infrastructure components had been inaccurately counted and catalogued at the Caltrans district level. TMS program managers are implementing audit recommendations to update the inventory system. Caltrans expects continued improvement towards the 90 percent good condition target.
State Bridges Undergo Thorough, Rigorous Inspections
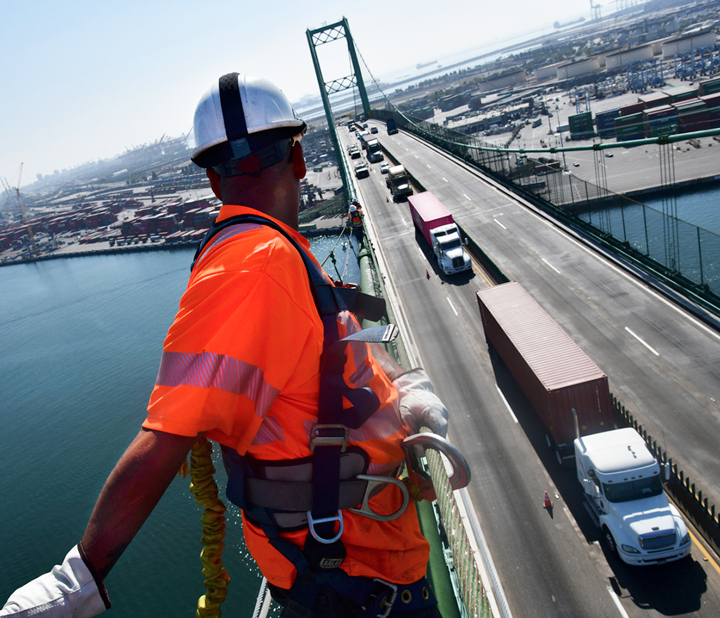
Bridges, and tunnels, undergo an inspection process every two to four years. For bridges, the substructure (piers, abutments, foundations), superstructure (slabs, girders, trusses) and deck area (the road or rail surface) are individually evaluated and scored as in good, fair or poor condition. For the 57 tunnels that Caltrans maintains in the state, the inside liner is inspected and given a condition rating.
Federal regulations require that the lowest rating of the bridge components determines its overall condition for reporting purposes. For example, if a bridge deck condition is rated as poor, but its substructure and superstructure are declared in good condition, the span earns an overall poor mark.
A poor rating does not mean that a bridge is unsafe, but has fixable deficiencies that require maintenance, rehabilitation or replacement. Any bridge that Caltrans declares unsafe is immediately closed to traffic and corrective measures are undertaken.
Highway Pavement Measured with Laser Precision
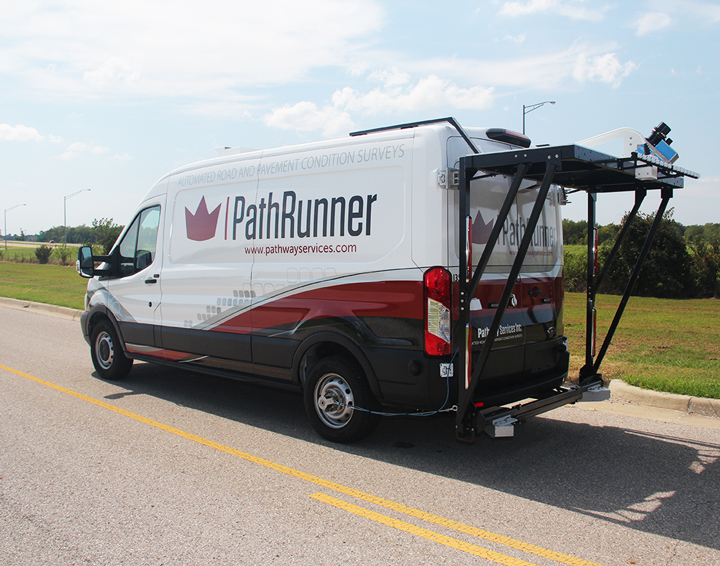
Caltrans assesses the condition of its pavement statewide using a specialized van outfitted with laser-scanning technology that more precisely finds and maps road surface flaws than the previous visual inspection process.
The Department contracts with a vendor to conduct its Automated Pavement Condition Survey on the State Highway System. The survey data is used to compile Caltrans’ annual Level of Service report on pavement conditions, and the scores also are recorded as part of the Senate Bill 1 and internal Transportation Asset Management Plan performance measures.
The survey van crosses the state for most of the year locating and measuring ruts, bumps and cracks on the road network. The vehicle, laden with camera and laser equipment, can travel at highway speeds to capture vital pavement condition data.
The van covered all 50,000-plus lane-miles of the SHS in 2019.
The automated survey offers a far more complete, and accurate, look at state highway pavement conditions around the state. Visual inspections only covered a 20 percent sampling of highways in each regional district. With the ability to survey the entire length and width of road surface, the measurement criteria used to calculate LOS pavement scores also has been refined — eliminating overly broad assessments of conditions based on just one isolated problem.
The arrangement also frees staff from traveling to far-flung parts of their district to survey roads — saving money and time. More importantly, the automated survey spares them from the hazard of conducting inspections as vehicles speed by.
Sources: 2018/19 SB 1 Performance Benchmark Report, Caltrans Office of Transportation Asset Management.