Mile Markers

Caltrans Key Strategic Management Plan Performance Measures


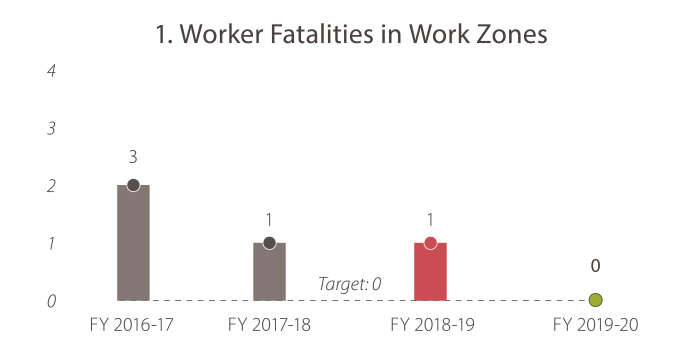
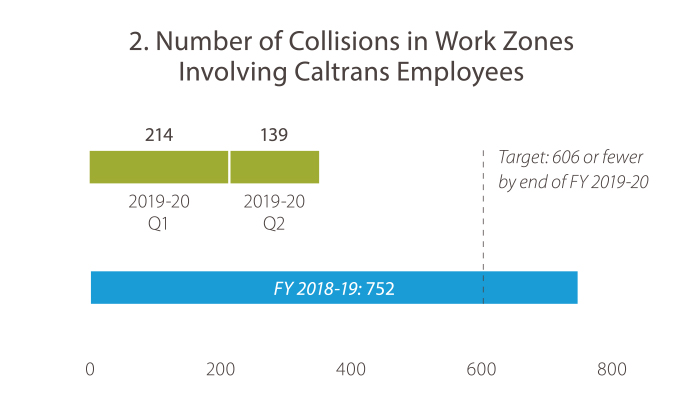
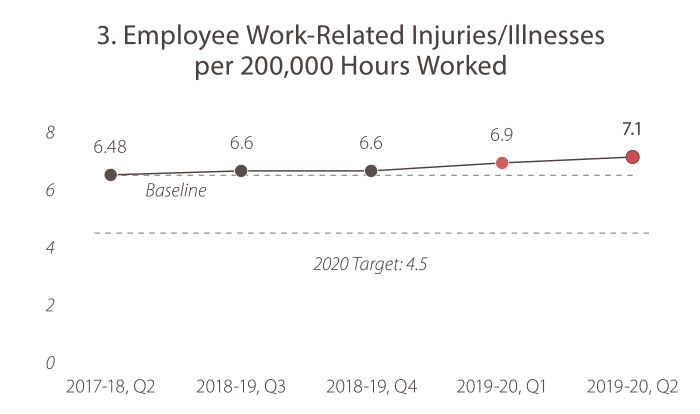
Goal: Safety and Health

Provide a safe transportation system for workers and users, and promote health through active transportation and reduced pollution in communities.

1. Worker Fatalities in Work Zones  In fiscal year 2016-17 there were three. In fiscal year 2017-18 there was one, in 2018-19 there was one. In FY 2019-20 there were zero deaths. The target is zero deaths, and Caltrans is currently meeting the goal target.
2. Number of Collisions in Work Zones Involving Caltrans Employees In fiscal year 2018-19, quarter 4 the number was 752. In 2019-20, quarter1, the number was 214. In 2019-20, quarter 2, the number was 139. The target is less than 606 by end of FY 2019-20. Caltrans is currently on track to meet the goal target.
3. Employee Work-Related Injuries/Illnesses per 200,000 Hours Worked. In 2018-19, quarter 2, the value was 6.48. In 2018-19, quarter 3, the value was 6.6.  In 2018-19, quarter 4, the value was 6.6. In 2019-20, quarter 1, the value was 6.9. In 2019-20, quarter 2, the value was 7.1. The 2020 target is 4.5 or less.


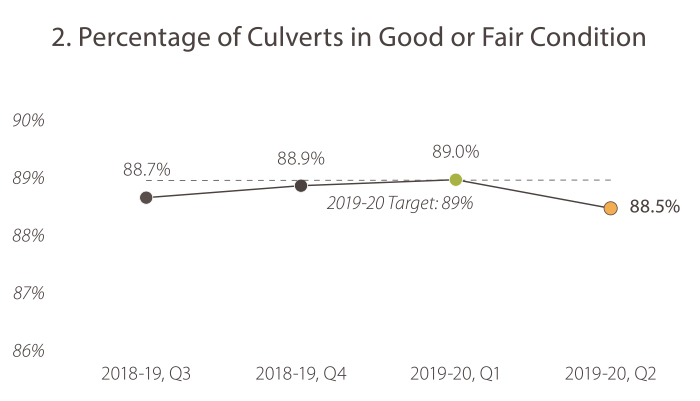
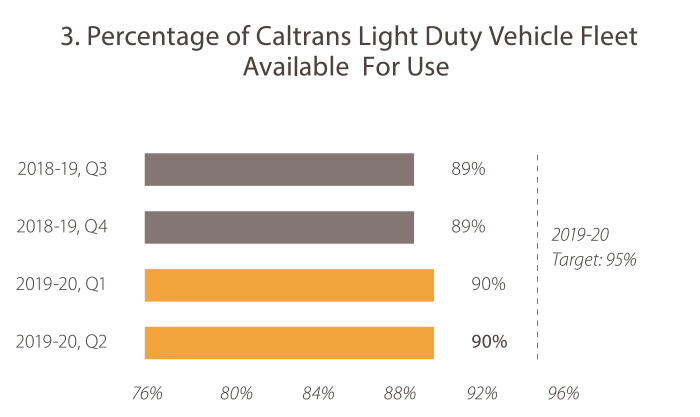
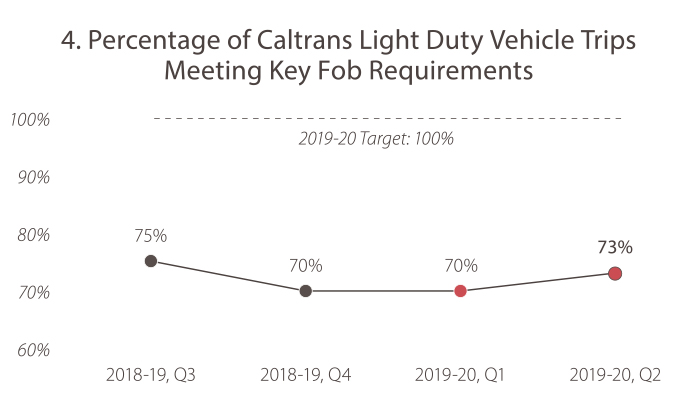
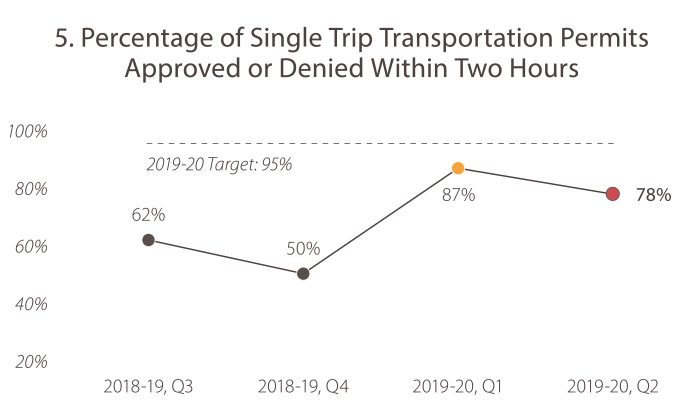
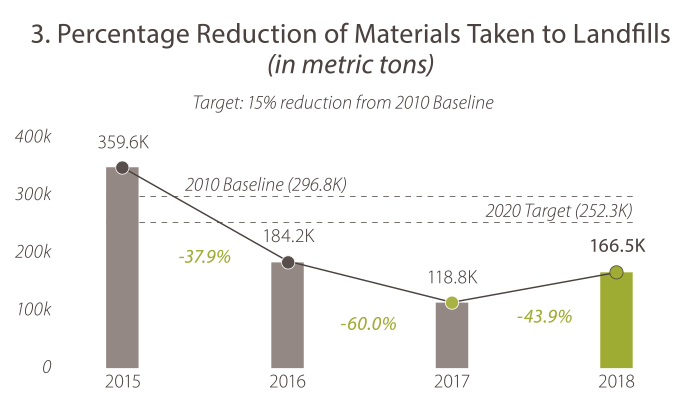
Goal: Stewardship and Efficiency

Money counts. Responsibly manage California’s transportation-related assets.

1. Percentage of Functional Transportation Management System Units In 2018-19, quarter 3, the value was 78%. In 2018-19, quarter 4, the value was 80%. In 2019-20, quarter 1, the value was 81%. In 2019-20, quarter 2 the value was 79.6%. The target is 80% or more. Caltrans is trending toward the goal target.
2. Percentage of Culverts in Good or Fair Condition In 2018-19, quarter 3, the value was 88.7%. In 2018-19, quarter 4, the value was 88.9%. In 2019-20, quarter 1, the value was 89%. In 2019-20, quarter 2, the value was 88.5%. The 2019-20 target is 89%. Caltrans is trending toward the goal target.
3. Percentage of Caltrans Light Duty Vehicle Fleet Avaiable  For Use In 2018-19, quarter 3, the value was 89%. In 2018-19, quarter 4, the value was 89%. In 2019-20, quarter 1, the value was 90%. In 2019-20, quarter 2, the value was 90%. The 2019-20 goal target is 95%. Caltrans is trending toward the goal target.
4. Percentage of Caltrans Light Duty Vehicle Trips Meeting Key Fob Requirements  In 2018-19, quarter 3, the value was 75%. In 2018-19, quarter 4, the value was 70%. In 2019-20, quarter 1, the value was 70%. In 2019-20, quarter 2, the value was 73%. The 2019-20 target is 100%. Caltrans is falling short of the goal target.
5. Percentage of Single Trip Transportation Permits Approved or Denied Within Two Hours In 2018-19, quarter 3, the value was 62%. In 2018-19, quarter 4, the value was 50%. In 2019-20, quarter 1, the value was 87%. In 2019-20, quarter 2, the value was 78%. The 2019-20 target is 95%. Caltrans is falling short of the goal target.
6. Percentage of Encroachment Permits Approved or Denied Within 30 Days In 2018-19, quarter 3, the value was 86%. In 2018-19, quarter 4, the value was 84%. In 2019-20, quarter 1, the value was 85%. In 2019-20, quarter 2, the value was 86%. 2019-20 The target is 90%. Caltrans is trending toward the goal target.

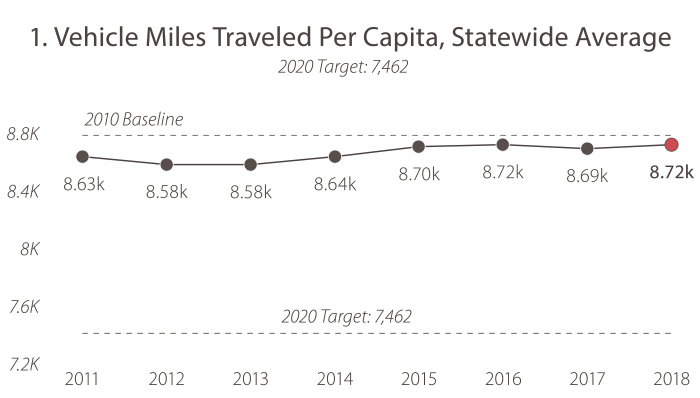
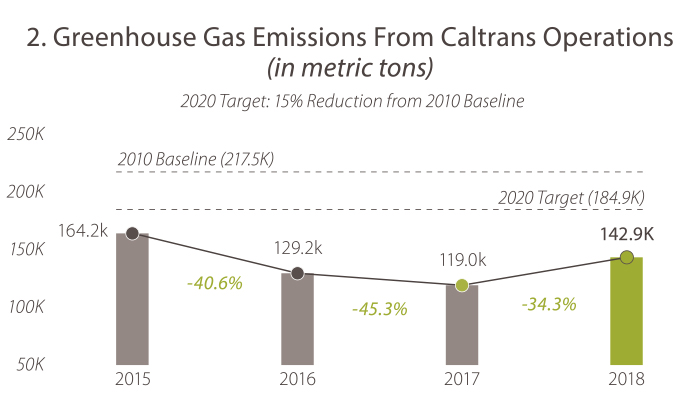
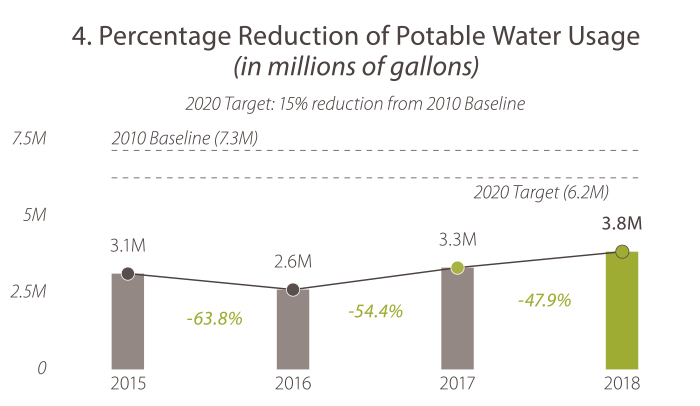
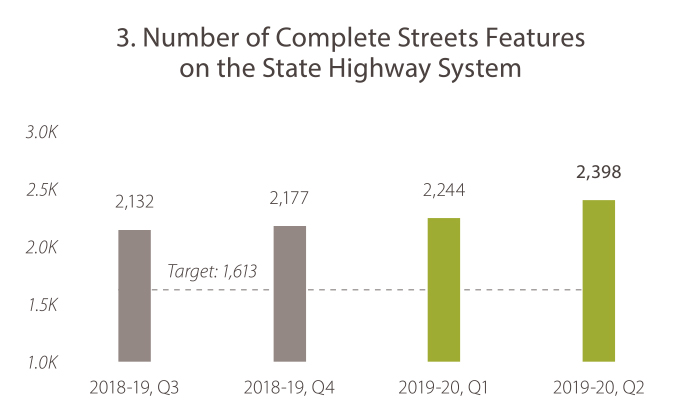
Goal: Sustainability, Livability and Economy

Make long-lasting, smart mobility decisions that improve the environment, support a vibrant economy, and build communities, not sprawl.

1. Vehicle Miles Traveled Per Capita, Statewide Average Values are in thousands: 2011: 8.63  2012: 8.58  2013: 8.58  2014: 8.64  2015: 8.7  2016: 8.72  2017: 8.69  2018: 8.72. The 2020 target is a 7,642 miles traveled, and the goal is not currently being met.
2. Greenhouse Gas Emissions From Caltrans Operations (in metric tons). In 2015, the value was 164.2. In 2016, the value was 129.2. In 2017, the value was 119.0. In 2018 the value was 142.9. The 2020 target is 184.9 and Caltrans is meeting its goal.
3. Percentage Reduction of Materials Taken to Landfills (in metric tons). In 2015, the value was 359.6K. In 2016, the value was 184.2K. In 2017, the value was 188.8K. In 2018 the value was 166.5K. The 2020 target is 252.3 and Caltrans is meeting its goal.
4. Percentage Reduction of Potable Water Usage (in millions of gallons). In 2015, the value was 3.1. In 2016, the value was 2.6. In 2017, the value was 3.3. In 2018 the value was 3.8. The 2020 target is 6.2 and Caltrans is meeting its goal.


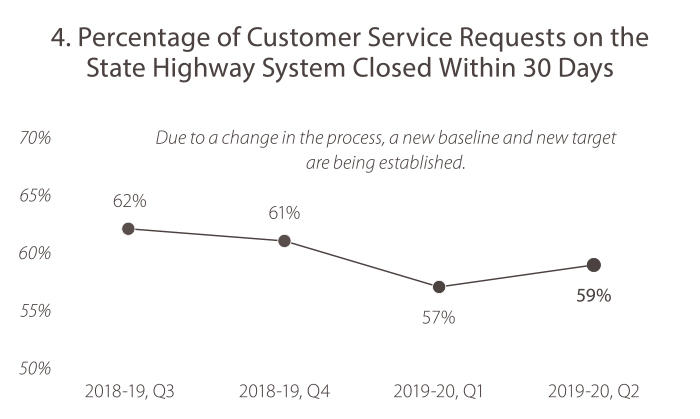
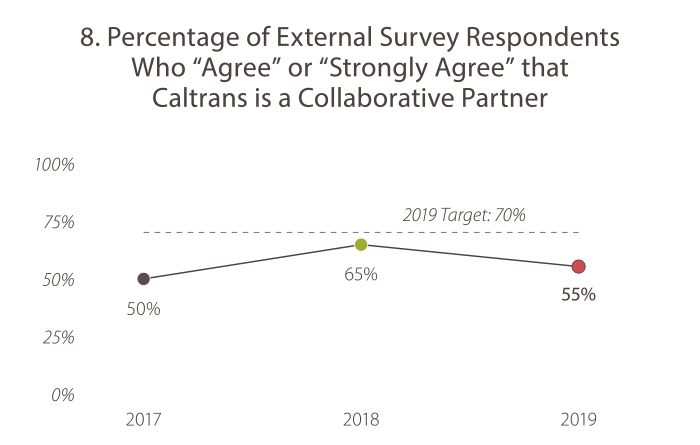
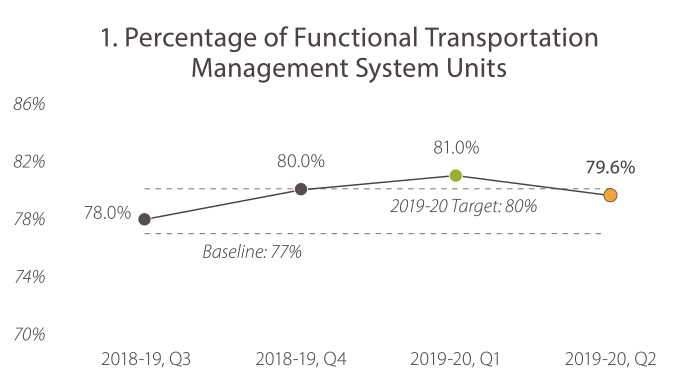
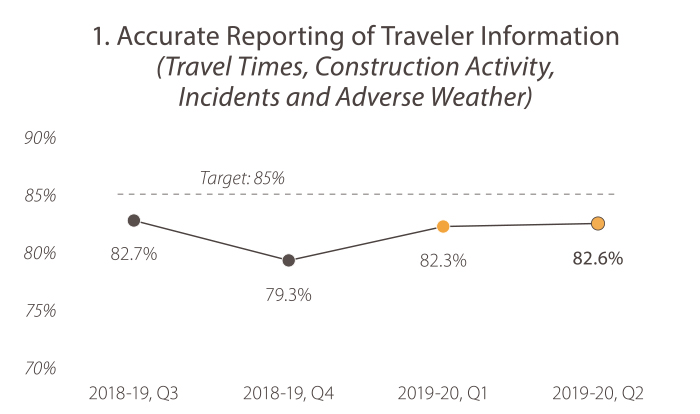
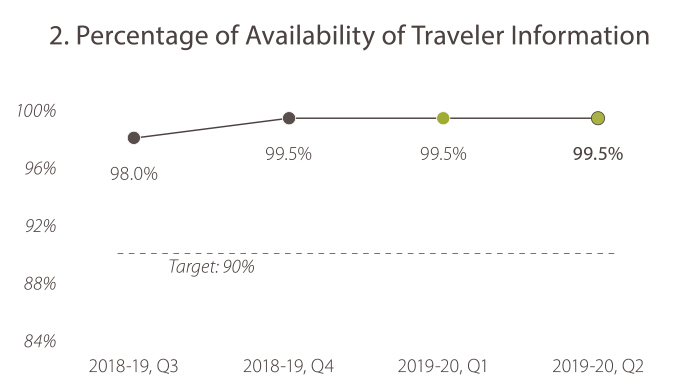
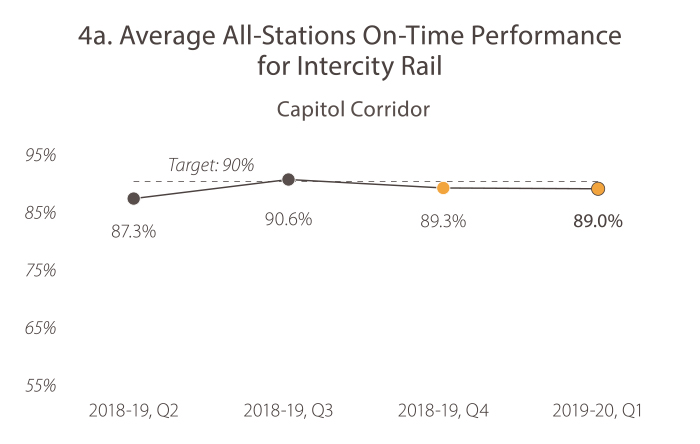
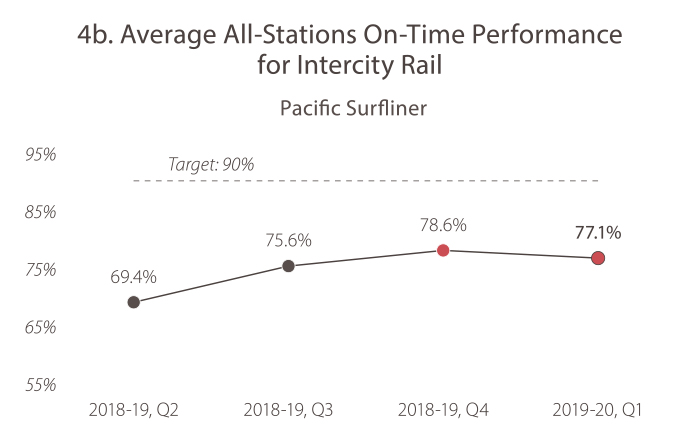
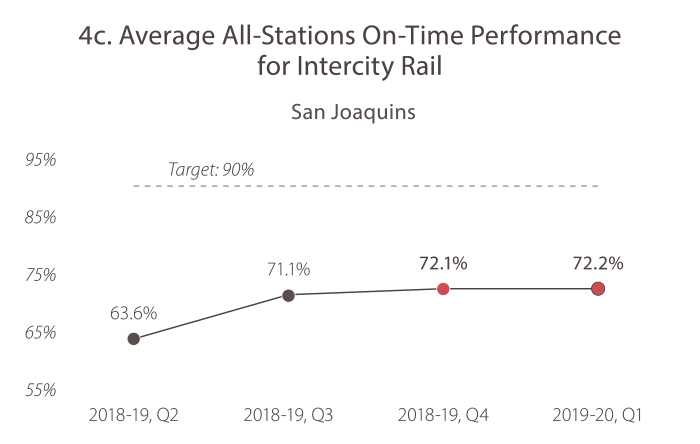
Goal: System Performance

Utilize leadership, collaboration and strategic partnerships to develop an integrated transportation system that provides reliable and accessible mobility for travelers.

1. Accurate Reporting of Traveler Information (Travel Times, Construction Activity, Incidents and Adverse Weather). In 2018-19, quarter 3, the value was 82.7%. In 2018-19, quarter 4, the value was 79.3%. In 2019-20, quarter 1, the value was 82.3%. In 2019-20, quarter 2, the value was 82.6%. The target is 85%, and Caltrans is trending toward its future goal target.
2. Percentage of Availability of Traveler Information. In 2018-19, quarter 3, the value was 98.0%. In 2018-19, quarter 4, the value was 99.5%. In 2019-20, quarter 1, the value was 99.5%. In 2019-20, quarter 2, the value was 99.5%. The target is 90%, and Caltrans is meeting the goal target.
3. Number of Complete Streets Features on the State Highway System In 2018-19, quarter 3, the value was 2,132. In 2018-19, quarter 4, the value was 2,177. In 2019-20, quarter 1, the value was 2,244. In 2019-20, quarter 2, the value was 2,398. The target is 1,613, and Caltrans is meeting the goal target.
4A. Average All-Stations On-Time Performance for Intercity Rail (Capitol Corridor) In 2018-19, quarter 2, the value was 82.3%. In 2018-19, quarter 3, the value was 90.6%. In 2018-19, quarter 4, the value was 89.3%. In 2019-20, quarter 1, the value was 89.0%. The target is 90%, and Caltrans is trending toward its future goal target.
4B. Average All-Stations On-Time Performance for Intercity Rail (Pacific Surfliner) In 2018-19, quarter 2, the value was 69.4%. In 2018-19, quarter 3, the value was 75.6%. In 2018-19, quarter 4, the value was 78.6%. In 2019-20, quarter 1, the value was 77.1%. The target is 90%, and Caltrans is currently not meeting the target.
4C. Average All-Stations On-Time Performance for Intercity Rail (San Joaquins). In 2018-19, quarter 2, the value was 63.6%. In 2018-19, quarter 3, the value was 71.1%. In 2018-19, quarter 4, the value was 72.1%. In 2019-20, quarter 1, the value was 72.2%. The target is 90%, and Caltrans is currently not meeting the target.


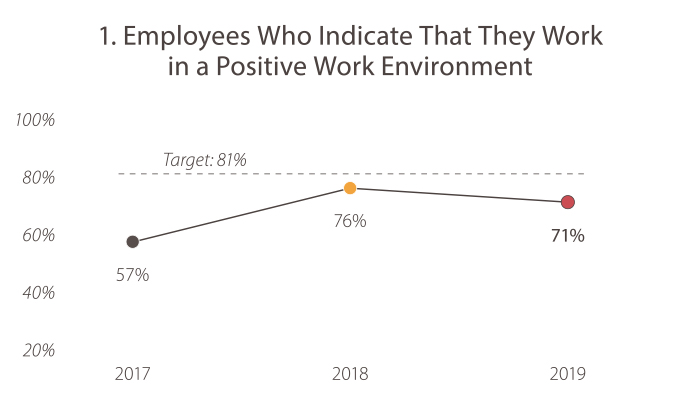
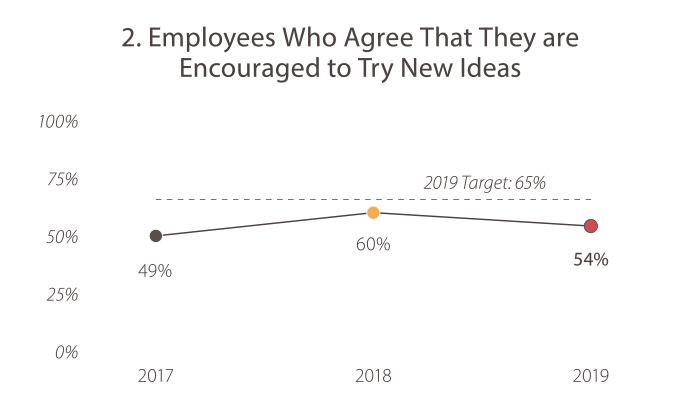
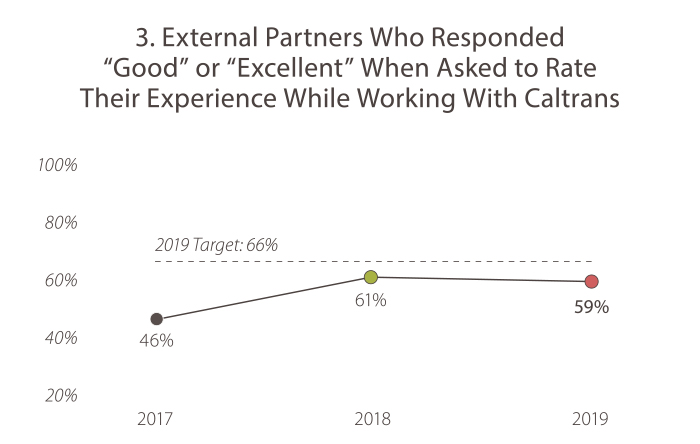
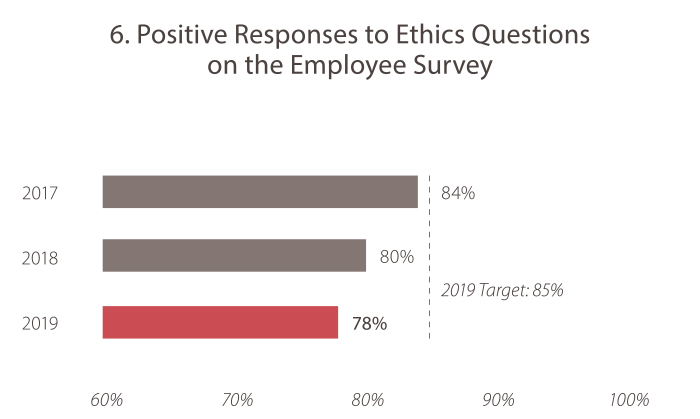
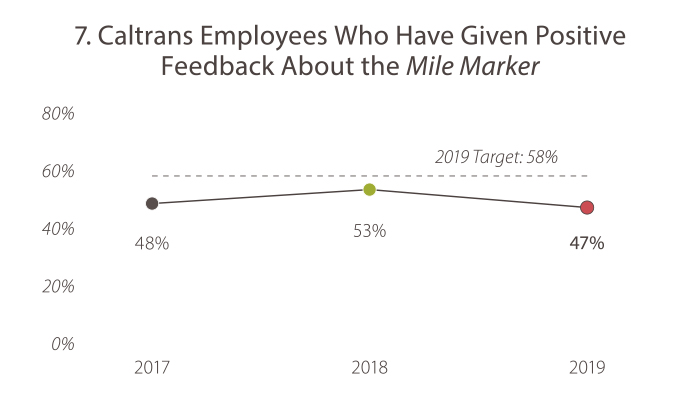
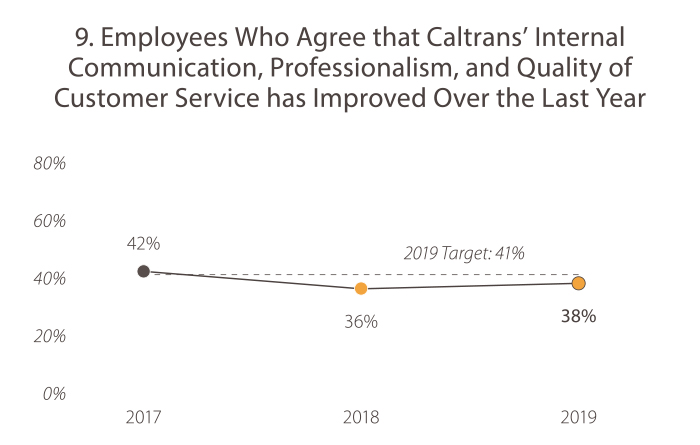
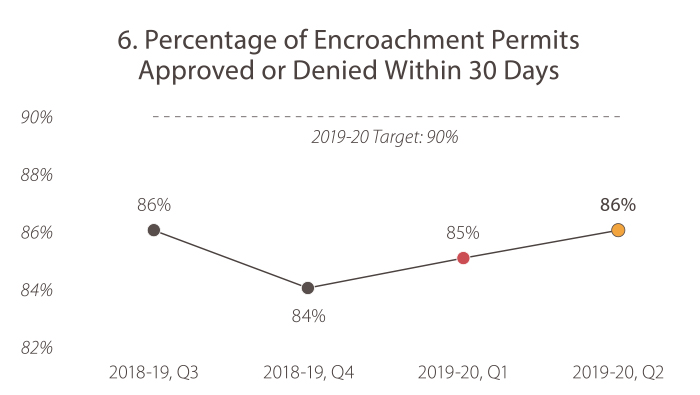
Goal: Organizational Excellence

Be a national leader in delivering quality service through excellent employee performance, public communication and accountability.

1. Employees Who Indicate That They Work in a Positive Work Environment. In 2017, the value was 57%. In 2018, the value was 76%. In 2019, the value was 71%. The target is 81%.
2. Employees Who Agree That They are Encouraged to Try New Ideas In 2017, the value was 49%. In 2018, the value was 60%. In 2019, the value was 54%. The 2019 target is 65%. Caltrans is currently falling short of the goal target.
3. External Partners Who Responded “Good” or “Excellent” When Asked to Rate Their Experience While Working With Caltrans. In 2017, the value was 46%. In 2018, the value was 61%. In 2019, the value was 59%. With a 2019 goal target of a 66%, Caltrans is currently falling short of the goal target.
4. Percentage of Customer Service Requests on the State Highway System Closed Within 30 Days In 2018-19, quarter 3, the value was 62%. In 2018-19, quarter 4, the value was 61%. In 2019-20, quarter 1, the value was 57%. In 2019-20, quarter 2, The value was 59%. Due to a change in the process, a new baseline and new target are being established.
5. Employees Who Rate Caltrans Management as Open and Honest in Communications In 2017, the value was 46%. In 2018, the value was 73%. In 2019, the value was 74%. The target is 78%.
6. Positive Responses to Ethics Questions on the Employee Survey In 2017, the value was 84%. In 2018, the value was 80%. In 2019, the value was 78%. The 2019 target is 85%. Caltrans is currently not meeting the goal target.
7. Caltrans Employees Who Have Given Positive Feedback About the Mile Marker In 2017, the value was 48%. In 2018, the value was 53%. In 2019 , the value was 47%. The 2019 goal target is 58%. Caltrans is currently falling short of the goal target.
8. Percentage of External Survey Respondents Who “Agree” or “Strongly Agree” that Caltrans is a Collaborative Partner. In 2017, the value was 50%. In 2018, the value was 65%. In 2019, the value was 55%. With a 2019 goal target of a 70%, Caltrans is not currently meeting the goal target.
9. Employees Who Agree That Caltrans’ Internal Communication, Professionalism, and Quality of Customer Service Has Improved Over the Last Year. In 2017, the value was 42%. In 2018, the value was 36%. In 2019, the value was 38%. The target is 2019 goal target is 41%. Caltrans is currently trending toward the goal target.