
Section 5.1 - Energy Conservation and Emissions Reduction
This section describes the effect transportation has on energy consumption, air quality, and greenhouse gas (GHG) emissions, and examines how the North Coast Corridor (NCC) program of transportation improvements would minimize energy consumption in the corridor and contribute to regional GHG reductions and air quality improvements. Because transportation has such a direct effect on energy consumption and GHG emissions, it is difficult to separate the two in any discussion of transportation systems and travel demand. Therefore, this section provides a comprehensive discussion of the interrelationships among transportation, energy consumption, and emissions before discussing energy and emissions independently, and is organized as follows:
- An overview of the relationship among transportation, energy consumption, and emissions reduction in the region and the NCC (Section 5.1.1), to include the following:
- A summary of growth projections
- A discussion of the general benefits of transportation improvements on pollutant emissions
- An explanation of the relationship between transportation metrics and pollutant emissions
- A summary of policy requirements and local efforts to reduce emissions and improve air quality
- A summary of PWP/TREP concerns related to energy and emissions, including the projected impacts of the project to the rail corridor, the highway corridor, and the region (Section 5.1.2).
- Identification of PWP/TREP opportunities, design/development strategies, and policies and implementation measures (Section 5.1.3).
- A discussion of consistency with the Coastal Act (Section 5.1.4).
- A discussion of Local Coastal Program consistency (Section 5.1.5).
5.1.1 Transportation, Energy Consumption and Air Emissions
Transporting goods and people account for roughly half of California's energy consumption.1 As population and travel have grown over the past several decades, the energy needed to power this movement of goods and people has grown correspondingly. While state and federal policies are requiring the increased use of alternative fuels and low-emission vehicles, consumption of non-renewable resources, such as fossil fuels, remains high. Current and future energy consumption in the NCC is largely a function of regional and corridor growth, and the resulting demand for movement of goods and people along both the LOSSAN rail and I-5 highway corridors.
5.1.1.1 Regional and Corridor Growth
Historic Growth
From 1970 to 2010, the San Diego region more than doubled in population. In 2010, the region held over 3.2 million people, 1.1 million homes, and 1.5 million jobs.2 Most of the population growth was due to longer life spans and increased birth rates versus migration into the region. Growth has occurred not only in San Diego County and the NCC project area but also in adjacent regions accessed by the I-5 highway and Los Angeles-San Diego-San Luis Obispo (LOSSAN) rail corridors, including Orange County and Riverside County to the north, Imperial County to the east, and Baja California, Mexico, to the south. During this period, travel demand in the corridor has been driven largely by this multi-regional population and housing growth, since development has occurred beyond the corridor and more people are commuting longer distances for housing and employment.
Across the nation, and as people's lives have become more mobile, travel demand has historically increased at a higher rate than population growth. This situation is also true in the San Diego region with travel demand in the NCC growing at a faster rate than the population. This trend indicates that people today are making more trips and covering longer distances than in the past (Figure 5.1-1). In the NCC, established land-use patterns of low density and segregated use lead to a high dependence on the private automobile. As noted in Section 5.1.2.2, even in the absence of highway-capacity improvements, vehicle miles traveled (VMT) on I-5 in the NCC is expected to increase by at least 17% by 2040.3

Future Growth and Infill Development
Through 2040, it is forecast that regional land use and development patterns will change from past patterns of expansion into far-reaching and undeveloped areas to a focus on new infill development in existing developed areas. The growth models used by the San Diego Association of Governments (SANDAG) predict that the region will grow by another 939,000 people by 2040–a 29% increase. Over 300,000 new homes and nearly 400,000 new jobs will be added during this same period.4 In addition, the number of homes located within one-half mile of public transit services is projected to increase from 45% (2008) to 64% (2050).5 To accommodate this influx, SANDAG and the local governments have implemented a Smart Growth land use strategy that seeks to increase population density, minimize growth in VMT, and curb air pollutants and GHG emissions.6 The policies and trends toward Smart Growth indicate that new transportation facilities will be necessary to continue to meet interregional and regional travel demand as well as corridor and localized growth and travel demand.
As discussed in Section 5.2, the NCC is 95% developed with urban uses. Of the 5% of remaining developable land, approximately half (or 3% of NCC land area) is available for residential uses. The population in the NCC is expected to grow 23% between 2010 and 2040. Due to the built-out nature of the corridor, this population growth will be accommodated through redevelopment and infill development in accordance with the region's Smart Growth policies (more dense, mixed-use development in urban areas near transportation facilities). As a result, the NCC improvements will not induce new growth or sprawl, but rather will accommodate forecast growth in the urban corridor, promoting mobility in a more efficient manner.
The NCC's current transportation facilities are plagued by congestion. From the peak-period backups along I-5 to the single-track delays on the LOSSAN rail corridor, the NCC represents a bottleneck not just for the San Diego region but also for the state and national transportation systems. Congestion diminishes air quality throughout the corridor as vehicles are forced to operate at inefficient speeds in stop-and-start settings. Moreover, these bottlenecks on I-5 also spill into the local road network in the form of "cut-through" traffic, which congests local communities and potentially results in localized air pollutant emissions. In addition to congestion, circuitous routes caused by the corridor's topography further increase energy consumption, air quality impacts, and vehicle emissions. With the population growing and travel demand increasing even more rapidly, the future promises even greater levels of congestion in the NCC unless capacity improvements are made.
As the region's transportation system and infrastructure expand to keep pace with projected population and travel growth, policies that emphasize multimodal transportation networks focusing on Smart Growth areas and high-occupancy vehicle (HOV) travel (carpools, vanpools, and transit)–combined with new technologies that reduce energy consumption and vehicle emissions–will minimize or reduce growth in energy consumption, air pollution, and emissions. As discussed in Sections 5.2 and 5.3, some measures to reduce energy consumption and improve air quality are already in place. The LOSSAN rail corridor provides an alternative to automobile travel in the corridor through both intercity and commuter rail. The corridor has existing bicycle and pedestrian facilities. Local governments are also working to implement planned Smart Growth development, which would lower the demand for automobile trips.7 And, through SANDAG, the region promotes a Transportation Demand Management program that includes subsidized vanpools, telecommuting, and other methods for reducing travel demand.
5.1.1.2 Pollutant Emission Reduction Benefits of Transportation Improvements
In the NCC, automobile trips comprise over 95% of all commute trips, resulting in significant energy consumption in the corridor attributable to auto use.8 The proposed NCC transportation improvements are intended to move more people (versus more cars) through the corridor more efficiently while reducing congestion and minimizing impacts to coastal resources. Proposed improvements include HOV/Express Lanes, rail and bus transit, park-and-ride facilities, and bicycle/pedestrian facilities. These strategies are anticipated to have multi-pollutant benefits–by reducing vehicle travel and/or positively affecting vehicle speeds and traffic flow–and are described below.
High-Occupancy Vehicle/Express Lanes
HOV/Express Lanes are intended to maximize the person-carrying capacity of a roadway by altering the design and/or operation of the facility to provide priority treatment for HOVs, such as carpools, buses, and vans. By providing two important incentives–reduced travel time and improved trip time reliability–HOV facilities encourage travelers to shift from single-occupancy vehicles (SOV) to HOV use. This shift should reduce vehicle trips, VMT, and associated emissions from these activities. In addition, HOV/Express Lanes are designed to operate at faster speeds, even during peak periods, and so the strategy also results in an increase in travel speeds for vehicles using the HOV lane.
HOV/Express Lanes affect air pollution emissions in several ways. First, restricting the additional lanes to certain vehicles encourages ridesharing among commuters, resulting in fewer vehicle trips and emissions of all pollutants. HOV/Express Lanes also increase travel speeds for HOV traffic that is able to utilize the lanes, and potentially along the entire roadway. Consequently, the speed changes may have different effects for different pollutants and could even increase some emissions. Implementation of HOV/Express Lanes could also result in some additional emissions that may partially offset the benefits of vehicle trip reduction if some people who previously used transit switch to carpools, thereby increasing the number of vehicles on the road. However, in general, HOV/Express Lanes would be expected to reduce all pollutants.
Rail and Bus Transit
Transit's ability to move high volumes of people generally leads to more energy-efficient and less polluting travel compared to travel by automobile. This is particularly true during peak commute hours when most automobile trips comprise SOVs while transit vehicles (both bus and rail) carry their heaviest loads. Enhancements to the transit network and services in the NCC, including commuter rail, bus rapid transit (BRT) and local bus services, will provide more viable and attractive travel options, which will encourage shifts from SOV to transit. The result reduces energy consumption and emissions by decreasing the number of SOVs on the road.
While travel by transit is generally more energy-efficient, higher train volumes and more locomotives traveling on the LOSSAN rail corridor would lead to greater energy consumption. However, there is a direct relationship between rail corridor congestion and energy consumption by trains. Energy consumption increases as rail corridors become more congested. Bottlenecks caused by single-tracked railway sections (currently more than half of the corridor) result in inefficient locomotive speeds and idling to allow for passing trains. These factors all decrease the efficiency of locomotive travel and further increase energy consumption. Current bottlenecks and speed restrictions will continue and increase under the No-Build Alternative, which will exacerbate the increased energy use from higher volumes of trains and locomotive miles in the corridor. Double-track improvements planned under the Build Alternative will allow for standard speeds along the rail corridor and reduce idling.
Bottlenecks and slower speeds on the rail corridor also lead to increases in emissions from locomotives. Although it is anticipated that innovations in low-emissions locomotive technology through and beyond 2040 will result in cleaner fuel-burning locomotives operating in the corridor (as existing locomotives reach the end of their useful lives and are replaced by new, more efficient models, and new locomotives are acquired to provide more service frequency), emissions will increase if the rail corridor becomes more congested. Relieving track congestion by expanding double-track segments will improve operations along the rail corridor, leading to an overall reduction in air pollutant emissions, including GHG emissions.
Park-and-Ride Facilities
Park-and-ride facilities include the construction or expansion of parking lots where people can park their vehicles and then join a carpool, vanpool, or transit service. Typically, park-and-ride facilities are used in suburban areas. This strategy reduces emissions by decreasing the number of SOVs on the road.
By encouraging drivers to reduce VMT by sharing car trips or taking transit, park-and-ride lots reduce emissions of all pollutants associated with driving.
However, the emissions benefits will not be proportional for all pollutants, since the use of a park-and-ride facility requires individuals to drive to the facility. As a result, this strategy does not reduce the number of vehicle cold starts that are taken, during which time the highest emissions output of carbon moNOXide (CO), nitrogen oxides (NOX), and volatile organic compounds (VOCs) are produced. (In fact, it is possible that park-and-ride lots could lead to increased vehicle trip starts if people who used to pick each other up at individual homes now each drive to the park-and-ride lot.)
Since park-and-ride facilities reduce VMT but not cold starts, these facilities are generally less effective at reducing CO, NOX, and VOCs than other demand management strategies that reduce vehicle trip-making entirely. They can be effective, however, in reducing localized CO (for instance, by reducing vehicle trips into a central business district). Park-and-ride facilities are expected to reduce all pollutants, though they may not contribute significantly to emission reductions. However, they are an important element in supporting congestion-relief efforts as well as public transit and ridesharing. Thus, when taken with the combined benefits of a variety of strategies, park-and-ride facilities can be an important component in addressing air quality problems.
Bicycle and Pedestrian Improvements
Bicycle and pedestrian projects/programs include a wide range of investments and strategies to facilitate and encourage non-motorized travel. Examples of these strategies include bicycle paths and lanes, sidewalks, bicycle racks or lockers, pedestrian urban design enhancements, bicycle share programs, and bicycle incentives. These projects can serve both commute and non-commute trips.
Bicycle and pedestrian projects/programs should reduce all pollutants by reducing VMT; however, impacts are likely to be small given limited shifts from driving and relatively short trip distances. Improved connections to transit services, however, can result in reductions in longer vehicle trips. Bicycle and pedestrian projects reduce all pollutant emissions; in fact, each trip shifted from an SOV to a bicycle or to walking results in a 100% reduction in vehicle emissions for that trip.
5.1.1.3 Relationship Between Transportation Metrics and Pollutant Emissions
In 2010, on-road transportation represented almost 50% of GHG emissions in the San Diego region.9 As shown in Figure 5.1-2, on-road transportation's contribution to GHG emissions depends on several main factors, including the types of vehicles on the road (fleet mix); the type of fuel the vehicles use (gasoline, diesel, or alternative fuels); and the time, distance and efficiency of vehicle travel. While some strategies to reduce GHG emissions–such as improved fuel economy and new fuel and vehicle types–will be determined at the state, national or global levels, others–such as improving efficiency and reducing demand on the transportation system–will be implemented at the local level. The effects of transportation demand and congestion on air emissions, including GHG emissions, can be substantial.
Figure 5.1-2: Defining Transportation Factors for Energy, Air Pollutant Emissions, and Greenhouse Gas Emissions
- Energy, Emissions and GHGs
- VHT and Congestion
- VMT
- Mode Share
- Fleet Mix
Transportation, particularly motor vehicles, is a large source of pollutant emissions. Transportation (including cars, trucks, trains, planes, and ships) is estimated to be responsible for 38% of California GHG emissions in 2009.10 Like energy consumption, air pollution is generally monitored and measured on a regional basis (e.g., air basin, air district boundaries, and counties). While global climate change is a cumulative impact resulting from many years of technological and societal changes and is generally addressed on a larger scale (e.g., state, national, global), GHG inventories have been prepared for smaller regions of emission sources (e.g., cities, counties), and GHG emissions can be estimated for individual projects, such as the proposed improvements. Individual transportation projects may have incremental contributions to GHG emissions, but they generally do not create enough GHG emissions to significantly affect global levels.
Vehicle Miles Traveled and Vehicle Hours Traveled
An individual automobile's energy consumption per mile is the result of many variables: the type of vehicle (including make, model, size) and fuel technology; roadway terrain, where steep grades result in greater fuel consumption; and travel speed, which is a function of both posted speed and traffic congestion. On a broader scale, data and projections about vehicle energy consumption at the corridor and regional levels can generally be extrapolated from two key travel factors:
- Vehicle Miles Traveled (VMT), which is the total number of miles traveled by all vehicles in a given period of time.
- Vehicle Hours Traveled (VHT), which is the total number of hours vehicles spent traveling in a given period of time. It is directly related to traffic volumes, levels of traffic congestion, and the resulting average speed (miles per hour [mph]).
While VMT and VHT can act as proxies for measuring vehicle energy consumption in the corridor, it is misleading to assess these metrics at the corridor level. Policies, plans, and programs to reduce transportation energy consumption, as well as improve air quality and address GHG emissions are appropriately established and evaluated on a regional level by both SANDAG and the State of California. These regional policies capture the combined and interrelated influence of various components of the regional transportation system on energy consumption. The purpose and role of the proposed NCC transportation improvements are to efficiently move more people to, from, and through the corridor as part of the regional transportation network. Given the regional nature of the transportation system, travel behavior (i.e., travelers do not know corridor boundaries), and energy consumption, looking at the regional relationships among vehicle travel, population, and person-trip characteristics (travel mode) provides a more meaningful discussion of the proposed PWP/TREP influence on energy consumption and conservation than restricting analysis to the corridor alone. More directly, the proposed NCC transportation improvements are intended to support regional policies to increase the efficiency of regional transportation/transit; therefore, an assessment of the role the corridor transportation improvements play in the region (by considering regional VHT, VMT, VMT per capita, and HOV/transit-mode share) is as important as the assessment of corridor-only VHT and VMT to the energy consumption discussion.
VMT is calculated as a product of traffic volume and distance for each link and is a measure of the amount and extent of travel in a specified area and time period. It is not unusual for VMT to increase on a transportation facility when a transportation improvement is implemented, as traffic seeks out the new, more optimum route that may be faster or more reliable. In some cases, improvement may encourage more trips in the study area or corridor, and reduce the VMT outside the study area or corridor, as trips shift to the new or enhanced facilities. VHT is calculated as a product of traffic volume and travel time on each link and is a measure of time spent in travel. The vast majority of transportation improvements will create a decrease in VHT, compared to a No-Build Alternative.
Vehicle Speed and Vehicle Hours of Delay
Another key concept in transportation and air quality relationship is vehicle speed. The average speed (miles per hour) is calculated as a ratio of VMT to VHT. It is one of the best measures for distinguishing the differences in overall benefit among the No-Build Alternative and the Build Alternative. Vehicle hours of delay (VHD), which has an inverse relationship to vehicle speed, represents the total number of hours vehicles spent traveling below 35 mph on the highway in a given period of time. Like VHT, VHD is directly related to traffic volumes, levels of traffic congestion, and the resulting average speed.
As indicated above, an increase in VMT can be expected with the addition of new corridor transportation facilities, since VMT is a measure of the amount and extent of travel in the area of concern. However, simultaneous decreases in VHT and VHD–and the corresponding increase in average vehicle speed–indicate a more efficient network and less congestion. Reduced congestion results in an associated reduction in vehicle-generated pollutant emissions that would otherwise occur during stop-and-go traffic conditions. Accordingly, VMT should be analyzed in conjunction with VHT, VHD, and average speed to obtain a correct understanding of the nature of transportation impacts.
Stop-and-go congestion and idling vehicles emit more pollutants than free-flowing traffic, contributing to increased emissions and reduced air quality–a condition that worsens as congestion increases. Fuel consumption increases by about 30% when average speeds drop from 30 mph to 20 mph, while a drop from 30 mph to 10 mph results in a 100% increase in fuel use. Figure 5.1-3 illustrates the relationship between travel speeds and carbon dioxide (CO2) emissions from mobile sources such as automobiles. Automobiles are most efficient when operating at moderate and steady speeds (i.e., little to no VHD). As shown in the figure, the highest level of CO2 emissions occurs at speeds of less than 35 mph–when traffic is not only slow but also generally unstable (stop-and-go).11 As such, the effects of transportation congestion on air emissions, including GHG emissions, can be substantial. A report commissioned by the State of California estimated that approximately 10% of all on-road fuel consumed is a result of congestion.12

5.1.1.4 Policy Requirements and Regional Efforts to Improve Air Quality
Federal and State Requirements
Criteria Pollutants. The federal Clean Air Act (passed in 1970 and last amended in 1990) forms the basis for the national air pollution control effort. The U.S. Environmental Protection Agency (EPA) is responsible for implementing most aspects of the Clean Air Act, which include establishing the National Ambient Air Quality Standards (NAAQS) for the following "criteria pollutants": ozone (O3), nitrogen dioxide (NO2), carbon moNOXide (CO), sulfur dioxide (SO2), particulate matter with an aerodynamic diameter less than or equal to 10 microns in size (PM10) and less than or equal to 2.5 microns in size (PM2.5), and lead. The NAAQS describe acceptable air quality conditions designed to protect the health and welfare of the citizens of the nation.
The Clean Air Act delegates the regulation of air pollution control and the enforcement of NAAQS to the states. In California, air quality management and regulation have been legislatively granted to the California Air Resources Board (CARB). CARB has also established the California Ambient Air Quality Standards (CAAQS), which are generally more restrictive than the NAAQS.
An area is designated "in attainment" when it is in compliance with the NAAQS or the CAAQS, respectively. These standards are set by the EPA or CARB for the maximum level of a given air pollutant that can exist in the outdoor air without unacceptable effects on human health or public welfare. Generally, if the recorded concentrations of a pollutant are lower than the standard, the area is classified as being in "attainment" for that particular pollutant. If an area exceeds the standard, the area is classified as "nonattainment" for that pollutant.
The I-5 NCC is located within the San Diego Air Basin (SDAB) in which the San Diego Air Pollution Control District (SDAPCD) is responsible for air quality management. The SDAB-located in the southwestern corner of California and comprising all of San Diego County–provides the basis for measuring and monitoring air pollutants. The majority of the population and emissions are concentrated in the western portion of the 4,260-square-mile basin. Despite the growth in the population of more than 50% and a doubling of VMT over the past 20 years, overall air quality in the SDAB has improved, reflecting the benefits of cleaner vehicle technology.14
Attainment status for criteria pollutants in the SDAB is shown in Table 5.1-1. Although there are no ambient standards for VOCs (also referred to as reactive organic compounds and reactive organic gases) or NOX, they are important as precursors to O3.
| Federal (EPA) | State (CARB) | |
|---|---|---|
| O3 (1 hour) | Attainment
The federal 1-hour standard of 0.12 parts per million (ppm) was in effect from 1979 through June 15, 2005. The revoked standard is referenced here because it was employed for such a long period and because this benchmark is addressed in State Implementation Plans. |
Nonattainment |
| O3 (8-hour - 1997) | Attainment (Maintenance Area) | Nonattainment |
| O3 (8-hour - 2008) | Nonattainment (Marginal) | Nonattainment |
| CO | Attainment (Maintenance Area) | Attainment |
| PM10 | Unclassifiable
At the time of designation, if the available data does not support a designation of attainment or nonattainment, the area is designated as unclassifiable. |
Nonattainment |
| PM2.5 | Attainment | Nonattainment |
| NO2 | Unclassifiable/ Attainment | Attainment |
| SO2 | Attainment | Attainment |
| Lead | Attainment | Attainment |
| Sulfates | No Federal Standard | Attainment |
| Hydrogen Sulfide | No Federal Standard | Unclassified |
| Visibility-Reducing Particles | No Federal Standard | Unclassified |
Direct emissions of PM10 in the SDAB increased 69% from 1975 to 2000 and are forecast to continue to increase, although at a slower rate. The increase can be attributed to growth in areawide source emissions (mainly dust from vehicles on paved and unpaved roads, construction and demolition equipment operations, and particulates from residential fuel combustion.). This growth reflects the increase in the regional population and VMT. PM10 emissions from stationary sources are also expected to increase slightly because of industrial growth.
CO and VOCs are largely produced by gasoline combustion, with the largest mobile sources being light-duty gas vehicles (including passenger cars, motorcycles, and trucks) and non-road gasoline sources (e.g., lawn and garden equipment and light commercial equipment). The largest source of transportation-related PM10 and PM2.5 emissions is fugitive dust from unpaved and paved roads. Diesel vehicles and equipment are the largest contributors of direct PM10 and PM2.5 exhaust emissions from transportation. Transportation-related NOX and SOX emissions are not dominantly produced by anyone category of vehicles; light-duty vehicles, heavy-duty vehicles, and off-highway mobile sources each contribute a moderate share toward transportation NOX and SOX emissions.15
CO concentrations in the SDAB decreased approximately 56% from 1981 to 2000.16 As a result, the federal CO standards have not been exceeded since 1989, and the state standard has not been exceeded since 1990. The non-desert portion of the SDAB is designated as a federal attainment maintenance area. With continuing enforcement of motor vehicle regulations, the air basin will likely maintain its attainment status for both federal and state standards.17 Pollutant burden levels of CO and NOX are predicted to decrease statewide through 2020 due to the implementation of stringent standards, control measures, and state-of-the-art emission control technologies.
Greenhouse Gases. In addition to criteria air pollutants, GHG are regulated in California and are acknowledged by the EPA as a subset of air pollution.18 GHGs trap heat in the atmosphere; principal GHGs include CO2, methane (CH4), nitrous oxide (N2O), O3, and water vapor (H2O). The greenhouse effect traps heat in the troposphere through a threefold process: short-wave radiation emitted by the Sun is absorbed by the Earth; the Earth emits a portion of this energy in the form of long-wave radiation, and GHGs in the upper atmosphere absorb this long-wave radiation and emit this long-wave radiation into space and toward the Earth. This "trapping" of the long-wave (thermal) radiation emitted back toward the Earth is the underlying process of the greenhouse effect. Some GHGs, such as CO2, CH4, and N2O, occur naturally and are emitted to the atmosphere through natural processes and human activities. Of these gases, CO2 and CH4 are emitted in the greatest quantities from human activities. Emissions of CO2 are largely by-products of fossil-fuel combustion, whereas CH4 results mostly from off-gassing associated with agricultural practices and landfills. Man-made GHGs, which have a much greater heat-absorption potential than CO2, include fluorinated gases (e.g., hydrofluorocarbons, perfluorocarbons, sulfur hexafluoride, and nitrogen trifluoride), which are associated with certain industrial products and processes.19
The effect each GHG has on climate change is measured as a combination of the volume or mass of its emissions and the potential of a gas or aerosol to trap heat in the atmosphere, known as its global warming potential (GWP). The GWP varies among GHGs; for example, the GWP of CH4 is 21, and the GWP of N2O is 310. Total GHG emissions are expressed as a function of how much warming would be caused by the same mass of CO2. Thus, GHG emissions are typically measured in terms of pounds or tons of "CO2 equivalent" (CO2E).20
In 2007, the United Nations' Intergovernmental Panel on Climate Change observed that "changes in atmospheric concentrations of GHGs and aerosols, land cover and solar radiation alter the energy balance of the climate system," and that "increases in anthropogenic GHG concentrations are very likely to have caused most of the increases in global average temperature since the mid-20th century."21 These changes in global climate may have potential impacts on coastal resources, including rising sea level, increased coastal flooding and erosion, inundation of developed areas and public access and recreation areas, alterations to existing sensitive habitat areas, ocean warming, changes in marine species diversity, distribution, and productivity, and increased ocean acidification.
On June 1, 2005, Governor Arnold Schwarzenegger signed Executive Order S-3-05 establishing California GHG emission reduction targets. These goals are to reduce GHG emissions to:
- 2000 levels by 2010;
- 1990 levels by the 2020; and
- 80% below the 1990 levels by the year 2050. In 2006, these goals were reinforced with the passage of Assembly Bill 32 (AB 32), the Global Warming Solutions Act of 2006. In 2008, Senate Bill 375 (SB 375) passed, providing a means to implement the AB 32 goals for cars and light trucks to reduce GHG emissions to 1990 levels by 2020. SB 375 requires the CARB to develop regional GHG emission reduction targets for 2020 and 2035 and to review each region's determination that its plan achieves those targets. Regional metropolitan planning organizations are required to include a sustainable communities' strategy in their regional transportation plan (RTP) that seeks to achieve these targeted reductions in GHG emissions.
In response to the transportation sector accounting for more than half of California's CO2 emissions, AB 1493 (Pavley) was enacted in 2002, which required CARB to set GHG emission standards for passenger vehicles, light-duty trucks, and other vehicles determined by the state board to be vehicles whose primary use is noncommercial personal transportation in the state. The bill required that CARB set the GHG emission standards for motor vehicles manufactured in 2009 and all subsequent model years. CARB adopted the standards in September 2004. When fully phased in, the near-term (2009-2012) standards will result in a reduction of about 22% in GHG emissions compared to the emissions from the 2002 fleet, while the mid-term (2013-2016) standards will result in a reduction of about 30%. California's efforts to reduce GHG emissions from light-duty motor vehicles have been expanded by parallel regulation of GHG emissions and fuel economy by the EPA and National Highway Traffic Safety Administration, respectively, most recently in August 2012. The first phase of the Corporate Average Fuel Economy standards, for the model year 2017 to 2021, are projected to require, on an average industry fleet-wide basis, a range from 40.3 to 41.0 miles per gallon in the model year 2021.22
California adopted a Low Carbon Fuel Standard (Executive Order S-1-07) in 2007 that requires a reduction in the carbon intensity of California's passenger vehicle fuels by at least 10% by 2020. This reduction will be achieved by offering a variety of fuel options for personal vehicles that include electricity, natural gas, propane, and biofuels. SANDAG has taken strides to assess what regional infrastructure is needed to accommodate more alternative fuel choices across the region. It also has supported the development of publicly accessible electric charging stations.23
Energy, air quality, and GHGs are interrelated when it comes to transportation. Reductions in energy consumption resulting in changes in travel behavior and technological advances often lead to reductions in air pollutants and GHG emissions. The California Coastal Act seeks to minimize energy consumption and VMT within the Coastal Zone, which, in turn, can assist in ensuring consistency with regional SDAPCD or CARB requirements, and state legislation relating to potential air pollution emissions and GHGs.
The proposed I-5 highway corridor improvements are included in the SANDAG 2050 Regional Transportation Plan (2050 RTP). The corridor improvements are also included in the 2030 Revenue Constrained RTP, the 2008 Regional Transportation Improvement Program, and the 2012 Regional Transportation Improvement Program, which were found to conform with regional, state, and federal air quality standards set by SANDAG, the Federal Highway Administration, and the Federal Transit Administration; therefore, the program of projects conforms with the State Implementation Plan.
Regional Policy Efforts to Improve Air Quality
In 2006, Caltrans developed a Climate Action Program to promote clean and energy-efficient transportation, and to facilitate and coordinate implementing climate change strategies and related activities within Caltrans and partner agencies. Two of the main strategies of the Climate Action Program are to reduce GHG emissions from transportation (through system improvements, lowered congestion, and utilization of intelligent transportation systems) and land use sources (including increasing efficiency of facilities, fleets, and equipment through reduction measures and technology). The Climate Action Program emphasizes using technological and market mechanisms for reducing GHG emissions, developing alternative fuels and vehicles, and increasing vehicle efficiency to gain the most reductions.
In 2008, the State of California set ambitious goals for GHG reduction across its 18 metropolitan regions through SB 375. As part of SB 375, CARB set targets for cars and light trucks in the San Diego region that call for a 7% per-capita reduction in GHG emissions by 2020 and a 13% reduction by 2035. Since a significant portion of GHG emissions come from transportation sources, these targets heavily influenced the composition of transportation projects and the design of the transportation network in the 2050 RTP.
In 2010, SANDAG published a Climate Action Strategy (CAS) that was prepared under a partnership with the California Energy Commission. The CAS acts as a guide for SANDAG and local governments and policymakers in addressing climate change. The CAS recognizes the importance of local and regional action to achieve statewide climate goals and identifies how local jurisdictions can participate in achieving those goals. Because local governments have greater control over some areas of decision-making, the CAS emphasizes those areas where the greatest impact can be made at the local level (e.g., land use patterns, transportation infrastructure, and related public investment, building construction and energy use, and government operations). These areas constitute the majority of statewide emissions. A major purpose of the CAS is to identify land use and transportation policy measures that would help the SANDAG region meet or exceed its SB 375 targets for reducing GHG emissions from passenger cars and light-duty trucks. For each of the subject areas, goals, objectives, and policy measures are introduced to further describe how GHG emissions reductions could be achieved. The goals that are applicable to the PWP/TREP include the following:24
- Minimize GHGs when vehicles are used.
- Promote use of low-carbon alternative fuels.
- Protect transportation infrastructure from climate change impacts.
- Protect energy infrastructure from climate change impacts.
- SANDAG and local governments lead by example.
The 2050 RTP includes a Sustainable Communities Strategy (SCS), which demonstrates how development patterns and the transportation network, policies, and programs will work to achieve the region's 2020 and 2035 GHG emission reduction targets. In accordance with SB 375, the building blocks of the 2050 RTP/SCS include the following:
- A land use pattern that accommodates the region's future employment and housing needs, and that protects sensitive habitats and resource areas.
- A transportation network of public transit and Express Lanes, and highways, local streets, bikeways, and walkways built and maintained with available funds.
- Managing demands on the transportation system (also known as transportation demand management [TDM]) in a way that reduces or eliminates traffic congestion during peak periods of demand.
- Managing the transportation system (also known as transportation system management [TSM]) through measures that maximize the efficiency of the transportation network.
- Innovative pricing policies and other measures designed to reduce VMT and traffic congestion during peak periods of demand.25
Central to the San Diego region's SCS are explanations for how the San Diego region will grow while improving the quality of life.26 Caltrans acknowledged the need to develop energy-efficient projects in the Director's Policy on Energy Efficiency, Conservation and Climate Change (June 2007), which states that Caltrans "incorporates energy efficiency, conservation, and climate change measures into transportation planning, project development, design, operations, and maintenance of transportation facilities, fleets, buildings, and equipment to minimize use of fuel supplies and energy sources and reduce GHG emissions."
The key difference between past and current regional planning efforts is a sharper focus on reducing GHG emissions from cars and light trucks. For these vehicles, the state has developed a three-tiered approach to reducing GHG emissions. The state has enacted laws to increase vehicle fuel efficiency and to increase the use of alternative, lower carbon transportation fuels. SANDAG and other regional stakeholders are supporting infrastructure planning for alternative fuels.27 Together, with the regional land-use policies and transportation investments contained in the 2050 RTP, the reductions in GHG emissions as required by AB 32 and SB 375 will occur throughout the SDAB.
The 2050 RTP and its SCS will guide the San Diego region toward a more sustainable future by focusing housing and job growth in urbanized areas, protecting sensitive habitat and open space, and investing in a transportation network that provides residents and workers with transportation options that will help reduce GHG emissions. The PWP/TREP will assist in achieving these goals by increasing public transit capacity and accessibility, as well as by reducing congestion. It is anticipated that with each RTP (every four years) there will be new opportunities to help reduce GHG emissions. The regionwide 2050 RTP/SCS reduces energy consumption and GHG emissions with the following key achievements:
- Meets state GHG reduction mandates.
- Funds $2.7 billion for regional and local bicycle and pedestrian projects and programs.
- Provides 156 new miles of trolley service and a new trolley tunnel in downtown San Diego.
- Expands and speeds up COASTER service in the NCC.
- More than doubles the transit service miles and increases transit frequency in key corridors.
- Creates 130 miles of Express Lanes to facilitate carpools, vanpools, and premium bus service and creates new carpool and telework incentive programs to reduce solo driving.
- Doubles the number of homes and jobs within one-half mile of transit.28
5.1.2 PWP/TREP Concerns
Environmental documentation and analysis prepared for the proposed improvements in the rail and highway corridors indicate that energy use and the emission of some air pollutants in the corridors are expected to increase whether corridor transportation improvements are constructed or not, as a result of regionally projected population, employment, and travel growth in the NCC.29 Increases in energy consumption, air pollutants and GHG emissions from rail and highway improvements could occur from the locomotives and vehicles using the proposed transportation facilities. Proposed PWP/TREP improvements could also individually or cumulatively affect energy use, air quality, and GHG emissions caused by short-term project construction.
5.1.2.1 LOSSAN Rail Corridor Impact Assessment
The LOSSAN rail corridor between San Luis Obispo and San Diego is the second busiest intercity rail corridor in the nation. In 2010, more than 8 million passengers used the rail corridor to commute to work, and for vacations and other purposes.30 As shown in Table 5.1-2A and 5.1-2B, the Amtrak Pacific Surfliner, which operates along the corridor between San Diego and San Luis Obispo, carries approximately 2.7 million passengers annually (approximately 7,400 per weekday), including over 700,000 annual boardings within the NCC. Amtrak's 20-Year Improvement Plan projects ridership to increase to 4.7 million annually (13,400 per weekday) by 2030 along the Pacific Surfliner route, with approximately 1.3 million of these riders boarding in the NCC. The PWP/TREP program of improvements–most notably the double-tracking of the LOSSAN rail corridor–will enable these increases in service.
| 2012 Existing / Daily | 2012 Existing / Annual | 2030 Projected / Daily | 2030 Projected / Annual | |
|---|---|---|---|---|
| Amtrak Pacific Surfliner (weekday averages based on Federal Fiscal Year 2012) |
7,400 | 2.7 million | 13,400 (Calculated using the following annualization factors that are based on Fiscal Year 2012 or Federal Fiscal Year 2012 data: Pacific Surfliner Annualization Factor: 354 Metrolink/COASTER Annualization Factor: 268). |
4.7 million |
| Commuter Rail (Metrolink/COASTER) | 21,100 | 5.6 million (Calculated using the following annualization factors that are based on Fiscal Year 2012 or Federal Fiscal Year 2012 data: Pacific Surfliner Annualization Factor: 354 Metrolink/COASTER Annualization Factor: 268). |
39,000 (Calculated using the following annualization factors that are based on Fiscal Year 2012 or Federal Fiscal Year 2012 data: Pacific Surfliner Annualization Factor: 354 Metrolink/COASTER Annualization Factor: 268). |
10.5 million |
| Total LOSSAN | 28,500 | 8.3 million | 52,400 | 15.2 million |
| 2012 Existing / Daily | 2012 Existing / Annual | 2030 Projected / Daily | 2030 Projected / Annual | |
|---|---|---|---|---|
| Amtrak Pacific Surfliner | 2,200* | 700,000 | 3,800(Calculated using the following annualization factors that are based on Fiscal Year 2012 or Federal Fiscal Year 2012 data: Pacific Surfliner Annualization Factor: 354 Metrolink/COASTER Annualization Factor: 268). | 1.4 million |
| Commuter Rail (Metrolink/COASTER) | 4,100 | 1.1 million (Calculated using the following annualization factors that are based on Fiscal Year 2012 or Federal Fiscal Year 2012 data: Pacific Surfliner Annualization Factor: 354 Metrolink/COASTER Annualization Factor: 268). |
18,500 (Calculated using the following annualization factors that are based on Fiscal Year 2012 or Federal Fiscal Year 2012 data: Pacific Surfliner Annualization Factor: 354 Metrolink/COASTER Annualization Factor: 268). |
4.9 million |
| Total NCC | 6,300 | 1.8 million | 22,300 | 6.3 million |
The Metrolink and COASTER commuter rail systems serve over 5.6 million passengers annually throughout their service areas (the Los Angeles and San Diego regions, respectively). Within the NCC, these services accommodate approximately 1.1 million annual boardings (an average of 4,100 each weekday). By 2030, these commuter rail lines are projected to serve 10.4 million passengers annually, with the NCC portion increasing fourfold to 4.9 million (approximately 18,500 riders per weekday). Ridership on the COASTER commuter rail service, which operates between Oceanside and downtown San Diego, has more than tripled since service was initiated in 1995 to over 1.7 million riders annually (approximately 6,500 per weekday).31 Expansion of travel routes and destinations by rail through the interconnectedness of rail infrastructure and associated ease of rail travel will encourage additional rail ridership. The COASTER is scheduled to expand its service significantly through 2040, gradually increasing the number of trains that traverse the corridor each weekday from 22 to 54, with additional weekend service also planned.32 With the proposed LOSSAN rail corridor improvements in the NCC, COASTER ridership is projected to increase to over 12,900 passengers each weekday by 2040 and will have the capacity to carry up to 35,000.33
In addition to passenger rail service, the LOSSAN rail corridor also accommodates freight rail. Between 2005 and 2020 the number of freight locomotive miles traveled along the entire LOSSAN rail corridor will increase an estimated 66% (most freight trains require four locomotives).
Energy Consumption
By 2020, the combined increase in passenger and freight locomotive miles in the corridor is estimated to be 62% above 2005 levels, with passenger rail miles increasing 56% and freight rail miles increasing 66% above 2005 levels.34 These changes will result in a corresponding increase in energy consumption by locomotives in the LOSSAN rail corridor. However, this estimate is based entirely on locomotive miles and does not consider the energy used per person transported, the fuel efficiency of the trains at different speeds, impacts of locomotive idling, or potential mode shifts from private automobile to rail.35 The projected growth in rail passengers and the ability to reduce train idling and maintain steady speeds depend on the LOSSAN rail corridor improvements.
Planned improvements to the LOSSAN rail corridor would address current corridor operating deficiencies, which would help reduce congestion and improve speeds and lead to greater energy conservation.
Air Quality and Greenhouse Gas Emissions
As with energy consumption, improvements and expanded capacity in the LOSSAN rail corridor would lead to growth in locomotive miles, and therefore growth in the pollutant and GHG emissions directly attributable to rail miles traveled. Pollutants would generally be expected to increase in direct proportion to the growth in locomotive miles. Program-level analyses for the LOSSAN corridor indicate that by 2020, improvements along this entire corridor could lead to emissions that exceed daily SDAPCD air quality thresholds for NOX and other pollutants.36 In addition, the program-level analysis indicates that locomotives will emit 64% more GHGs in 2020 than they did in 2005.37
However, projections for locomotive emissions for future periods are likely overstated because they do not account for the expected change to a cleaner locomotive fleet and more efficient, less congested operations on the rail corridor resulting from project improvements. While the individual projects in the rail corridor, or the entire program of rail corridor improvements, are unlikely to significantly affect global levels, the projects' incremental contributions should be addressed.38
Conversely, increased service levels on the rail corridor could lead to increased auto emissions. More service on the corridor would require more frequent waits at at-grade railroad crossings for autos.39 In addition, passenger increases anticipated as a result of LOSSAN rail corridor improvements would lead to more traffic around stations as riders access station park-and-ride facilities or get dropped off at stations. Both of these "secondary" impacts from rail corridor improvements could increase vehicular emissions in localized air quality hotspots, at-grade crossings, and around stations.40 However, the grade separations proposed as part of three improvement options would help to minimize potential emissions from idling automobiles and trucks at at-grade crossings. The proposed double-tracking through the study area could also reduce vehicular delays at crossings by allowing two trains to pass through a given area at the same time.
The overall growth in the number of trains and locomotives on the LOSSAN rail corridor described previously will contribute to air emissions in the SDAB; however, agreements between operators and regulators will provide locomotive fleet emission improvements in California 20 years ahead of the rest of the country.
Temporary Construction Impacts
Energy consumption associated with constructing the LOSSAN rail corridor track, station, and support facility improvements would result in one-time, non-recoverable energy costs associated with construction. Given the scope and scale of the improvements proposed, it is anticipated that the construction-related energy requirement would be substantial.41
Constructing the proposed rail improvements would cause temporary increases in air pollutant emissions in the project area. Emissions sources would include diesel-powered construction equipment, workforce travel to and from the project site, and fugitive dust from construction activities. Implementing the LOSSAN rail corridor improvements would be done incrementally over many years; therefore, the potential for cumulative impacts to the SDAB would be reduced as projects would be spread out both geographically and over time.42
5.1.2.2 I-5 Highway Corridor Impact Assessment
As discussed in Section 5.1.1.3, freeway VMT is only one component in the relationship between the comprehensive transportation system and air pollutant and GHG emissions. Other important factors include congestion levels, vehicle speeds, VHT and VHD, as well as the levels of VMT and traffic on parallel local arterials. In this case, the modest increase in projected VMT on I-5 (relative to the No-Build scenario) would be partially offset by increased vehicle speeds, reduced congestion and reduced hours of delay on I-5, and decreases in both VMT and average daily traffic (ADT) on parallel arterials Coast Highway and El Camino Real. All of these factors positively influence congestion-related vehicle emissions and would help to offset the projected increase in I-5 VMT. Specifically, construction of the four Express Lanes would provide the following transportation improvements that would lead to energy- and air quality-related benefits when compared to the No-Build Alternative:
- A reduction of 25-35% in peak-period corridor travel times on I-543
- A reduction of 4% in VHT on I-544
- A reduction of 47% in VHD on I-545
- Reductions of 17% and 10% in VMT on Coast Highway and El Camino Real, respectively46
- Reductions of 12% and 3% in ADT on Coast Highway and El Camino Real, respectively47
- A decrease in the duration of daily peak-period congestion on I-5 from a range of 12 to 13 hours to a range of 5 to 6 hours48>
Because the proposed project would improve traffic operations, it would contribute to lower air pollutant emissions, including particulate matter emissions, as compared to the No-Build Alternative. Therefore, the proposed project is in conformance for federal PM10 and PM2.5 standards and is unlikely to increase the frequency or severity of any existing exceedances regarding the nonattainment of state PM10 and PM2.5 standards.
Vehicle Miles Traveled
Within the NCC, existing and projected daily VMT on I-5 is shown in Table 5.1-3 for the Build and No Build Alternatives. During the planning process, SANDAG and Caltrans have produced two travel demand forecasts: the Series 11 forecast to a 2030 horizon year, and the Series 12 forecast to a 2040 horizon year. Both of these forecasts, which assume planned improvements to the parallel LOSSAN rail corridor, project significant growth in I-5 travel demand in the NCC of between 17% and 29% without the implementation of the NCC highway improvements (the No-Build Alternative). This significant No-Build Alternative growth projection indicates that the majority of growth in travel demand and VMT will occur regardless of whether highway-capacity improvements are made between today and the horizon years, and reveals that without any improvements, the highway will be unprepared to meet future demand.
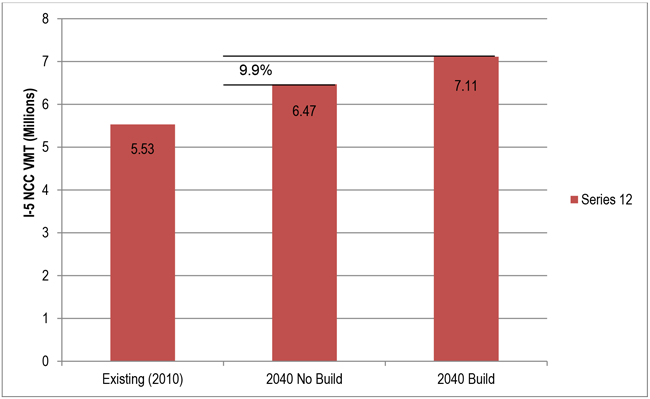
As shown in Table 5.1-3 and Figure 5.1-4, with the addition of the four Express Lanes–and assuming all other planned projects (highway, rail, and transit) are implemented in accordance with the 2050 RTP and the PWP/TREP–the travel forecasts project only an additional 4.0% (Series 11, 2030) to 9.9% (Series 12, 2040) increase in VMT above the level of the No-Build Alternative projection. This incremental difference between the No-Build and Build Alternatives is less a result of induced demand (i.e., new trips created) and more a result of latent demand (i.e., improved access) and a shifting of travel from the parallel arterials of Coast Highway and El Camino Real to I-5, as travel becomes more reliable on I-5 and "spillover" traffic on local roads is minimized.
| Existing 2006 |
Existing 2010 |
I-5 No-Build 2030 |
I-5 No-Build 2040 |
I-5 No-Build % Change from Existing |
I-5 Build 2030 |
I-5 Build 2040 |
I-5 Build % Change from I-5 No-Build |
|
|---|---|---|---|---|---|---|---|---|
| Daily VMT (Series 11) |
5.44 million | – | 7.05 million | – | 29.6% | 7.33 million | – | 4.0% |
| Daily BMT (Series 12) |
– | 5.53 million | – | 6.47 million | 17.0 % | – | 7.11 million |
The combined highway improvements and resulting change in travel behavior will make corridor travel on both the highway and local streets more efficient and reliable, improving coastal access. In addition, as shown in Figure 5.1-5, most of the I-5 VMT growth that was originally projected to occur by 2030 in the Series 11 forecast is now projected to occur well beyond 2040 in the Series 12 forecast, resulting in a slower VMT growth rate for the highway than previously projected, further indicating that the highway improvements will accommodate, rather than induce, travel demand.
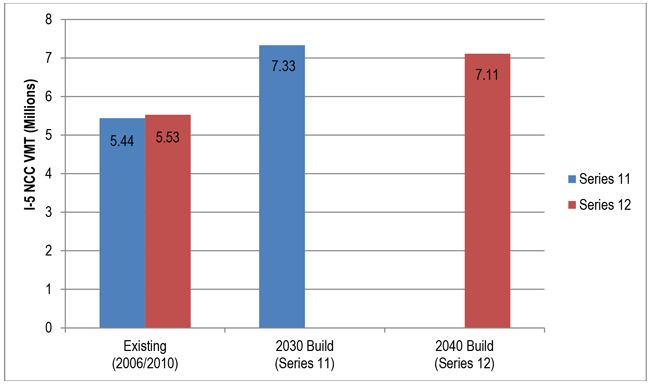
Sources: SANDAG/Caltrans Series 11 Model, August 2010; SANDAG/Caltrans Series 12 Model, November 2011.
It is also important to note that increases in VMT on I-5 relate to vehicle VMT and not person VMT. In other words, the proposed Express Lanes on I-5 are expected to encourage an increase in carpools and vanpools in the corridor, resulting in more people per vehicle traveling through the corridor. With a projected increase in person-trips that is greater than the projected increase in VMT, the result would be lower energy consumption per person-trip. The ability to increase person-carrying capacity on the NCC I-5 Express Lanes would improve access to coastal and other recreational use areas at a lower energy requirement per person than under existing conditions or the No Build Alternative.
Congestion and Travel Time
As discussed in Section 5.1.1.3, VMT is only one component of the relationship between the transportation system and energy and emissions. Despite the modest increase in VMT projected on I-5, the highway improvements are also projected to reduce congestion on I-5, leading to decreases in travel times, VHT, and VHD; additional decreases are also projected in both VMT and ADT on parallel local arterials Coast Highway and El Camino Real. All of these factors positively influence congestion-related vehicle emissions and will help to offset the projected increase in I-5 VMT. Compared to the No Build Alternative, the specific congestion-related benefits include:
- A reduction of 25-35% in peak-period corridor travel times on I-549
- A reduction of 4% in VHT on I-550
- A reduction of 47% in VHD on I-551
- Reductions of 12% and 3% in ADT on Coast Highway and El Camino Real, respectively52
- A decrease in the duration of daily peak-period congestion on I-5 from a range of 12 to 13 hours to a range of 5 to 6 hours53
Corridor mean travel times under current and future conditions during peak periods are shown in Table 5.1-4. When I-5 is uncongested, it takes 23-25 minutes to traverse the 27-mile route from La Jolla Village Drive in San Diego to Harbor Drive in Oceanside. In the PM peak period, this same northbound trip takes 34 minutes and is expected to take a congestion-ridden 70 minutes by 2040 without any improvements to the highway. Even with the planned improvements, travel time for this trip in 2040 is projected to be 45 minutes in the general-purpose lanes, indicating that the improvements would not even keep up with projected growth in demand (but would be vastly better than the No Build Alternative).
| Time/ Direction | 2010 | 2040 No-Build |
2040 General-Purpose Lanes |
2040 Express Lanes |
|---|---|---|---|---|
| Northbound AM Peak Period | 23 | 37 | 26 | 24 |
| SouthboundAM Peak Period | 36 | 54 | 36 | 24-26 |
| Northbound PM Peak Period | 34 | 70 | 45 | 28 |
| SouthboundPM Peak Period | 34 | 40 | 30 | 24-25 |
A large portion of the existing freeway facility is at capacity during the peak periods; thus, the projected 17% to 29% increase in VMT on I-5 under the No-Build Alternative can be accommodated only by extending the duration of the peak periods. On most highways, peak-period congestion applies to a single direction of travel, such as a morning peak period heading into downtown or an afternoon peak period heading out of downtown. Southbound I-5, however, experiences two peak periods during the day. Congestion occurs for an average of five hours per day in both the southbound and northbound directions.
By 2040 under the No-Build Alternative, congestion will expand significantly as compared to 2010 conditions, to the extent that the entire length of the corridor in both directions is projected to experience severe congestion and traffic delay during the peak periods. In addition, if no improvements are made to I-5, forecasts indicate that the projected increases in average daily traffic will extend the duration of congestion in both the northbound and southbound directions (i.e., longer peak periods). In 2006, congestion lasted an average of 5-6 hours in both the north- and southbound directions. By 2030, if no improvements are made to I-5, congested travel hours will more than double, with projected northbound congestion extending to 9-10 hours and southbound congestion extending to 13 hours each day.54 This would lead to drastic increases in VHD, negatively influencing energy consumption and air emissions in the corridor. By contrast, the planned improvements to I-5 would reduce this projected VHD by 47% (Figure 5.1-6).
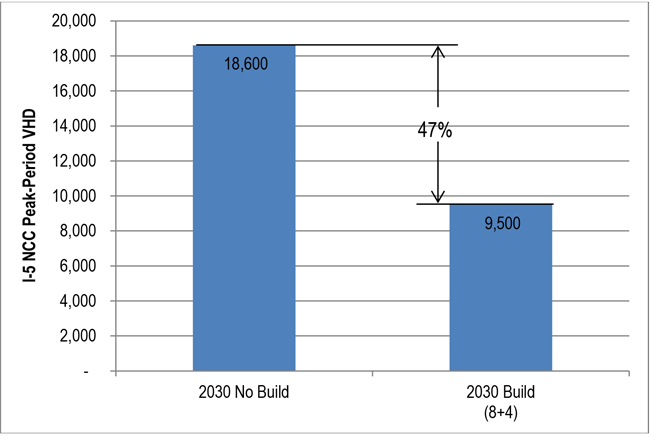
Source: San Diego NCC-CSMP (Chapter 8), August 2010.
Strategies to Reduce Highway Energy Consumption and Emissions
The projected increase in I-5 NCC VMT between the No-Build and the Build Alternatives for the proposed project is relatively small (approximately 4.0% to 9.9%) and, as stated previously, is less a result of induced demand (i.e., new trips created), and more a result of latent demand (i.e., improved access) and a shifting of travel from the parallel arterials of Coast Highway and El Camino Real to I-5, as travel becomes more reliable on I-5 and "spillover" traffic on local roads is minimized. To further minimize growth in VMT, the region has designed a number of regional and project strategies/improvements to encourage options for the use of single-occupant vehicles. These improvements include the following:
- Proposed community enhancements include 23 miles of bike and pedestrian facilities designed to significantly expand and improve the functionality of the existing bicycle and pedestrian system.
- The Express Lane system is designed to provide a competitive option to single-occupant vehicles by ensuring a reliable, congestion-free travel option throughout the corridor for carpools, vanpools, and buses. In doing so, the corridor would move more people per VMT.
- The Express Lane system includes a congestion-pricing element, designed to allow solo drivers to use the Express Lanes only by paying a fee, using the region's FasTrak® electronic transponder system. Fee revenue generated through FasTrak® would further support transportation services.
- In addition to the construction of the Express Lanes, the NCC program includes the expansion of commuter rail services. Much like the Express Lanes, these improvements are designed to provide a competitive option to single-occupant vehicles.
- A three-pronged TDM strategy includes outreach, education, and incentives to reduce solo driving through improved vanpools, carpools, telework, and bicycle programs.
- SANDAG is working to minimize urban sprawl through the implementation of the SCS and Smart Growth, including a focus on Smart Growth near rail stations in the NCC.
The PWP/TREP also includes a number of operational and TSM improvements (e.g., ramp meters, vehicle detection, and changeable message signs), designed to maximize the efficiency of the existing system and to provide improved traveler information. These key project elements would improve air quality by reducing overall congestion levels and further minimizing the impact of added VMT.55
Temporary Construction Impacts
Construction emissions result from material processing, emissions created by on-site construction equipment, and emissions arising from traffic delays caused by construction. These emissions will be produced at different levels throughout the construction phase; their frequency and occurrence can be reduced through innovations in plans and specifications, selection of lower-emitting construction equipment, and by implementing better traffic management during construction phases. In addition, with innovations such as longer pavement lives, improved traffic management plans, and changes in materials, the GHG emissions produced during construction can be mitigated to some degree by longer intervals between maintenance and rehabilitation events.56
Construction activities such as the use of heavy equipment, detours, lane closures, the import and export of materials and equipment, and other activities could substantially increase energy consumption. To the extent feasible, measures to reduce energy consumption would be implemented during construction of the proposed improvements.57
Construction of the proposed NCC transportation improvements would result in a temporary addition of pollutants to the local airshed caused by soil disturbance, dust emissions, and combustion pollutants from on-site construction equipment, as well as from off-site trucks hauling construction materials. Specifically, construction activities associated with segment widening, mainline bridge construction, and overcrossing/under crossing construction would generate air pollutants and GHG emissions. Construction emissions can vary substantially from day to day, depending on the level of activity, the specific type of operation, and, for dust, the prevailing weather conditions.
The principal criteria pollutants emitted during construction would be PM10 and PM2.5. The source of the pollutants would be fugitive dust created during clearing, grubbing, excavation, and grading; demolition of structures and pavement; vehicle travel on paved and unpaved roads; and material blown from unprotected graded areas, stockpiles, and haul trucks.58 A secondary source of pollutants during construction would be the engine exhaust from construction equipment. The principal pollutants of concern from these engines would be NOX and VOC emissions that would contribute to the formation of O3, which is a regional nonattainment pollutant.
Site preparation and roadway construction typically involve clearing, cut-and-fill activities, grading, removal of or improvement to existing roadways, and paving of roadway surfaces. Construction-related effects on air quality from proposed highway improvements would be greatest during the site preparation and demolition phases, which involve excavation, handling, and transport of soils to and from the site. These activities could temporarily generate PM10 and PM2.5. Sources of fugitive dust would include disturbed soils at the construction site and trucks carrying uncovered loads of soils. Unless properly controlled, vehicles leaving the site could deposit mud on local streets, which could be an additional source of airborne dust after it dries. PM10 emissions would vary from day to day, depending on the nature and magnitude of construction activity and local weather conditions. PM10 emissions would depend on soil moisture, silt content of soil, wind speed, and the amount of equipment operating. Larger dust particles would settle near the source, while fine particles would be dispersed over greater distances from the construction site.
In addition to dust-related PM10 emissions, heavy-duty trucks and construction equipment powered by gasoline and diesel engines would generate CO, SO2, NOX, VOCS, and some soot particulate (PM10 and PM2.5) in exhaust emissions. If construction activities were to increase traffic congestion in the area, CO and other emissions from traffic would increase slightly while those vehicles are delayed. These emissions would be temporary and limited to the immediate area surrounding the construction site.
Minimal air quality impacts could also occur from the construction of the proposed community enhancement projects. Construction of the majority of the community enhancements would occur within the project's construction footprint and these were accounted for within the construction emissions budget. Grading, paving, and landscaping for these features would be accomplished in conjunction with the freeway project.59 (Refer to Chapter 4 for a list of community enhancements and bicycle and pedestrian facilities.)
Emissions from the construction phase of the project were estimated through the use of emission factors from the Sacramento Metropolitan Air Quality Management District's (SMAQMD) Road Construction Model Version 6.3.2,60 which was released in July 2009 and was the most recent version when the analysis was performed.61 Assumptions in the Draft Air Quality Analysis for the I-5 NCC Project, prepared in 2007, were used when running the Road Construction Model Version 6.3.2, with the exception of start date, which was assumed to be 2010 to represent a conservative anticipated first year of construction, corresponding with the first year of the initial phase (2010-2020) of project implementation. The modeled bridge construction scenario assumed a project length of 0.036 miles and an area of 4.3 acres, constructed during a 12-month period. Daily maximum area disturbed was assumed to be 0.9 acres per day, and no soil import or export haul truck trips would be made. The modeled roadway widening scenario assumed a project length of 1.3 miles and an area of 28 acres, also constructed within a 12-month period. For this scenario, daily maximum area disturbed was assumed to be 4.6 acres per day and that 4,000 cubic yards per day of import would occur, resulting in 200 roundtrip haul truck trips per day. For the purposes of estimating emission, construction phasing for both the bridge construction and roadway widening model scenarios consisted of the following assumptions: grading/land clearing (1.2 months), grading/excavation (5.4 months), drainage/utilities/ sub-grade (3.6 months), paving (1.8 months). Estimated maximum daily and annual construction emissions of VOC, NOX, CO, PM10, and PM2.5 generated during construction of the bridge construction scenario and the roadway widening scenario are presented in Table 5.1-5A and 5.1-5B.
| Improvement | VOC | NOX | CO | PM10 | PM2.5 |
|---|---|---|---|---|---|
| Bridge Construction | 4.3 | 36.5 | 19.4 | 10.8 | 3.5 |
| Roadway Widening | 30.9 | 239.3 | 308.3 | 55.7 | 18.0 |
| Improvement | VOC | NOX | CO | PM10 | PM2.5 |
|---|---|---|---|---|---|
| Bridge Construction | 0.5 | 4.2 | 2.2 | 1.2 | 1.0 |
| Roadway Widening | 2.2 | 16.5 | 19.7 | 5.9 | 1.7 |
Construction emissions are assessed against the federal general conformity de minimis thresholds, which are used to determine conformity of a federal action with existing air quality plans. The de minimis threshold for CO in an area under a maintenance plan is 100 tons per year. The de minimis thresholds for O3 (8-hour) moderate nonattainment are 100 tons per year for both NOX and VOC. The de minimis threshold for PM10 nonattainment is 100 tons per year. Although the SDAB is not a federal nonattainment or maintenance area for PM10, it is a state nonattainment area; therefore, use of this limit would represent a conservative threshold.62
Construction of the proposed project would also result in GHG emissions, which are primarily associated with use of off-road construction equipment and vehicles and on-road construction and worker vehicles. The SMAQMD Road Construction Model Version 6.3.2 was used to calculate the annual CO2 emissions based on the construction scenario used in the 2007 Draft Air Quality Analysis for the I-5 NCC Project. The model results were adjusted to estimate CH4 and N2O emissions in addition to CO2. The CO2 emissions from off-road equipment and on-road trucks, which were assumed by the Road Construction Model to be diesel-fueled, were adjusted by factors derived from the relative CO2, CH4, and N2O for diesel fuel used in off-road equipment and on-road trucks as reported in the California Climate Action Registry's (CCAR) General Reporting Protocol63 for transportation fuels and the GWP for each GHG. The CO2 emissions associated with construction worker trips and vendor trips were multiplied by a factor based on the assumption that CO2 represents 95% of the CO2E emissions associated with passenger vehicles.64 The results were then converted from annual tons per year to metric tons per year.
Table 5.1-6 presents estimated annual GHG construction emissions for the two construction scenarios in the representative year (2010) from on-site and off-site emission sources. As shown, annual estimated total GHG emissions during bridge construction would be 365 metric tons of CO2E in 2010. Annual estimated total GHG emissions during road widening construction would be 1,764 metric tons of CO2E in 2010. Within the road widening component, emissions generated by haul trucks would result in the greatest contribution of construction GHG emissions, generating approximately 1,333 metric tons of CO2E.
| Improvement | Tons CO2 | Metric Tons CO2E (Carbon Dioxide Equivalent) |
|---|---|---|
| Bridge Construction | 399 | 365 |
| Roadway Widening | 1,938 | 1,764 |
As previously stated, the I-5 NCC highway improvements are included in the 2050 RTP/SCS transportation network improvements phased project list; therefore, the I-5 NCC improvements and associated emissions were analyzed in the 2050 RTP/SCS EIR. The 2050 RTP/SCS EIR estimated annual construction emissions from construction activities, including worker vehicle trips, transport of materials to and from the construction site, and operation of construction equipment. Annual construction emissions due to regional growth/land use change were estimated based on the proportion of development was estimated for each time period based on forecasted housing units and jobs and average annual emissions. Annual construction-related GHG emissions associated with implementation of 2050 RTP transportation network improvements would vary depending on the number and types of projects occurring in a given year. However, based on the 2050 RTP phased project list for 2020, 2035, and 2050, the number of miles and acres of transportation-related construction that could be reasonably expected for each year were estimated and "average" annual construction was modeled. Estimated average annual CO2E emissions generated during construction of forecasted improvements based on projected miles and acreage is provided in Table 5.1-7.
| Source Category | 2010-2020 | 2021-2035 | 2036-2050 |
|---|---|---|---|
| Total Miles | 977 | 314 | 244 |
| Miles/Year | 98 | 21 | 16 |
| Total Acres | 3,975 | 1,242 | 775 |
| Acres/Year | 398 | 83 | 52 |
| MT CO2E/Year | 9,683 | 6,415 | 6,206 |
As shown in Table 5.1-7, average annual construction GHG emissions from implementation of the 2050 RTP transportation network improvements would be 9,683 metric tons of CO2E per year from 2010-2020, 6,415 metric tons of CO2E per year from 2021-2035, and 6,206 metric tons of CO2E per year from 2036-2050. As the project is included in the 2050 RTP, construction of the PWP/TREP improvements would be required to implement mitigation measures included in the 2050 RTP EIR. Applicable measures outlined in the 2050 RTP EIR, such as employing alternative fueled vehicles and recycling construction debris, are incorporated as design/development strategies in Section 5.1.3.3.
5.1.2.3 Regional Impact Assessment
Regional Vehicle Miles Traveled
While I-5 NCC VMT is projected to be 4.0% to 9.9% greater under the Build Alternative than the No-Build Alternative, the fact that VMT is projected to decrease on major parallel roadways underscores the beneficial role that I-5 Express Lane improvements will play in the broader NCC transportation network. These transportation network benefits can be extended to the role of the NCC improvements in the region. Achieving regionwide VMT reductions is a key part of SANDAG's multimodal Express Lanes strategy. NCC transportation improvements are just part of the larger regional multimodal system of improvements planned for in the 2050 RTP. As shown in Table 5.1-8, implementation of the I-5 NCC improvements has little impact on regionwide VMT in 2040, resulting in just 1.6% greater regional VMT than without the project. This negligible increase is more than offset by the more efficient travel (reduced travel times, periods of congestion and VHD) resulting from the I-5 NCC improvements, which is a primary indicator of reductions in energy consumption and air emissions. Furthermore, the difference between the 2010 baseline (existing conditions) and the RTP Build Alternative in 2040 is 29.4 million VMT per day (or approximately a 35% increase), which corresponds with the projected regional population increase through 2040. As discussed in Chapter 3A, since 1970 VMT has historically grown at a faster rate than the population. The projected parallel trends in VMT and population growth through 2040 appears to indicate that the region's multimodal transportation program combined with regional strategies to reduce VMT will be successful in minimizing growth in VMT.
| Existing (2010) |
No-Build (2040) |
No-Build Percent Change from Existing |
I-5 NCC Build (2040) |
I-5 NCC Build Percent Change from No-Build |
|
|---|---|---|---|---|---|
| Regional Daily VMT | 82.86 | 110.44 | 33.3% | 112.21 | 1.6% |
On a regional and systemwide basis, implementation of the transportation projects in the 2050 RTP will result in lower VMT per capita than the 2050 RTP No Build Alternative. The 2050 RTP contains the proposed PWP/TREP improvements, including I-5 HOV/Express Lanes in the NCC, which are key links in the regional multimodal network. As shown in Table 5.1-9, a 5.5% decrease in per capita regional VMT is projected if all transportation projects in the RTP, including the PWP/TREP, are implemented. The regional analysis demonstrates the potential energy savings that can be derived from a systemwide, multimodal approach to transportation improvements (combined with local and regional land use policies that concentrate growth in already developed areas) as identified in the 2050 RTP.
| Existing (2010) |
No-Build (2050) |
No-Build Percent Change from Existing |
2050 RTP (Inc. I-5 NCC Improvements) |
2050 RTP Percent Change from No-Build |
|
|---|---|---|---|---|---|
| Regional Daily VMT/Capita | 24.20 | 26.69 | 10.3% | 25.23 | -5.5% |
The improvements in the PWP/TREP will contribute significantly to the projected regional increase in HOV and transit-mode share from 2010 to 2050. As the region's HOV/Express Lane network is completed, HOV use in the region is anticipated to grow, with carpooling increasing by 48% as a commuting method.65 In addition, the transit-commute mode share for the region's urbanized area (which includes most of the NCC) is projected to increase from 5.2% to over 10% with the 2050 RTP and PWP/TREP improvements.66
Thus, fewer regional VMT per capita, combined with larger regional HOV and transit-mode shares and reduced VHT would translate into improved energy conservation and reduced energy consumption when compared to the No-Build Alternative.
The 2050 RTP, which includes the proposed program of multimodal transportation improvements in the NCC, is expected to improve energy conservation and reduce emissions compared with the No-Build Alternative and compared with existing conditions. Implementation of 2050 RTP transportation improvements would improve air quality, and on a per-capita basis, GHG emissions will be reduced and less transportation fuel will be consumed compared to the No-Build Alternative.67
Implementing the 2050 RTP will also result in dramatic shifts in how San Diego commuters get to work and how long it will take. By 2050, the percentage of commutes in which people drive alone during peak periods will fall from 81% to 69%. The percentage of commuters who use public transit will nearly double (from 6% in 2008 to 11% in 2050). Meanwhile, the percentage of commuters who bicycle or walk to work will almost double (from 2.5% to 4.8%). These shifts in how San Diego commuters get to work during peak periods may seem small, but they can significantly reduce congestion and make travel faster.68 Additionally, a higher percentage of these trips will last no more than 30 minutes, even during peak periods of demand when most people are commuting. Seven out of 10 trips are expected to take 30 minutes or less, whether driving alone or carpooling. About 14% of public transit trips to work and higher education will last 30 minutes or less, compared with only 8% under the No-Build Alternative.69 Compared with the No-Build Alternative, the 2050 RTP would result in a transportation network that improves travel conditions and air quality and promotes an equitable distribution of benefits.
The 2050 RTP includes a network that integrates many modes of transportation, with a mix of projects and a wide variety of transportation choices distributed across the region. This multimodal network is expected to promote a substantial increase in carpooling, demands for public transit, and bicycling and walking for work trips both during peak hours and at other times. The 2050 RTP contains the largest investment in bicycle and pedestrian infrastructure of any San Diego RTP to date. These investments will result in significant increases in bicycle and walking trips (a 120% increase, compared with the No-Build Alternative).70 The percentage of work trips made by walking, bicycling, and taking public transit will slightly more than double. Nearly one out of three commutes will be made using modes of transportation other than driving alone. By contrast, less than one out of five trips in the No-Build Alternative will turn away from driving alone. Under the 2050 RTP, vehicle miles per capita will also be reduced by 5%, while daily travel by transit will double compared to the No-Build Alternative.71
The 2050 RTP's transportation infrastructure, including the I-5 NCC improvements, will also help reduce congestion for autos, trucks, and public transit. The percentage of peak-period auto travel occurring during congested periods is projected to drop from 27.7% under the No-Build Alternative to 17.2% under the 2050 RTP. Similarly, congested conditions for peak-period transit travel are projected to drop by nearly half (from 9.1% to 5.1%) under the 2050 RTP. The number of hours of delay per day for trucks will also be cut in half (from 32,300 hours to 16,000 hours) with the implementation of the 2050 RTP. Regional air quality is also expected to improve in the future. Cleaner fuels and new vehicle technologies will help reduce the majority of smog-forming pollutants.72
Regional GHG Emissions Estimates
SANDAG Regional Transportation Model. Although VMT is anticipated to slightly increase regionwide, VHT would decrease because of reduced congestion, resulting in an associated reduction in vehicle-generated pollutant emissions. The Series 10 SANDAG regional transportation model was used to develop a 2005 baseline for emissions for the entire region, which was estimated to be 44,550 tons of CO2 per day. It was projected that in 2030, the NCC 8+4 Build Alternative emissions would be 59,280 tons of CO2 per day, which is 780 tons per day (1.3%) less than the No Build Alternative emissions estimate for the entire region of 60,060 tons of CO2 per day.
A similar analysis was done using the Series 11 model, which estimated a 2006 baseline of 44,940 tons of CO2 per day. The 2030 8+4 Build Alternative was estimated to generate 63,920 tons of CO2 per day, which is 340 tons of CO2 per day (0.5%) less than the 2030 No Build estimate of 64,260 tons of CO2 per day. The Series 12 model estimated that in 2035, the 8+4 Build Alternative would generate 55,300 tons of CO2 per day, while the No-Build Alternative would generate 56,090 tons of CO2 per day. As such, the 8+4 Build Alternative would generate 790 tons of CO2 per day (1.4%) less than the No Build Alternative in 2035, resulting in a reduction in regional GHG emissions compared to the No-Build Alternative conditions.
Since the emissions modeling software is currently limited to generating output only for freeway mainlines, and not local streets, the above analysis does not reflect any reduction in GHG emissions that could result from reduced queue lengths at ramp meters and intersections. Because the proposed project would reduce delays at these locations, there is the potential for further reduction in GHG emissions from vehicles spending less time idling. Accordingly, the reduction of congestion would partially offset the increase in VMT caused by the project compared to the No-Build Alternative conditions. Based on the model analysis described above, the project would not result in additional trips at a regional level, but would likely rearrange them to focus on the facility with increased capacity. Therefore, the project is not anticipated to appreciably affect GHG emissions on a regional level.
Truck volumes in the region currently range from 9,000 to 10,345, which equates to 4%-6% of the overall traffic volumes. At a basic level, the Series 12 model also forecasts truck VMT. The Series 12 model shows a 2010 baseline of 3.6% of traffic (VMT) to be truck traffic but forecasts that it would increase to 4.5% by 2040. Truck-related VMT is not anticipated to change with or without the 8+4 I-5 highway improvement at a regional level. At a corridor level, the difference between the 2040 Build Alternative (708,000 VMT) and the 2040 No-Build Alternative (683,000 VMT) is estimated to be 3.5%. Based on VMT, existing truck travel represents 6.8% of 2010 travel and 10.5% of 2040 travel in the corridor. Regardless of transportation improvements, an increase in truck travel in San Diego and along I-5 would occur over time. Accordingly, although an increase in vehicle and truck travel could occur on a regional and/or corridor level, the project is not anticipated to substantially increase trips or VMT in the San Diego region.
California Emissions Projection Analysis Model. CARB has developed the California Emissions Projection Analysis Model (CEPAM), which is a database that estimates population and vehicle trends. This tool, formerly called California's Emission Forecasting System, provides data for the human population, vehicle population, annual VMT, and fuel usage for the years 1980 through 2020. It also provides criteria pollutant emissions measured in tons per day in 5-year increments starting in 1975 through 2020, as well as 2008 as the base year, since the most recent CEPAM Almanac was in 2009.
Emissions for VOC, NOX, CO, SOX, PM10, and PM2.5 for years 2000, 2005, 2008, 2010, 2015, and 2020 were gathered from the inventory and are provided in Table 5.1-10 . As shown, there has been a steady decrease in VOC, NOX, and CO emissions, with reductions ranging from 16% to as much as 35%, over each 5-year increment. Emissions of SOX dropped substantially from 2000 to 2005, but then nearly stabilized from 2005 to 2020. Emissions of PM10 and PM2.5 fluctuated from 2000 to 2020, decreasing between some data intervals and increasing between others. Particulate matter is largely a result of fugitive dust emissions from a vehicle traveling on paved and unpaved roads, and total emissions would not substantially decrease with increased vehicle efficiency.
Table 5.1-10 also displays trends for the San Diego County, including average annual population, average annual total vehicles, average VMT per day, and average daily vehicle fuel consumption. Both the population and number of vehicles increased noticeably between 2000 and 2005 (8% and 15%, respectively) and then continued to increase from 2005 to 2020, but at a lower rate. VMT and vehicle fuel consumption also reduced noticeably from 2000 to 2005 (18%), but fluctuated in the following years reported.
Over the 20-year period–from 2000 to 2020–reactive organic gas decreased 70%, NOX decreased 67%, CO decreased 75% and SOX decreased 42%. PM2.5 decreased 1%; however, PM10 increased 5%. Contrary to the general decrease in emissions from 2000 to 2020, the annual population increased by 25%, the annual vehicle population increased by 37%, daily VMT increased 30%, and daily vehicle fuel consumption increased 27%. Looking at it from a narrower scope, between base year 2008 to 2015, reactive organic gas decreased 33%, NOX decreased 37%, CO decreased 75%, PM10 decreased 3%, and PM2.5 decreased 6%; SOX increased by 4%. Conversely, growth trends increased during this period: from 2008 to 2015, the population increased by 7%, the number of vehicles increased by 9%, VMT increased 5%, and vehicle fuel consumption increased 3%. In summary, over the years reported in Table 5.1-10A and 5.1-10B, there was a general decrease in emissions despite the increase in population and VMT growth.
| Pollutant | 2000 | 2005 | 2008 | 2010 | 2015 | 2020 |
|---|---|---|---|---|---|---|
| VOC | 96.2 | 62.6 | 51.0 | 44.5 | 34.4 | 28.8 |
| NOX | 145.5 | 113.1 | 100.5 | 87.9 | 63.6 | 48.0 |
| CO | 1,007.1 | 656.8 | 531.2 | 456.2 | 327.4 | 250.6 |
| SOX |
0.91 |
0.92 | 0.48 | 0.48 | 0.50 | 0.53 |
| PM10 | 5.21 | 5.52 | 5.60 | 5.47 | 5.41 | 5.48 |
| PM2.5 | 3.80 | 3.92 | 4.00 | 3.88 | 3.77 | 3.76 |
| Trend | 2000 | 2005 | 2008 | 2010 | 2015 | 2020 |
|---|---|---|---|---|---|---|
| Population (total number of people) |
2,836,477 | 3,051,175 | 3,146,627 | 3,199,706 | 3,375,210 | 3,550,714 |
| Vehicles (total number of vehicles) |
1,930,480 | 2,229,140 | 2,288,870 | 2,329,640 | 2,486,590 | 2,654,130 |
| Vehicle Miles Traveled (thousands of miles/day) |
74,567 | 87,944 | 87,022 | 86,948 | 91,223 | 96,987 |
| Vehicle Fuel Consumption (thousands of gallons/day) |
4,356 | 5,159 | 5,067 | 5,033 | 5,244 | 5,538 |
There are many factors that could contribute to a decrease in emissions despite an increase in population and VMT. Advances in vehicle efficiency and improvements to transportation efficiency would reduce emissions. Fuel efficiency standards for vehicles resulting in improved fuel economy, state-of-the-art emission control technologies, and alternative and new, lower-carbon fuels would reduce fuel consumption and associated vehicular emissions. Regional transportation efficiency would increase by reducing VHT and increasing speed, thus, reducing congestion and associated vehicle emissions. In addition to improved congestion and reduced vehicle delay, the project would also encourage the use of public transit services and higher persons per vehicle through HOV lanes, BRT, and park-and-ride facilities; provide alternatives to vehicular travel with pedestrian and bicycle facilities; and utilize intelligent transportation systems. These facilities, improvements, and strategies would reduce demand on the regional transportation system, reduce SOV travel, and reduce VMT, which would partially offset the increase in persons and vehicles.
As illustrated in Table 5.1-10 and described above, between 2008 and 2015, the population and the number of vehicles increased at a higher rate than VMT and fuel consumption. Although these trends fluctuated from 2005 through 2020, in general, the population growth rate was greater than the growth rates for VMT and fuel consumption. The depressed state of the economy, which was realized both nationally and locally, has influenced travel in recent years–may it be in the form of fewer home-to-work trips, less leisure travel, or less truck transport of goods. Nonetheless, a VMT growth rate less than a population growth rate indicates a potential that transportation improvements, such as the ones proposed, have and would continue to slow an otherwise consistent regional increase in VMT. In addition, in most comparisons between the years reported (in 5-year intervals), fuel consumption growth was at a lower rate than VMT growth. This supports the notion that advances in vehicle technology and increased vehicle efficiency would result in reduced fuel consumption and associated emissions.
As discussed in Section 5.1.1.2, in 2010 CARB set specific targets for reducing GHG emissions for cars and light trucks for each of the state's regions from a 2005 base year as part of its mandate under SB 375. The GHG targets set for the San Diego region call for a 7% per-capita reduction by 2020 and a 13% per-capita reduction by 2035. The San Diego region will meet or exceed these targets by, among other means, using land in ways that make developments more compact, conserving open space, and investing in a transportation network that gives residents transportation options.73 The proposed improvements would assist in achieving these targets through increases in both HOV travel and transit ridership. The PWP's investments in Express Lanes, LOSSAN rail improvements, and transit service enhancements directly contribute to these objectives and are key components of SANDAG's overall strategy to meet the legal mandate. The 2050 RTP for the San Diego region would result in GHG emission reductions that exceed the state's targets for 2020 and meet them for 2035. It would result in a 14% reduction in emissions by 2020 and a 13% reduction by 2035.74
The 2050 RTP/SCS encourages growth to occur in areas of existing urban development, and near existing and planned transit corridors. In addition, it encourages higher-intensity residential and commercial development. These strategies would increase energy efficiency and encourage the use of transit services. However, the amount of new development and redevelopment needed to accommodate expected growth would lead to more GHG-emitting sources.75
GHG emissions associated with land use in the SANDAG region were forecast to 2035 by the University of San Diego's Energy Policy Initiatives Center. Activities that are not related to regional land use planning, such as civil aviation, waterborne navigation, and industrial process, are not included. The 14% population and 12.1% jobs increase from 2020 to 2035 would lead to greater sources for GHG emissions, including residential units, commercial sources, and waste. The total land use-based GHG emissions in 2035 are projected to be 19.93 million metric tons of CO2E, or 37% greater than GHG emissions in 2010 (14.53 million metric tons of CO2E).76
As the corridor improvements conformity with the State Implementation Plan analysis is conducted for the region, it does not include an analysis of local CO or Mobile Source Air Toxins (MSATs) at the project level. Although emissions are predicted to increase concurrently with the increase in VMT on I-5, detailed CO hotspot analysis completed for the region, which included select intersections in the NCC, concludes that the proposed project's future traffic conditions would not exceed federal and state 1- or 8-hour standards for CO during the AM or PM peak periods at any of the analyzed intersections.77 All other intersections in the project area are predicted to experience less delay time and improved operating conditions. As a result, the proposed project would not result in or contribute to any significant local air quality impacts due to future operations and is considered to be satisfactory for local CO impacts.78
Based on the federal and state guidelines for analysis of the particulate matter, the improvements to I-5 are not defined as a project of air quality concern as the project seeks to relieve congestion, improve operations, and provide better circulation.79
Modeling of six MSAT emissions for the I-5 project indicates a substantial decrease in emissions of these toxics between existing conditions and 2030 for both the No-Build and the proposed project. The proposed project would result in a slight increase in VMT on I-5 when compared to the No-Build Alternative; however, the No-Build Alternative would accommodate fewer vehicles, including HOVs and BRTs, thereby increasing congestion and resulting in a breakdown of travel speeds and increased emissions caused by the idling vehicles. The proposed project would reduce congestion and travel time and associated air emissions otherwise caused by idling vehicles.80 Additionally, the EPA has issued a number of regulations that will dramatically decrease MSATs through cleaner fuels and cleaner engines. According to a Federal Highway Administration analysis, even if the number of VMT increases by 64%, reductions of 57% to 87% in MSATs are projected from 2000 to 2020.81
Diesel emissions are typically generated from construction vehicles during the construction phase, as well as some diesel emissions from trucks during the operational phase. Diesel exhaust is mainly composed of particulate matter and gases, which contain potential cancer-causing substances. Emissions from diesel engines currently include over 40 substances that are listed by the EPA as hazardous air pollutants and by CARB as toxic air contaminants. On August 27, 1998, CARB identified particulate matter in diesel exhaust as a toxic air contaminant, based on data linking diesel particulate emissions to increased risks of lung cancer and respiratory disease. In September 2000, CARB adopted a comprehensive diesel risk reduction plan to reduce emissions from both new and existing diesel-fueled engines and vehicles: Risk Reduction Plan to Reduce Particulate Matter Emissions from Diesel-Fueled Engines and Vehicles and the Risk Management Guidance for the Permitting of New Stationary Diesel-Fueled Engines. The goal of the plan is to reduce diesel particulate matter emissions and the associated health risk by 75% in 2010 and by 85% by 2020.82 Since 2000, CARB has adopted several Airborne Toxic Control Measures to reduce emissions from fleets of off-road diesel vehicles and heavy-duty truck fleets.
5.1.3 PWP/TREP Opportunities, Design/Development Strategies, and Policies/Implementation Measures
5.1.3.1 Corridor Opportunities
Addressing energy, air quality, and GHG emissions in the NCC while also accommodating the projected growth in travel demand and achieving better coastal access requires a comprehensive approach to the transportation system. As discussed in Chapter 3, the strategy to maintain mobility and access in the NCC includes a multimodal transportation program that both accommodates projected growth, including the large volumes and diversity of trips in the corridor, and encourages alternatives to SOV travel. While rail improvements provide one component of the multimodal system, the multimodal transportation approach also has its foundation in SANDAG's regional highway strategy, detailed in the RTP, which focuses on a system of Express Lanes throughout the region.
The LOSSAN rail corridor in the NCC includes a program of projects to expand capacity, improve performance, and enhance access. These projects are described in detail in Chapter 4 and would include the following:
- Double-track projects to reduce and eliminate single-track segments to increase capacity and reliability, and reduce travel time
- Trackwork improvements for increased operations and reliability
- Bridge replacements to improve the safety of existing services
- Expansion of parking at, adjacent to, or in close proximity to rail stations to enhance access
- Additional funded transit connections that encourage alternatives to parking at rail stations
The planned improvements would:
- Allow the COASTER to operate with 20-minute peak-period frequency, which would result in as many as 54 trains per day versus the 26 trains per day under existing conditions (including weekend and off-peak service);
- Make it easier and more convenient for park-and-ride passengers to access stations; and
- Increase COASTER ridership from 6,000 to 12,900 passengers per day, with capacity to accommodate up to 35,000 (47,000 across all corridor rail services).83 This potential capacity equates to more than two lanes of traffic being diverted from I-5 during the peak period.84
In addition to infrastructure and operational improvements along the rail corridor, the NCC contains more than a dozen planned and potential Smart Growth areas, located mostly near the LOSSAN rail corridor stations as well as populated areas of the local cities.85 Implementing proposed improvements in the LOSSAN rail corridor presents multiple opportunities to reduce energy use and improve air quality. New infrastructure would reduce delays and therefore reduce energy consumption and emissions from idling locomotives. Investment in the rail corridor would enable increased frequencies and reduced travel times, which, along with Smart Growth development at stations, would be expected to more than double ridership on LOSSAN rail corridor passenger services between 2008 and 2040. Higher rail ridership would mean fewer automobile trips in the corridor and corresponding decreases in auto energy consumption and emissions. While an increase in locomotive miles would lead to an increase in overall energy use and associated air emissions, reductions in train idling time, as well as a shift in mode share from SOVs to commuter and intercity rail, would partially offset such growth. In addition, improvements in locomotive air pollution controls and new lower-emission, high-efficiency vehicles would result in continued reductions of pollutant emissions and energy use.
The proposed NCC highway improvements would incorporate the following multimodal opportunities by providing Express Lanes and highway-capacity improvements that would:
- Primarily accommodate carpools, BRT, and vanpools that move more people, not necessarily more vehicles.
- Reduce congestion and travel delays, providing free-flow travel, particularly on the Express Lanes, which, in turn, reduce VHT and emissions.
- Encourage carpooling, vanpooling and transit use by providing the appropriate facilities to reduce delays and make these alternatives modes more time competitive with driving on highway general-purpose lanes.
5.1.3.2 PWP/TREP Policies
Caltrans/SANDAG would implement the following policy to ensure that proposed improvements are designed, implemented, and maintained to reduce energy use, improve air quality, and minimize GHG emissions:
Policy 5.1:
New highway, rail station, bicycle, and pedestrian improvements, and associated community enhancements shall seek to minimize increases in energy consumption, VMT, and person-hours of travel, and be consistent with SDAPCD and CARB requirements. Where new development may potentially increase energy consumption or be inconsistent with air pollution requirements, appropriate mitigation measures shall be required and implemented as discussed in Sections 5.1.3.3 and 5.1.3.4.
5.1.3.3 PWP/TREP Design/Development Strategies
The following design/development strategies provide guidance for designing and implementing specific PWP/TREP rail projects, and Caltrans/SANDAG shall utilize the following design and development strategies for all projects subject to NOID procedures, consistent with the energy conservation and air pollutant emission reduction policies of PWP/TREP Policy 5.1, amended LCPs and the Coastal Act.
- Project-level analysis of potential energy and air quality impacts from improvements shall confirm proposed improvements will avoid substantial increases in energy use or emissions, as appropriate. Should project-level analysis find that previously unidentified permanent or temporary increases to energy use or emissions would result from proposed improvements, additional study and implementation of avoidance and/or mitigation measures will be needed to ensure project consistency with PWP/TREP Policy 5.1 and applicable Coastal Act policies.
- Where feasible, corridor design shall minimize grade changes in steep terrain areas to reduce the fuel consumed during vehicle and rail transportation (e.g., gasoline and diesel fuel).86
- Construction shall be subject to a construction energy conservation plan, where feasible.
- Best Management Practices for project-level emissions mitigation for proposed improvements shall be implemented to address the potential for regional and localized impacts.
- To minimize energy consumption, and in order to be consistent with SB 468, construction activities along the LOSSAN and I-5 transportation corridors shall be coordinated whenever possible.
- To minimize energy consumption during construction, public awareness campaigns to encourage carpooling and commuting during non-peak traffic hours shall be implemented.
- Encourage the use of innovative technologies to reduce the amount of cement (production is very energy intense) used in pavements and bridges, and yet have stronger, longer-lasting concrete.
- Best Available Control Technology shall be implemented during construction and operation of projects, and shall include the following:
- Solicit preference construction bids that use Best Available Control Technology.
- Employ use of alternative fueled vehicles.
- Create an energy conservation plan.
- Streamline permitting process to infill, redevelopment, and energy-efficient projects.
- Use the minimum feasible amount of GHG-emitting construction materials that is feasible.
- Recycle construction debris to the maximum extent feasible.
- Additional and/or new bicycle storage facilities (racks, locks, etc.) will be included in the improvements to existing park and ride and rail station improvements, if feasible.
5.1.3.4 Implementation Measures
Caltrans/SANDAG, as applicable, would utilize the following implementation measures for all projects subject to Notice of Impending Development (NOID) procedures:
Implementation Measure 5.1.1
Mitigation measures to minimize temporary construction impacts such as the emission of fugitive dust, PM10, and PM2.5, shall be implemented including:
-
Design and Construction requirements, which would:
- Minimize land disturbance.
- Use watering trucks to minimize dust; watering shall be sufficient to confine dust plumes to the project work areas.
- Suspend grading and earth moving when wind gusts exceed 25 mph unless the soil is wet enough to prevent dust plumes.
- Cover trucks when hauling dirt.
- Stabilize the surface of dirt piles if not removed immediately.
- Limit vehicular paths on unpaved surfaces and stabilize any temporary roads.
- Minimize unnecessary vehicular and machinery activities.
- Sweep paved streets at least once per day where there is evidence of dirt that has been carried on to the roadway.
- Revegetate disturbed land, including vehicular paths created during construction to avoid future off-road vehicular activities.
- Remove unused material.
- Compliance with Caltrans Standard Specification Section 14.9.03, or its future equivalent relating to Dust Control:87
- Prevent and alleviate dust by applying water, dust palliative, or both under Section 14-9.02 (Air Pollution Control) and by covering active and inactive stockpiles under Sections 13-4.03C(3) (Stockpile Management) and 14-9.02.
- Apply water under Section 17 (Watering).
- Apply dust palliative under Section 18 (Dust Palliative).
- If ordered, apply water, dust palliative, or both to control dust caused by public traffic.
Implementation Measure 5.1.2
Roadway system efficiency shall be improved by better managing the region's transportation resources and traveler information in order to minimize congestion, improve reliability and safety, and enhance the overall productivity of the transportation system by implementing the following measures:
- Placing Intelligent Transportation System informational gathering systems, such as closed-circuit television cameras and loop detectors, in order to gather, process, and disseminate information to the transportation system users. System improvements would be planned and installed in coordination with Caltrans design and landscape personnel to be consistent with the visual and biological resource policies contained within the PWP/TREP in order to ensure that the improvements would not adversely impact significant coastal resources or views.
- Including electronic communications, such as ramp meters, changeable message signs, and "511" - call in and web traveler service. Ramps meters and signs would be planned and installed in coordination with Caltrans design and landscape personnel to be consistent with the visual and biological resource policies contained within the PWP/TREP in order to ensure that the improvements would not adversely impact significant coastal resources or views.
- Providing incident responders such as Freeway Service Patrol to reduce traffic congestion by efficiently removing disable vehicles from the freeway, decreasing the potential for additional incidents caused by onlookers or the resulting stop-and-go traffic.
Implementation Measure 5.1.3
The project design of the NCC shall include greening and resource conservation, including:
- When installing new highway lighting and traffic signals as part of the construction, where feasible energy-efficient lighting and light-emitting diode (LED) traffic signals will be used;
- When removing existing highway lighting and traffic signals as part of the construction, where feasible they will be replaced with energy-efficient lighting and LED traffic signals;
- Incorporating sustainable landscaping and utilizing reclaimed water for irrigation where reclaimed water is available.
5.1.4 Coastal Act Consistency
Coastal Act Section 30253 provides for consistency with air pollution requirements and the minimization of energy consumption and VMT:
New development shall do all of the following:
(3) Be consistent with requirements imposed by an air pollution control district or the State Air Resources Board as to each particular development.
(4) Minimize energy consumption and VMT.
The Coastal Act requires that designing, implementing and operating new development within the Coastal Zone minimize energy consumption and VMT and that new development be consistent with air quality requirements, which includes restrictions on GHG emissions.
In summary, increasing traffic congestion under the No Build Alternative would result in conditions inconsistent with the air quality policies of the Coastal Act because they would exacerbate the nonattainment status of the SDAB. Implementing the PWP/TREP would include construction-phase best management practices (BMPs) to ensure project consistency with the requirements of the SDAPCD or CARB. Based on available project and environmental data and the policies and implementation measures included herein, the proposed PWP/TREP improvements would minimize energy consumption and VMT and would be consistent with the requirements of the SDAPCD or CARB. Energy consumption and VMT reduction would be achieved by focusing expected natural growth in travel on modes other than SOVs and by applying reasonable mitigation measures, and therefore the PWP/TREP is consistent with Section 30253 of the Coastal Act. Relative to the No-Build Alternative, the PWP/TREP improvements would provide substantial energy, air pollutant, and emissions benefits by reducing overall congestion and encouraging rail, transit and carpool use.
Analysis supporting this consistency determination is provided below.
5.1.4.1 SDAPCD and CARB Consistency
As stated previously, the SDAPCD is the regional air pollution control district that has jurisdiction over the proposed NCC improvements and CARB is the applicable state air quality agency. Implementing the PWP/TREP would include construction-phase BMPs to ensure project consistency with requirements of the SDAPCD or CARB. Table 5.1-11 presents applicable state and local laws, ordinances and standards that the PWP/TREP would comply with. In addition, mitigation measures included in the I-5 NCC Final EIR/EIS, LOSSAN Program EIR/EIS and the 2050 RTP/SCS EIR would be implemented during project construction and operation; these measures would comply with applicable SDAPCD rules and regulations. Construction and operation of proposed improvements would comply with SDAPCD and CARB requirements.
| Applicable Laws, Ordinances, Regulations, and Standards | Description |
|---|---|
| State Regulation Health and Safety Code, Section 41700 |
Restricts emissions that would cause nuisance or injury. |
| State Regulation Idling of Commercial Heavy Duty Trucks (13 CCR 2485) |
CARB adopted an Airborne Toxic Control Measure (ATCM) to control emissions from idling trucks. The ATCM prohibits idling for more than 5 minutes for all commercial trucks with a gross vehicle weight rating over 10,000 pounds. The ATCM contains an exception that allows trucks to idle while queuing or involved in operational activities (2004). |
| State Regulation In-Use On-Road (13 CCR 2025) and Off-Road (13 CCR 2449) Diesel-Fueled Fleets |
These regulations are intended to reduce emissions of diesel particulate matter, NOX and other criteria pollutants from in-use diesel-fueled vehicles. The On-Road regulation applies to vehicle owners and sellers in California and establishes a compliance schedule for fleets to meet the Best Available Control Technology requirements. The Off-Road regulation specifies performance requirements and requires exhaust retrofits for fleets that do not meet the NOX or diesel particulate matter target rates. |
| Local Regulations SDAPCD Regulation IV: Prohibitions; Rule 50: Visible Emissions |
Prohibits any activity causing air contaminant emissions darker than 20% opacity for more than an aggregate of 3 minutes in any consecutive 60-minute time period. In addition, Rule 50 prohibits any diesel pile-driving hammer activity causing air contaminant emissions for a period or periods aggregating more than 4 minutes during the driving of a single pile (1997). |
| Local Regulations SDAPCD Regulation IV: Prohibitions; Rule 51: Nuisance |
Prohibits the discharge, from any source, of such quantities of air contaminants or other materials that cause or have a tendency to cause injury, detriment, nuisance, annoyance to people and/or the public, or damage to any business or property (1969). |
| Local Regulations SDAPCD Regulation IV: Prohibitions; Rule 55: Fugitive Dust |
Regulates fugitive dust emissions from any commercial construction or demolition activity capable of generating fugitive dust emissions, including active operations, open storage piles, and inactive disturbed areas, as well as track-out and carry-out onto paved roads beyond a project site (2009). |
| Local Regulations SDAPCD Regulation IV: Prohibitions; Rule 67.0: Architectural Coatings |
Requires manufacturers, distributors, and end users of architectural and industrial maintenance coatings to reduce VOC emissions from the use of these coatings, primarily by placing limits on the VOC content of various coating categories (2001). |
| Local Regulations SDAPCD Regulation XI: National Emission Standards for Hazardous Air Pollutants; Subpart M, Rule 361.145: Standard for Demolition and Renovation |
Requires owners and operators of a demolition or renovation activity to provide written notification of planned asbestos stripping or removal to the Control Officer no less than 10 days prior to demolition and/or asbestos removal. A Notification of Demolition and Renovation Form and fee is required with written notification. Procedures for asbestos emission control are provided under Rule 361.145 and must be followed in accordance with this regulation (1995). |
The SDAPCD adopts, promulgates, and enforces rules and regulations for achieving and maintaining NAAQS and CAAQS. Since the SDAPCD only regulates non-mobile (stationary and some area) sources, only the stationary and area source control measures, as identified in the SDAPCD Regional Air Quality Strategy and State Implementation Plan, have been incorporated by SDAPCD into its rules and regulations. However, the PWP/TREP-generated emissions would be from mobile sources, and not from stationary sources. In regards to construction-generated emissions, compliance with SDAPCD Rule 55 would minimize dust released from soil during construction and demolition activities.88
The California Clean Air Act requires areas that are designated nonattainment of CAAQS for O3, CO, SO2, or NO2 to prepare and implement plans to attain the standards by the earliest practicable date (Health and Safety Code Section 40911(a)). CAAQS for each of these pollutants has been attained in the SDAB. Currently, there is no requirement for PM10 and PM2.5 attainment plans for state PM10 and PM2.5 nonattainment areas. In response to the state nonattainment designation for O3, the SDAPCD prepared and adopted Regional Air Quality Strategy for attaining state O3 standards. The 2009 Regional Air Quality Strategy Revision, dated April 22, 2009, is designed to meet the California Clean Air Act goal of reducing O3 precursor emissions (VOCs and NOX). Future development would be required to be consistent with the emission reduction strategies in the Regional Air Quality Strategy in order to comply with SDAPCD rules and regulations and obtain required SDAPCD permits.89 However, construction of the proposed improvements would not require permits from the SDAPCD.
The principal sources of off-road emissions associated with 2050 RTP/SCS projects would be train operations; port activities, including materials handling equipment and ship operations; and construction. All other sources of emissions including off-road emissions (e.g., stationary sources, ships, airplanes, trains, construction) are either regulated or reported by SDAPCD, CARB, or EPA and these emissions are addressed in the SDAPCD Regional Air Quality Strategy.90
One of the key objectives of the proposed project is to improve the efficient regional movement of people and goods, averting future conditions associated with substantial gridlock on the facility. Improvement of traffic flow, along with the provision of improved bike/pedestrian facilities, would contribute to improvement in regional air quality once in operation. As a result, even considering the potential for increased freeway travel (i.e., latent demand and draw from local streets and roads), the project would be consistent with regional air quality plans.91 Implementation measures discussed above would minimize air pollutant emissions, which may also reduce GHG emissions, and further ensure consistency with SDAPCD and CARB plans and requirements.
5.1.4.2 Vehicle Miles Traveled, Energy Consumption, and Air Quality and Greenhouse Gas Emissions
The transportation of people and goods in cars, trucks, buses, and motorcycles is the single largest source of GHG emissions in the San Diego region. In 2006, on-road transportation accounted for 46% of total emissions in the region, with cars and light-duty trucks alone responsible for 41%. Heavy-duty trucks and vehicles represented about 5% of GHG emissions. Civil aviation and rail (passenger and freight) accounted for 6%, and additional emissions result from electricity that powers the trolley.92
Growth in NCC population, employment, and travel is anticipated to occur whether improvements are made or not. In fact, between 60% and 85% of the projected growth in VMT on I-5 would occur even without the project.93 As discussed in Section 5.1.1, implementing the proposed transportation improvements in the NCC would result in more VMT on I-5; however, the increased VMT would be all or partially offset by the operational and travel improvements gained from the improved rail and new Express Lanes facilities, including lower VHT (i.e., fewer idling trains and congested hours of highway travel) and shifts to HOV travel (carpools and transit), which result in more overall person-carrying capacity in the corridor. In addition, the PWP/TREP program of multimodal transportation enhancements would improve mobility in the corridor by providing alternative transportation options (such as transit, HOV facilities, pedestrian trails, and bike paths) that efficiently and effectively accommodate more person- trips in the corridor while minimizing energy, air pollutant, and GHG impacts, particularly impacts per person-trip. The proposed PWP/TREP improvements would enhance the energy and air quality efficiency of improved access and mobility in the corridor.
The Coastal Act recognizes the benefits of providing transportation choices for all people to not only coastal public access and recreation, but also as a means of reducing VMT, energy consumption and GHG emissions, and thus curtailing the effects of global climate change. While the implementation of Coastal Act policies is limited to addressing development activities affecting coastal resources in the Coastal Zone, climate change is a coastal resource issue driven by land use and transportation activities that extend well beyond the boundaries of the NCC and the region. In this regard, Coastal Act policies which address reducing VMT and energy consumption through provision of transit in the Coastal Zone are supported by the region's transportation objectives to ensure the NCC's transit-focused transportation system is effectively integrated into the regional, state, and national system, and that transportation investments in the NCC complement the region's commitment to providing the greatest possible mobility project benefits per investment. Investing available funds in transportation improvements that will support transportation solutions across jurisdictional boundaries, and which will facilitate Smart Growth practices that maximize mobility at the regional level, is the best means of reducing VMT and energy consumption in the region to help achieve state-mandated GHG reductions, and thus support efforts to address the effects of global climate change on coastal resources.
The transportation vision for the NCC identified by SANDAG and Caltrans includes the addition of Express Lanes to I-5, which will address growing travel demand and would expand the highway's capacity for high-occupancy and transit vehicles. The vision also includes LOSSAN double-tracking, COASTER service improvements, new BRT service, enhanced local bus services, and better facilities for bicycles and pedestrians. Each improvement is aimed at increasing capacity in some way and, taken together, they represent a balanced approach to addressing the mobility and access problem. The fulfillment of the PWP/TREP's multimodal transportation vision will go a long way toward increasing corridor mobility, decreasing congestion, decreasing VHT, and reducing VMT, which would reduce associated air pollutant and GHG emissions.
Proposed rail improvements would allow for increased passenger rail service in the corridor to accommodate projected passenger demand and improve the attractiveness of rail as an alternative to SOV travel in the corridor. Increased passenger service would increase locomotive miles, which, with existing technology, would lead to an overall increase in energy consumption and emissions of criteria pollutants and GHGs; however, the combination of projected higher ridership due to more frequent and faster service, fewer congestion-related delays, and less train idling, with cleaner, more energy-efficient locomotives would help offset energy consumption and emissions in the rail corridor that result from higher rail VMT. Continued improvements in locomotive air pollution controls, along with the anticipated Tier 3 standards (the EPA's emission standards for non-road diesel engines) would result in continued reductions of pollutant emissions per mile of locomotive travel. Additionally, while each SOV trip incrementally adds more VMT and energy use, the number of projected trains (frequency of service) in the corridor would generally stay constant as rail person-trips increase up to passenger capacity thresholds (20,000 trips per day with the project), resulting in decreases in expended energy and produced emissions per person-trip as rail use increases to fill available capacity.94 The LOSSAN rail corridor improvements would also be consistent with the California Energy Plan, which encourages reducing transportation-related energy needs by including efficient public transportation. Improvements to public transit infrastructure have been found to be consistent with Coastal Act Section 30253 as they encourage the use of a more efficient mode of transportation.
More frequent, faster, and reliable rail service in the corridor could lead to public support and demand for denser housing or other development around LOSSAN rail corridor stations, as planned for in SANDAG's adopted Smart Growth policies and Concept Map. Such development would allow for residents and other travelers to increase their use of rail services in the corridor, as well as increase walk and bike modes for local trips. This activity would further reduce VMT, VHT, energy use and air emissions. This concept is elaborated in Section 5.2: Public Transit and Smart Growth.
The proposed suite of projects and other projects included in the 2050 RTP have been selected and designed to primarily address declines in travel mobility measures (e.g., reducing delay) that are projected to result from long-term population growth. The proposed transit improvements (i.e., rail, BRT, park-and-ride for transit, and transit infrastructure) and enhancements and capacity additions for alternative modes of transportation (i.e., HOV and Express Lanes, park-and-ride for carpooling, and bicycle and pedestrian facilities), are more likely to reduce GHG emissions than new roads or mixed flow additions because they add capacity, but also reduce VMT.95
The proposed project would generate a reduction in vehicle travel in several ways, including shifts from driving to other modes (i.e., transit [rail and BRT], bicycling, walking), increasing vehicle occupancy (e.g., HOV/Express Lanes), and reducing vehicle trip lengths (e.g., park-and-ride facilities). These strategies to reduce overall VMT (assuming no other effects) would also reduce vehicle-generated emissions of air pollutants and GHGs. Each mile that a vehicle travels, it emits more pollution; therefore, as the project reduces vehicle travel mileage it would also reduce air pollutant and GHG emissions.
The proposed I-5 Express Lane system would prioritize and incentivize an increase in HOV and transit use and maximize corridor person throughput. Although total VMT would increase in 2040 compared to existing conditions (because of the increased number of HOV and transit trips), these improvements would reduce VHT and VMT per person-trip as more persons can be transported in fewer vehicles. Improvements to the I-5 corridor would encourage the use of carpools, vanpools, and transit, including planned BRT service in the corridor, by providing uncongested, free-flow facilities for these modes.
Greater use of HOVs would lead to less energy consumption and air emissions per person-trip. In addition, since energy consumption and emissions increase as congestion increases, reduced congestion and resulting reductions in VHT in the corridor would have positive benefits for energy use and air quality. Because most (approximately 60% to 85%) of the growth in VMT on I-5 would occur even without the highway improvements and these improvements both encourage HOV use and would reduce congestion, much of the energy and emissions increases from incremental project increases in VMT would be partially offset by decreases in energy consumption and emissions because of higher vehicle occupancy and more efficient travel on the highway.
In addition to providing facilities for HOV and transit vehicles, SOVs would be allowed to access the Express Lanes for a fee, which would vary (the more congestion on the Express Lanes, the higher the SOV cost to use them) to ensure the lanes stay congestion free. The permitted use of HOV lanes by SOVs would have multiple energy use benefits, and revenues from these fees would be support operation of the Express Lanes and invested in corridor public transit services, which would increase transit's competitiveness as an option for travel in the corridor. Also, charging fees to SOVs using the Express Lanes would allow the use of the facility when capacity exists. There may be times when excess capacity would exist on the Express Lanes while the main lanes are congested. By managing the congestion pricing and allowing some SOVs into the Express Lanes for a fee, congestion on the main lanes–and corresponding energy use and emissions–would be reduced without negative effects to the HOV and transit users of the Express Lanes.
Technology, such as intelligent transportation systems, electronic communications, and incident response systems, would further improve corridor efficiency and reduce congestion and idling as required by Implementation Measure 5.1.3. By reducing vehicle idling (assuming constant emissions factors and no other effects that would further impact emissions), the project would reduce vehicle air pollutant emissions; some of each pollutant is producing during engine operation even if a motor vehicle is not moving. Specifically, the combustion process results in exhaust emissions of all criteria pollutants and running loss evaporative emissions also occur during idling, as the hot engine and exhaust system vaporizes gasoline, causing the additional release of VOCs.96
Design provisions would also ensure reduced energy usage and emissions, including more energy-efficient lighting, reduced cement and increased recycled material pavement, and sustainable landscaping. Additional auxiliary and Express Lanes, new and expanded park-and-ride facilities, improved bike lane, and sidewalk features, ramp metering, and an improved transit-highway interface would likely improve traffic conditions and encourage alternative transportation modes, and thus reduce energy consumption and emissions. In addition, Caltrans is developing a plan to incorporate electrical infrastructure at the new and expanded NCC park-and-ride facilities, including installation of state-of-the-art rapid electric vehicle charging stations. The provision of rapid chargers would enable a greater transition to zero-emissions vehicles that may otherwise not occur without the enhanced access to public electric vehicle charging stations; thereby, potentially reducing GHG emissions associated with vehicle travel.
By accommodating current and projected growth in traffic demand on the existing highway facilities, indirect and inefficient routing would be reduced. As highway congestion grows, drivers are more likely to take alternative routes, using local arterials that are often circuitous and lead to higher VMT. Additionally, travel on the established, high-volume route would reduce potential impacts on local communities and coastal access from those trying to avoid highway congestion by using local arterials, including localized air quality impacts. By providing sufficient capacity to control congestion, out-of-direction travel would be minimized, as would be pressure to construct new or larger transportation corridors in local communities and undeveloped areas.
In addition to reducing per-capita VMT, the proposed project would reduce the number of vehicle trips and associated emissions through the implementation of a broad range of bicycle and pedestrian improvements. During the first portion of a vehicle trip, when the vehicle engine starts cold, the vehicle emits some pollutants at a much higher rate than during the remainder of the trip, since emissions control technology does not operate as efficiently when cold as it does when the vehicle is warm. Most bicycle and pedestrian projects reduce vehicle trips entirely and will eliminate both cold start and running emissions.97 In addition, many of the community enhancements planned as part of the project in the corridor would connect regional and local bicycle and pedestrian routes and thereby make them viable travel modes for many corridor trips. In general, a reduction in VMT that occurs entirely through vehicle trip elimination, such as the proposed bicycle and pedestrian improvements, would result in a nearly proportional reduction in emissions of air pollutants and GHGs from light-duty motor vehicles. For instance, reducing light-duty vehicle commute travel by 5% due to mode shifts from vehicles to bicycles or walking should result in approximately a 5% reduction in emissions of all pollutants by light-duty vehicles on work trips assuming the same emissions factors.98 Accordingly, the utilization of bicycle and pedestrian facilities as an alternative transportation mode would effectively reduce air pollutants and GHG emissions. Bicycle and pedestrian connection enhancements are described and illustrated in detail in Chapter 4 and Section 5.3.
Additionally, the corridor vision for bicycle and pedestrian routes and trails includes an extensive network that provides access to the beaches, lagoons, open spaces, and coastal communities of the NCC. Local roads cross I-5 at several locations within the corridor, and many of these crossings are narrow and unaccommodating for bicycles and pedestrians, inhibiting their access to coastal resources. These limited crossings also reduce bicycle and pedestrian access to the Coastal Rail Trail, a separated facility that is being developed throughout the NCC.
The program of improvements in the PWP/TREP represents a significant opportunity to enhance existing bicycle and pedestrian facilities and add new facilities across and along the highway corridor. As over-crossings are rebuilt and under-crossings are widened to accommodate the new highway footprint, many existing pedestrian and bicycle facilities will be upgraded and new facilities will be added. Pedestrian and bicycle routes across lagoons would be similarly integrated into highway improvements. Additionally, the LOSSAN corridor will benefit from new pedestrian bridges and improved crossings that will provide safe and convenient ways for pedestrians and bicycles to cross the tracks, better connecting communities to the Coastal Rail Trail and area beaches.
The proposed NCC improvements also include non-capacity adding projects such as sound walls and certain community enhancements (e.g., open space and gardens, gateway features, and landscaping). These components of the PWP/TREP are not expected to change long‐term VMT growth projections; therefore, they are designated neutral for long‐term GHG emissions, or as providing long‐term GHG reduction by reducing pavement roughness and thus improving fuel economy. Although this is not strictly the case as the implementation of these components will produce construction emissions, it is reasonable to assume that these projects will not, on average, increase yearly operational air quality or GHG emissions.99
There are numerous federal, state, and local rules, regulations, and standards that would apply to the proposed PWP/TREP, which would reduce energy consumption and air pollutant and GHG emissions associated with transportation. In addition, various plans, programs, and projects would reduce transportation-generated emissions locally and regionally, which would improve air quality conditions in the SDAB and reduce the San Diego region's contribution to global climate change. Examples of these include the 2050 RTP/SCS, implementation of specific measures in CARB's Scoping Plan, Caltrans's Climate Action Program, SANDAG's CAS, SANDAG's Electric Vehicle Project, California Low Carbon Fuel Standards, Pavley Standards, and local city and county Climate Action Plans.
The levels of fuel consumption and GHG emissions result from the region's reliance on petroleum-based gasoline and diesel fuels, as well as the average fuel efficiency of vehicles. The region's need for gasoline and diesel is projected to decline from about 4.5 million gallons per day in 2008 to about 4.2 million gallons per day by 2050. The projected reduction in fuel consumption is due in large part to fuel efficiency standards for vehicles and state-mandated increases in the supply and use of alternative transportation fuels.100
By 2050, most of the highway, transit, and active transportation (bicycle and pedestrian) improvements, along with other infrastructure projects, would be in place and operational in accordance with the 2050 RTP/SCS. Existing state measures are expected to continue to be in place that would help to reduce emissions related to on-road transportation. The Low Carbon Fuel Standard would be fully phased in and cars and light trucks meeting the Pavley/EPA/NHTSA emission standards would replace most current vehicles. GHG emissions from transportation would be reduced through the use of more efficient vehicles and less carbon-intense fuels, reducing transportation-related emissions in 2050, as facilitated by the implementation of state measures.
In addition, ARB's Scoping Plan functions as a roadmap for plans to achieve GHG reductions in California as defined in AB 32, which calls for GHG emissions to be reduced to 1990 levels by 2020. The Scoping Plan contains the main strategies California will implement to reduce CO2E emissions by 169 million metric tons, or 28.4% below the state's projected 2020 emissions level of 596 million metric tons of CO2E under a business-as-usual scenario. In the absence of reliable 1990 GHG emissions estimates, CARB recommends an equivalent metric of 15% below 2005 GHG emissions. In the SANDAG region, the University of San Diego's Energy Policy Initiatives Center has estimated land use and transportation emissions for 2005 to be 13.64 and 15.90 million metric tons of CO2E, respectively.101
All 18 cities and the County of San Diego have completed a GHG inventory, many prepared as part of the San Diego Foundation's Climate Initiative. A GHG inventory is the first step toward preparing a Climate Action Plan, which is a document that provides guidance to jurisdictions for achieving GHG reduction goals. Since SANDAG does not implement land use policy, decisions regarding how and when to implement land-use strategies that will result in reduced GHG emissions outlined in the SCS will ultimately come from the local-agency level. A Climate Action Plan provides measures for reducing emissions through policies similar to those in the SCS, such as by encouraging building retrofits or mandating an energy efficiency code in new construction. Many jurisdictions have or are currently preparing climate-change planning documents, including the City of Encinitas, the City of San Diego, and the County of San Diego.
The rail improvements to the corridor would result in beneficial reductions in energy use and emissions, including GHGs, in localized areas (as well as the entire I-5 highway corridor) by increasing rail ridership and decreasing rail congestion and associated locomotive idling along the corridor and at existing stations. Regional air quality would be improved by encouraging SOV trips to shift to the LOSSAN rail corridor; however, energy and air emissions mitigation during construction and operation and/or continued improvement in the locomotive fleet would remain important to ensure that rail improvements would not individually or cumulatively result in significant adverse air quality impacts in the study area.
While construction of the proposed transportation improvements would require significant energy consumption and result in additional emissions, these short-term emissions would be partially offset by the long-term post-construction operational benefits of the transportation system (e.g., highway and pedestrian facilities). The long-term savings in operational energy requirements from reduced congestion-related fuel consumption, out-of-direction travel, higher vehicle occupancy, and more trips made by walking and biking would in part offset construction energy requirements.102 Energy use and emissions from constructing improvements are addressed in Implementation Measures 5.1.1. By seeking to accommodate existing and planned demand through more efficient modes while addressing the existing land-use constraints and topographical barriers, improvements within the I-5 corridor, combined with those in the LOSSAN rail corridor, are consistent with Coastal Act Section 30253, as they seek to maximize person throughput while minimizing the level of energy use and emissions per person mile traveled.
The impact of the improvements on GHG emissions would be similar to criteria pollutants. While increases in GHGs would be expected to occur with the increased use of the LOSSAN and I-5 corridors, the proposed transportation improvements would also decrease congestion-related delays and idling along these corridors, offsetting a portion of that increase. In addition, these improvements would increase the person-carrying capacity in the corridor, improving coastal access and mobility while reducing the per-person energy use and corresponding air pollution emissions. Further, continued improvements in air pollution controls, new reduction technologies, and older fleet replacement with newer more efficient models will result in continued reductions of pollutant emissions per mile traveled.103 Accordingly, the PWP/TREP improvements would be consistent with the Coastal Act policy for reduced energy consumption and VMT.
5.1.5 Local Coastal Program Consistency
Certified local coastal programs (LCPs) in the corridor include policies that may affect energy use and/or air quality, such as those related to land use, transportation, and access, which are discussed in Sections 5.2 and 5.3; however, LCPs generally do not include locally-specific policies and development standards on these issues. Based on available project and environmental data and the design/development strategies, and policies and implementation measures included herein, the proposed PWP/TREP improvements would offset the energy use generated by the incremental increase in VMT on I-5 by reducing VHT and energy use per person-trip. PWP/TREP improvements would be consistent with air quality requirements through sensitive programming, design, and construction and by applying reasonable design/development strategies and mitigation measures; therefore, the NCC PWP/TREP is consistent with applicable energy, VMT, and air quality/GHG policies of the corridor LCPs.
Notes:
- California Energy Commission. Consumer Energy Center: Transportation, 2006. http://www.consumerenergycenter.org/transportation/index.html.
- SANDAG 2050 RTP (Chapter 3), October 2011; SANDAG/Caltrans Series 12 Model, November 2011.
- As discussed in Section 5.1.2.2, the SANDAG/Caltrans Series 11 model projected a 29.6% increase in vehicle miles traveled (VMT) on I-5 between 2006 and the 2030 No Build Alternative. The Series 12 model projected a 17.0% increase in VMT on I-5 between 2010 and the 2040 No Build Alternative.
- SANDAG 2050 RTP (Chapter 3), October 2011; SANDAG/Caltrans Series 12 Model, November 2011.
- SANDAG 2050 RTP (Chapter 3), October 2011.
- SANDAG Regional Comprehensive Plan, July 2004. Smart Growth focuses housing and jobs within urban areas served by a multimodal transportation system, which, in turn, reduces urban sprawl and preserves open space, and agricultural and natural resource areas.
- SANDAG Trip Generation for Smart Growth: Planning Tools for the San Diego Region, June 2010.
- SANDAG 2050 RTP (Technical Appendix 7), October 2011.
- SANDAG 2050 RTP Final EIR (Chapter 4), October 2011.
- California Greenhouse Gas Inventory for 2000-2009 – by Category as Defined in the Scoping Plan, California Air Resources Board, 2011. http://www.arb.ca.gov/cc/inventory/data/tables/ghg_inventory_scopingplan_00-09_2011-10-26.pdf.
- I-5 NCC Project Final EIR/EIS (Section 4.6), October 2013.
- Energy Efficiency Report, California Energy Commission, 1990.
- Multi-Pollutant Emissions Benefits of Transportation Strategies, ICF International, 2006.
- LOSSAN Final Program EIR/EIS, September 2007.
- Multi-Pollutant Emissions Benefits of Transportation Strategies, Federal Highway Administration, 2011.
- LOSSAN Final Program EIR/EIS (Section 3-3), September 2007.
- Ibid.
- Greenhouse Gas Emission Inventory, CARB, April 2012; Climate Change - Greenhouse Gas Emissions, EPA. http://www.epa.gov/climatechange/emissions/index.html.
- Climate Action Team Report to the Governor and Legislature, California Climate Action Team, March 2006.
- The CO2 equivalent for a gas is derived by multiplying the mass of the gas by the associated GWP, such that MT CO2E = (metric tons of a GHG) x (GWP of the GHG). For example, the GWP for CH4 is 21. This means that emissions of 1 metric ton of methane are equivalent to emissions of 21 metric tons of CO2.
- Climate Change 2007: Synthesis Report - Summary for Policy Makers, Intergovernmental Panel on Climate Change, November 2007. http://www.ipcc.ch/pdf/assessment-report/ar4/syr/ar4_syr_spm.pdf.
- 2017 and Later Model Year Light-Duty Vehicle Greenhouse Gas Emissions and Corporate Average Fuel Economy Standards, EPA and National Highway Traffic Safety Administration, EPA-HQ-OAR-2010-0799/NHTSA-2010-0131, 2012.
- SANDAG 2050 RTP (Chapter 3), October 2011.
- SANDAG 2050 RTP Final EIR (Chapter 4), October 2011.
- SANDAG 2050 RTP (Chapter 3), October 2011.
- Ibid., Chapter 2.
- Ibid., Chapter 3.
- Ibid.
- LOSSAN Final Program EIR/EIS (Sections 3-3 and 3-5), September 2007; I-5 NCC Project Final EIR/EIS (Sections 3.14, 3.16), October 2013.
- SANDAG 2050 RTP (Chapter 6), October 2011.
- LOSSAN Corridor Strategic Assessment, Wilbur Smith Associates, January 2010.
- SANDAG 2050 RTP (Chapter 6), October 2011.
- SANDAG/Caltrans Series 12 Model, November 2011.
- LOSSAN Final Program EIR/EIS (Section 3-5), September 2007.
- Ibid.
- The LOSSAN Final Program EIR/EIS (September 2007) determined that the Rail Improvements Alternative would exceed the South Coast Air Quality Management District's threshold for NOX in the South Coast Air Basin by 2020 without applying mitigation and not assuming the use of Tier 3 locomotives. Similar exceedances of SDAPCD NOX thresholds were determined to be possible based on this analysis.
- LOSSAN Final Program EIR/EIS (Section 3-3), September 2007.
- LOSSAN Final Program EIR/EIS (Section 3-5), September 2007.
- Ibid., Section 3-3.
- Ibid.
- Ibid.
- San Diego NCC-CSMP, August 2010
- SANDAG/Caltrans Series 11-based Micro-Simulation Model, August 2010.
- San Diego NCC-CSMP (Chapter 8), August 2010.
- Ibid.
- Ibid.
- SANDAG/Caltrans Series 12 Model, November 2011.
- San Diego NCC-CSMP (Chapter 8), August 2010.
- SANDAG/Caltrans Series 11-based Micro-Simulation Model, August 2010.
- San Diego NCC-CSMP (Chapter 8), August 2010.
- San Diego NCC-CSMP (Chapter 8), August 2010.
- SANDAG/Caltrans Series 12 Model, November 2011.
- San Diego NCC-CSMP (Chapter 8), August 2010.
- Ibid.
- I-5 NCC Project Final EIR/EIS (Section 2.2), October 2013.
- Ibid.; Prioritization of Transportation Projects for Economic Stimulus with Respect to GHGs, UC Davis/Caltrans, 2009.
- I-5 NCC Project Final EIR/EIS (Section 3.16), October 2013.
- Ibid., Section 3.14.
- I-5 NCC Project Final EIR/EIS (Section 3.14), October 2013.
- The 2007 Draft Air Quality Analysis for the I-5 NCC Project, which was used for the I-5 NCC Project Final EIR/EIS air quality analysis, estimated potential construction air quality impacts resulting from construction activities, but did not calculate CO2 emissions. The 2007 Air Quality Analysis used the SMAQMD Road Construction Emissions Model Version 5.1, which did not calculate CO2 or other GHG emissions. The SMAQMD Road Construction Emissions Model Version 6.3.2 estimates CO2 emissions and provides more recent emission factors than Version 5.1; therefore, criteria air pollutant emissions presented in this section are also estimated busing Version 6.3.2 (i.e., EMFAC 2007 and OFFROAD 2007 emission factors).
- The SMAQMD released a more recent version in August 2013 (Version 7.1.4); however, it would tend to estimate lower air pollutant emissions because it reflects some statewide measures that are intended to reduce off-road vehicle and heavy-duty truck emissions.
- I-5 NCC Project Final EIR/EIS (Section 3.14), October 2013.
- California Climate Action Registry General Reporting Protocol, 2009.
- Greenhouse Gas Emissions from a Typical Passenger Vehicle, EPA, 2004.
- SANDAG 2050 RTP (Chapter 2), October 2011.
- Ibid., Technical Appendix 7.
- Ibid., Chapter 3.
- Ibid., Chapter 2.
- Ibid.
- SANDAG 2050 RTP (Chapter 2), October 2011.
- Ibid.
- Ibid.
- SANDAG 2050 RTP (Chapter 2) October 2011.
- Ibid.
- SANDAG 2050 RTP Final EIR, October 2011.
- Ibid.
- Intersections where CO concentration hotspot modeling results are provided include: Palomar Airport Road and I-5 access ramps; Genesee Avenue and I-5 access ramps; and, Del Mar Heights Road and I-5 access ramps.
- I-5 NCC Project Final EIR/EIS (Section 3.14), October 2013.
- Transportation Conformity Guidance for Qualitative Hot-Spot Analysis in PM10 and PM2.5 Non-Attainment and Maintenance Areas, EPA and Federal Highway Administration. As cited in I-5 NCC Project Final EIR/EIS (Section 3.14), October 2013.
- Draft Air Quality Analysis for the I-5 North Coast Corridor Project, August 2007.
- SANDAG 2050 RTP Final EIR (Chapter 4), October 2011. These are national figures, and therefore data for individual roadways in California and San Diego may vary.
- Ibid.
- Current ridership from SANDAG Coordinated Plan 2012-2016 (Appendix C), July 2012. Ridership and capacity projections from SANDAG modeling and staff estimates, April 2011 and May 2012.
- Assume: 47,000 daily rider capacity; 75% of rail trips occur during the 6 hours of peak periods (20 min frequency during the peak, 60 minute frequency off-peak); lane capacity of 2,000 vehicles per hour and 1.28 average vehicle occupancy in general-purpose lanes (from SANDAG regional modeling data SANDAG, April 2012). Calculation: 47,000 * 0.75 = 35,250 rail trips during peak periods; 35,250/6 = 5,875 rail trips per peak hour; 5,875/1.28 = 4,590 car trip equivalent; 4,590/2,000 ≈ 2.3 lanes of traffic.
- SANDAG Smart Growth Concept Map, January 2012. See Section 2.2.
- For the LOSSAN rail corridor, the road program-level analysis led to measures to reduce the amount of energy consumed. If the proposed improvements were implemented, the project-level analysis and design would be evaluated for the feasibility of incorporating these measures.
- Caltrans Standard Specifications, 2010.
- SANDAG 2050 RTP Final EIR (Chapter 4), October 2011.
- Ibid.
- Ibid.
- I-5 NCC Project Final EIR/EIS (Section 3.14), October 2013.
- SANDAG 2050 RTP (Chapter 3), October 2011.
- As noted in Table 5.1-3, VMT in the Series 12 model projections would increase from 5.53 million in 2010 to 6.47 million in the 2040 No Build Alternative, or to 7.11 million in the 2040 Build scenario. Therefore, 60% of the total rise in VMT would occur under the No Build Alternative (0.94 million ÷ 1.58 million). Similarly, VMT in the Series 11 model projections would increase from 5.44 million in 2006 to 7.05 million in the 2030 No Build Alternative, or to 7.33 million in the 2030 Build Alternative. Therefore, 85% of the total rise in VMT would occur under the No Build Alternative (1.16 million ÷ 1.89 million).
- The energy and emissions reductions per person trip would occur for all transportation modes that increase occupancy per vehicle, including buses and carpools.
- Prioritization of Transportation Projects for Economic Stimulus with Respect to GHGs, UC Davis/Caltrans, 2009.
- Multi-Pollutant Emissions Benefits of Transportation Strategies, ICF International, 2006.
- Multi-Pollutant Emissions Benefits of Transportation Strategies, ICF International, 2006.
- Ibid.
- Prioritization of Transportation Projects for Economic Stimulus with Respect to GHGs, UC Davis/Caltrans, 2009.
- SANDAG 2050 RTP (Chapter 3), October 2011.
- San Diego County Greenhouse Gas Inventory: An Analysis of Regional Emissions and Strategies to Achieve AB 32 Targets, University of San Diego, September 2008.
- I-5 NCC Project Final EIR/EIS (Section 3.16), October 2013.
- Ibid., Section 3.14; LOSSAN Final Program EIR/EIS (Section 3-3), September 2007.