
Chapter 3A - The North Coast Corridor Problem: Transportation and Resource Deficiencies
The North Coast Corridor (NCC) is experiencing a crisis that is felt across all jurisdictions, facilities, and users. The corridor is characterized by deficiencies related to:
- Transportation and mobility constraints that affect coastal access and recreation opportunities.
- The need for new and enhanced transportation infrastructure that fosters healthy and sustainable coastal communities by minimizing traffic spillover on local streets, minimizing energy consumption, air and greenhouse gas (GHG) emissions, and by facilitating Smart Growth policies.
- Preservation and enhancement of water quality and natural habitats.
Chapter 2 describes the NCC today: its existing land uses, multimodal transportation facilities and services, and coastal recreational and natural resources. The chapter also summarizes the San Diego region's transportation policies, objectives and long-range plans that provide the foundation for improving mobility, access and coastal resources in the NCC in the future. Chapter 3A delves into issues and constraints within the existing corridor and describes the growing deficiencies that will affect not only the future transportation system and mobility in the corridor, but also access to and enjoyment of the NCC's shoreline and coastal recreation areas, health and sustainability of the NCC's coastal communities, and the ability to preserve and enhance the unique natural resources in the NCC.
Chapter 3A also assesses the NCC's transportation-system deficiencies in terms of corridor mobility, coastal access, community sustainability, and natural resources. These deficiencies are wide-ranging but stem mainly from the NCC's rapid growth over the last several decades as more residents, visitors, and businesses have placed demands on the corridor's finite infrastructure and resources. The impacts of growth will continue in the future, further exacerbating the threats to mobility, access, community sustainability, and resource protection. The myriad transportation and resource deficiencies are discussed in this chapter and summarized in Table 3A-1.
Following the discussion of corridor deficiencies, Chapter 3B describes the regional and corridor plans and projects that will create the transportation, access, and resource vision for the NCC through 2050 to ensure that corridor access and resources are provided, protected, and enhanced to fulfill Coastal Act policy directives well into the future.
Table 3A-1: North Coast Corridor Transportation and Resource Deficiencies
Corridor Transportation and Mobility - Coastal Access & Recreation
- Inadequate and Degrading Coastal Access and Recreation Opportunities
- Travel Demand and Growth
- Population and Employment Growth Greatly Outpaces Transportation Capacity Growth
- Travel Demand Greatly Outpaces Growth in Population, Employment, and Capacity
- Transit
- Low-Density Land Use Inhibits Successful Transit
- Limited Capacity on Los Angeles-San Diego-San Luis Obispo (LOSSAN) Rail Corridor
- Inadequate Access and Parking at Rail Stations
- Highway
- Consistently Heavy Weekday Highway Congestion
- Consistently Heavy Weekend Highway Congestion
- Few Non-Highway Routes for Local Traffic
- Without Improvements, Highway Congestion Will Continue to Worsen
- Lack of HOV Facilities Discourages HOV and Transit Use
- Driving Alone is the Dominant Travel Mode
- Bicycle and Pedestrian
- North-South Bicycle and Pedestrian Access is Hampered by Barriers due to Lack of Parallel Frontage Roads, Topographical and Lagoon Constraints
- Outdated Interchanges and Lack of Rail Crossings Result in Barriers to East-West Bicycle and Pedestrian Access to the Coast
Coastal Communities
- Without Improvements, Local Traffic Will Continue to Degrade
- Energy Consumption Resulting from Travel Leads to Increases in Air Pollutants and Greenhouse Gas Emissions
- Transportation Infrastructure is Needed to Support Smart Growth Policies
Water Quality and Sensitive Coastal Habitats
- Continued Degradation of Water Quality
- Continued Degradation of Lagoons
- Continued Degradation and Loss of Coastal Habitats
3A.1 The Mobility Problem
The NCC's transportation deficiencies are not limited to a single facility or mode, nor do the deficiencies affect only certain types of travelers. Rather, the problems of growth, demand, capacity, and congestion extend across all of the corridor's transportation facilities: transit, highway, bicycle, and pedestrian. Inadequate and infrequent transit facilities and services, traffic congestion, travel delays, and incomplete bike and pedestrian networks together lead to limits and difficulties for resident, commuter, visitor, business and interregional traveler access to and through the corridor, and similarly lead to limitations for people accessing the coast and recreation areas. Despite the numerous coastal recreational resources in the NCC, access to coastal communities and coastal recreational and natural resources is hampered by the transportation-system deficiencies and mobility constraints of the corridor
Deficiency: Inadequate and Degrading Coastal Access and Recreation Opportunities.
The numerous multimodal transportation deficiencies identified in the NCC severely limit coastal access for residents and visitors alike-a condition that promises to worsen in the absence of transportation improvements.
Travel Demand and Growth
Larger in area than both Rhode Island and Delaware combined, and home to more people than 20 of the 50 states, San Diego County contributes significantly to the economic, political, social, recreational, and environmental well-being of California and the US. The county's location in the southwest corner of the US makes it the front door for the state and nation from the land ports of entry at the Mexican border as well as the seaport in San Diego Bay. People and goods depend on the county's rail and highway transportation network to access local, regional, state, and interstate destinations, and the transportation facilities in the NCC are key links in that regional transportation network. However, the transportation system in the NCC is breaking down because of the following:
- Unprecedented population and travel growth from 1970 to today.
- Physical constraints on transportation infrastructure and capacity.
- Projected continuing growth into the future.
Transit Access
The lack of adequate transit service and other alternative transportation modes to access the beach and upland coastal recreation areas is a recognized impediment to public coastal access. Directly linked to the region's objectives to provide transportation flexibility and ensure the movement of people rather than vehicles are Coastal Act policies that direct protection and enhancement of public access and recreation opportunities by:
- facilitating the provision or extension of transit service;
- providing non-automobile circulation;
- providing adequate parking facilities or serving new development with public transportation; and
- ensuring the potential for public transit for high-intensity uses.
Availability of adequate parking facilities in coastal areas necessary to serve residents, commercial uses, and visitors who travel by car is an important variable that influences public access and recreation opportunities in the Coastal Zone. Where parking is not feasible, substitute means of access such as public transportation, pedestrian, and biking facilities are necessary to access the coast. However, parking constraints at transit stations and pedestrian and biking facility staging areas affect the availability of these alternative travel modes as a means of reaching coastal areas. In particular, most users access rail by driving, and constrained station parking currently discourages many potential passengers from using rail.
Highway Access
The Coastal Commission Public Access Action Plan recognizes roadway congestion as one of the greatest impediments to public access in coastal areas and specifically notes that, among other things, traffic congestion and poor traffic circulation are significant problems where residents and visitors compete to use the same transportation system. As the region's population continues to grow, San Diego County residents and people in the adjacent regions and beyond will continue to seek access to the supply of coastal resources in the corridor, placing additional demand on the region's transportation network-related exclusively to coastal access. Congestion on the I-5 highway also results in increased congestion on local arterial street networks when frustrated travelers exit the congested highway in search of alternate routes, which further restricts mobility and impedes access to coastal resources along local transportation corridors. Projected future demand for public access to the coast and upland recreation areas simply cannot be accommodated within the capacity limitations of the existing transportation network.
Bicycle and Pedestrian Access: Access to Natural Resources & Enhancement of Recreational Facilities
Population growth and development pressures in the NCC have resulted in the loss of public access and recreational opportunities. As the population continues to grow in the corridor, people in San Diego County and adjacent regions will seek access to the remaining supply of coastal resources in the corridor, increasing demand for access to and use of the NCC's recreational facilities. Ultimately, the Coastal Act recognizes the necessity and benefit of providing varied transportation choices for all people to enjoy the coast, including alternative transportation modes that are not reliant on the automobile. These choices include not only transit but also active transportation modes such as walking and biking. Well-planned, non-motorized transportation networks can bridge the gap between origins or destinations and the transit system, addressing the classic "last mile" problem for transit users. Pedestrian and bike facilities create attractive transportation links between land uses that draw travelers out of their automobiles when making short, local trips and when seeking access to coastal resources. In addition to linking land uses and enhancing overall mobility, pedestrian and bike facilities serve as coastal recreational facilities, providing non-vehicular means for accessing and enjoying the varied shoreline and natural resource areas within the corridor.
3A.1.1 Travel Demand and Growth
The transportation and environmental deficiencies in the NCC stem from the numerous trip generators and activity centers in the corridor and have been exacerbated by the area's precipitous growth rates over the past four decades. This growth rate includes not just growth in the resident population but also a significant growth in the number of people visiting NCC destinations, the number of jobs in the corridor, and the overall demand for travel.
3A.1.1.1 Trip Generators and Activity Centers
As described in Chapter 2, the NCC consists of approximately 111,215 gross acres (173 square miles) and is home to more than 525,000 people and 358,000 jobs. While this PWP/TREP addresses the portion of the corridor located only in the Coastal Zone, much of the NCC's primary transportation facilities-namely I-5 and the LOSSAN rail corridor-are located almost entirely in the Coastal Zone. These facilities are critical not only to maintaining access to the corridor's coastal areas but also to maintaining the regional, interregional, and international transportation systems. In 2010, the NCC accommodated over 1.4 million daily vehicle trips just on I-5 (or approximately 13% of the 11.5 million daily vehicle trips that occurred within San Diego County). By 2040, I-5 in the NCC is projected to accommodate nearly 1.8 million daily vehicle trips (an increase of more than 26% over existing conditions).1
Figure 3A-1 illustrates many of the corridor's main activity centers. With more than a half-million people living in the NCC, the corridor features many of the conventional residential trip generators: home, work, school, shopping, and recreation. However, the NCC is also a major tourism destination, accommodating millions of outside visitors each year. As shown in Table 3A-2, the NCC's five-state beaches for which attendance is counted (not including the numerous other public beaches) attracted over 7.6 million visitors in the 2011-2012 fiscal year, which is more than twice the population of the entire San Diego region. As these five state beaches constitute approximately 50% of the NCC coastline, it is reasonable to conclude that the NCC coastline attracts significantly more than 7.6 million visitors each year. Attendance figures also show that 1.7 million people visited Legoland, 1.5 million attended the San Diego County Fair, and over 665,000 people visited the Del Mar Racetrack in recent years. These activity centers draw visitors from all over the region and state, all of whom place demands on the NCC's transportation system above and beyond those of the residential population.
| Recreation/Tourism Destinations | Annual Visitors |
|---|---|
| Torrey Pines State Beach and Natural Reserve | 1.95 million (FY 2011-2012) |
| San Elijo State Beach | 1.21 million (FY 2011-2012) |
| Cardiff State Beach | 1.85 million (FY 2011-2012) |
| Carlsbad State Beach | 1.42 million (FY 2011-2012) |
| South Carlsbad State Beach | 1.19 million (FY 2011-2012) |
| San Diego County Fair | 1.52 million (2012) |
| Del Mar Racetrack | 0.65 million (2012) |
| Legoland | 1.70 million (2010) |
3A.1.1.2 Travel Customers and Trip Types
The NCC is used by a wide variety of travelers who require an array of transportation solutions. A traveler's trip purpose, trip length, and origin and destination influence and often dictate the choice of travel mode. Because trip characteristics vary so widely, a multimodal corridor provides travelers with the ability to choose the mode that best meets their travel and access needs for each trip.
Residents
Local residents in the NCC make a variety of essential and discretionary trips to shop, run errands, go to school, and enjoy their communities' recreational opportunities. Many of their trips are short in distance and often include family members or other companions. Like most trips in the corridor, these are dominated overwhelmingly by the automobile; only 3% of commute trips with at least one end in the NCC are currently made by bus or rail during the peak periods-the times when the most transit service is provided (typically 6:00 A.M.-9:00 A.M. and 3:00 P.M.-6:00 P.M.).2 When considering all trips, all day, it is, therefore, reasonable to deduce that even fewer than 3% of total trips are made by transit in the corridor. While local automobile trips within the NCC ideally would be made on the local street network, geographic constraints significantly limit arterial routes in much of the area, meaning that many of these trips are often forced onto the highway. Indeed, as discussed below, nearly 40% of weekday trips on I-5 are internal to the NCC, having both their origin and destination inside the corridor.
This use of I-5 for these internal trips contributes to highway congestion and subjects both local and regional travelers to substantial delays. The planned expansion of rail service in the corridor will provide benefits to commuters and longer-distance travelers but will be unlikely to attract many new internal trips since, as will be discussed in Section 3A.1.2.5, more than half the residences in the corridor are located farther than 5 miles from rail stations (and many are closer to I-5 than the LOSSAN rail corridor). In addition, rail service on the LOSSAN rail corridor is geared to the long-distance commute and interregional market with widely spaced stations (4-5 miles apart) for faster travel to a few key employment and community destinations. Local bus service may be appropriate for some of these internal trips, but their short length often means that driving has substantial time and access advantages over fixed-route buses-so most travelers still choose the automobile for their local purposes. (See Section 3A.1.2 for a broader discussion of the impediments to effective local transit in the NCC.)
Commuters
Commuters generally travel during peak periods and frequently leave the NCC to access employment sites throughout the region. Most commute trips within the corridor are southbound in the morning and northbound in the evening, reflecting the employment draw to the central and southern parts of the region; however, a small but growing "reverse-commute" pattern also exists, connecting the region's central and southern residents to suburban employment centers in the NCC. As shown in Table 3A-3, just 3% of NCC commuters use rail and bus transit services for their work trips. A much larger percentage use a car/vanpool (10%) and drive alone (76%).
| Area | Drive Alone | Carpool/Vanpool | Public transit | Other Modes | Work at Home |
|---|---|---|---|---|---|
| North Coast Corridor | 76% | 10% | 3% | 2% | 7% |
| California | 72% | 15% | 5% | 5% | 4% |
| United States | 76% | 12% | 5% | 4% | 3% |
Key factors that lead to the high rate of automobile commutes are the dispersed nature of trip origins (homes) and destinations (jobs) both inside and outside of the corridor. On the origin end of the trip, the established, generally low-density land use pattern in the NCC fails to generate the population concentrations necessary to truly support a major shift in transit mode share in the corridor. On the destination end of the commute trip, the regional distribution of jobs makes automobile travel more efficient for all but a few areas of concentrated employment (i.e., Sorrento Valley, downtown San Diego, Kearny Mesa, and University City). As discussed later in this chapter, few single employment centers in the San Diego region are large enough or concentrated enough to support transit connections to all parts of the region, particularly those parts with relatively low population densities such as the NCC.

Visitors
Visitors and locals enjoy the NCC for its approximately 30 miles of beaches, quaint coastal communities, parks, open spaces, coastal resorts, and entertainment venues. These visitor and recreational travelers often have unique needs that are not easily served with transit. For example, a family of four spending a Saturday on the beach would likely load a vehicle with boogie boards, umbrellas, and coolers full of food and drinks, which are difficult to transport on public transit. In addition, many recreational users travel (particularly on weekends) from locations east of the corridor that are not directly served by the major north-south NCC transit services. As a result, recreational users are much more likely to make their trips via automobile. While these types of trips do not generally lend themselves to travel by transit, recreational users are more likely to be in carpools; a study of NCC traffic found that between 54% and 65% of weekend traffic on some sections of I-5 comprises HOVs-a category that includes carpools as well as vanpools and buses.3
Businesses
International, interregional and regional businesses transport billions of dollars of goods annually using the intermodal freight transportation network in San Diego County. While there is freight service on the LOSSAN rail corridor, trucks carry more than 90% of the region's freight volume.4 Aside from locally based shipping, which is mostly by truck, the majority of goods that arrive in San Diego bound for other regions are also transferred to trucks before being shipped to inland destinations. This stems primarily from the economics of goods movement; businesses typically choose trucks to move freight through the region because it avoids the additional train-truck transfer that would be necessary before goods reach their final destinations. Over 70% of the freight volume originating in San Diego County or arriving at San Diego ports is bound for destinations within the county or the state of California; for many of these shipments, the cost of an intermodal transfer to rail simply does not make economic sense.5 It is expected that this heavy reliance on trucks for goods movement will continue.
As the primary link to the Los Angeles area, I-5 carries about one-third of all freight in the San Diego region, with an estimated value of up to $88 billion in 2007 and an Annual Average Daily Truck Traffic of about 7,200.6 At a regional level, approximately 900,000 trucks entered the United States from Mexico through the San Diego region's three land ports of entry in 2007; these international truck volumes are projected to increase to 4.5 million by 2050. In contrast, about 9,000 loaded rail cars made this same crossing in 2007; this figure is anticipated to reach 20,000 by 2050. With many of these goods destined for distribution throughout the nation, I-5's role in goods movement alone makes it a vital economic lifeline-and its importance will continue to grow as international goods movement increases.
Interregional and Through Travelers
Corridor interregional and through travelers use NCC facilities at some point in the course of their travels but generally do so as part of longer-distance trips to or from points outside the NCC. The region is bounded by several major commercial and tourism destinations-including Los Angeles, Orange County, Riverside County, and Baja California in Mexico-that attracts many types of users. While some of these trips begin or end in the NCC (such as a family from Riverside visiting the beach or an Encinitas resident traveling to Los Angeles for a business meeting), other trips use the transportation facilities to pass through the NCC (such as freight from Mexico heading to the Port of Los Angeles or a family from Chula Vista going to Disneyland). Through trips also include shorter journeys that are entirely within the region and cross into the NCC during the trip (such as a Fallbrook resident using I-5 to reach downtown San Diego).
On weekdays, over 20% of NCC travelers use NCC facilities for these interregional and through trips; this proportion is expected to grow by 2040.7 As I-5 and the LOSSAN rail corridor provide the only interregional transportation facilities to and through the NCC, they will continue to be essential in facilitating these travel patterns.
Trip Types
Based on the variety of customers in the corridor described above, there are a number of trip types occurring within the NCC that affect the operation of the corridor's transportation facilities. An understanding of how the facilities are used assists in framing the context of the improvements needed to achieve the PWP/TREP transportation and resource enhancement objectives for the corridor.
Table 3A-4 identifies the key types of travelers who use the NCC along with the general purposes, relative lengths, and primary types of trips they make. Trips that use NCC facilities are divided into the following four types, based primarily on where the "ends" of the trip fall:
- Internal Trip: Both ends of trip in NCC (regardless of distance)
- Example: An Oceanside resident taking a day trip to Carlsbad State Beach
- Regional Trip: One or both ends of trip outside NCC, but within San Diego region
- Example: A commuter traveling from her Encinitas home to downtown San Diego; a Fallbrook resident using I-5 to visit relatives in Coronado
- Interregional Trip: One end of trip within San Diego region, other end outside San Diego region
- Example: A family from Los Angeles visiting Legoland; a Mission Valley resident attending a business meeting in Orange County
- Interregional-Through Trip: Both ends of trip outside San Diego region
- Example: Freight movement from Mexico to Los Angeles
Table 3A-5 provides a breakdown of the existing and projected trip types of I-5 travelers in the NCC. As travel grows in the corridor, all types of trips are expected to increase in absolute terms, indicating a definite need for the NCC transportation system to accommodate new demand. In relative terms, the projections show an increasing proportion of regional and interregional trips using I-5 and a concurrent decrease in the proportion of internal trips. This information reflects the growing importance of I-5 to non-local travelers; as the region grows, the corridor will serve as an increasingly vital link in the regional and interregional transportation system. In addition, the increasing prevalence of longer-distance travelers also indicates a strong opportunity for the success of facilities such as Express Lanes, which serve these longer trips best by separating them from the slower "on-and-off" patterns of local and internal traffic.
| Residents | Commuters | Visitors | Businesses | Interregional & Through Travelers | |
|---|---|---|---|---|---|
| General Trip Purposes | Shop, School, Errands, Recreation |
Work | Recreation, Tourism |
Goods, Movement |
Multiple |
| General Trip Length | |||||
| Short (less than 5 miles) | X | X | |||
| Medium (5-30 miles) | X | X | X | X | |
| Long (more than 30 miles) | X | X | X | X | |
| Trip Type | |||||
| Internal | X | X | |||
| Regional | X | X | X | X | |
| Interregional | X | X | X | X | X |
| Interregional-Through | X | X | X | ||
| 2010 | 2035 | 2040 | 2050 | |
|---|---|---|---|---|
| Internal | 38.3% | 30.1% | 30.7% | 28.9% |
| Regional | 41.1% | 46.8% | 47.0% | 47.8% |
| Interregional | 19.4% | 21.2% | 21.1% | 22.0% |
| Interregional-Through | 1.2% | 1.2% | 1.2% | 1.3% |
3A.1.1.3 Growth in the Corridor
Deficiency: Population and Employment Growth Greatly Outpaces Capacity Growth.
Transportation facilities in the NCC were developed when there were significantly fewer people living and working in the corridor and region, and little infrastructure expansion has occurred over the past 40 years to accommodate the increase in travel resulting from population growth.
The growth forecasts, including those contained in the 2050 Regional Transportation Plan and Sustainable Communities Strategy (2050 RTP), project that the population of the San Diego region will grow significantly in the coming decades, which will spur related growth in housing, employment, and travel demand. Between 2010 and 2040, the region is expected to add nearly one million new residents-a 29% increase. Those new residents will result in demand for over 300,000 new housing units (a 27% increase) and the creation of approximately 400,000 new jobs (a 28% increase).8 To accommodate this influx, SANDAG and the local governments have implemented a Smart Growth land use strategy that seeks to increase population density, reduce vehicle miles traveled, and curb greenhouse gas emissions (see Chapter 2 and Section 3A.2.1).
Population Growth
I-5 was originally built as an eight-lane freeway in the late 1960s and 1970s and has not had any major improvements to keep pace with the significant population, employment, and travel-demand growth in the corridor over the last 40 years. During the period from 1970 to 2010, San Diego County more than doubled in population to over 3 million residents (Table 3A-6). The NCC coastal communities grew at least two- to three-fold, with several NCC communities swelling to five or ten times their 1970 populations. Over 500,000 people now reside within the NCC, which represents approximately 16% of the San Diego region's population. An additional 123,000 people are anticipated to reside in the NCC by the year 2040. In addition, there are approximately 204,000 housing units in the NCC with an additional 32,000 housing units expected to be constructed by 2040-a 15% increase.9
| Jurisdiction | 1970 | 2010 | 2040 | Change: 1970 to 2010 |
Change: 2010 to 2040 |
|---|---|---|---|---|---|
| Oceanside | 40,494 | 179,105 | 214,530 | 342% | 20% |
| Carlsbad | 14,944 | 103,491 | 127,434 | 593% | 23% |
| Encinitas | 17,210 | 64,599 | 75,446 | 275% | 17% |
| Solana Beach | 5,744 | 13,338 | 15,619 | 132% | 17% |
| Del Mar | 3,956 | 4,455 | 5,059 | 13% | 14% |
| San Diego (NCC only) | 23,315 | 160,290 | 209,744 | 597% | 31% |
| North Coast Corridor | 105,663 | 525,278 | 647,832 | 397% | 23% |
| San Diego County | 1,357,854 | 3,224,432 | 4,163,688 | 137% | 29% |
Interregional travel demand is influenced by growth in surrounding regions. The populations of Riverside County, Imperial County, and Baja California, Mexico, increased at significantly greater rates than San Diego County from 1970 to 2010, with Orange County close behind (Table 3A-7). The population of these neighboring regions is anticipated to increase substantially by the year 2040, with some regions nearly doubling in size. Like San Diego County, these regions depend on I-5 and the LOSSAN rail corridor to move people and goods to and through the NCC.
| Jurisdiction | 1970 (millions) |
2010 (millions) |
2040 (millions) |
Change: 1970 to 2010 |
Change: 1970 to 2040 |
|---|---|---|---|---|---|
| Orange County | 1.42 | 3.01 | 3.85 | 112% | 28% |
| Riverside County | 0.46 | 2.19 | 4.10 | 376% | 87% |
| Imperial County | 0.07 | 0.17 | 0.33 | 149% | 94% |
| San Diego County | 1.36 | 3.22 | 4.16 | 137% | 29% |
| Baja California, Mexico | 0.87 | 3.25 | 5.36 | 273% | 65% |
Employment Growth
Employment within the NCC is primarily located along established transportation routes or concentrated into large activity/employment centers. Employment in the NCC has seen staggering growth since 1970-an increase of over 1,000% in corridor jobs (Table 3A-8). A considerable portion of the employment is located in the city of San Diego, with much of the growth occurring within Sorrento Valley, Sorrento Mesa, the University City/Golden Triangle area, and at the University of California, San Diego campus. Employment growth in the corridor is projected to continue within these established employment centers, as well as in burgeoning new areas of east Carlsbad and Oceanside.
| Jurisdiction | 1970 | 2010 | 2040 | Change: 1970 to 2010 |
Change: 2010 to 2040 |
|---|---|---|---|---|---|
| Oceanside | 12,040 | 41,620 | 60,337 | 246% | 45% |
| Carlsbad | 1,779 | 59,274 | 86,538 | 3,232% | 41% |
| Encinitas | 3,151 | 25,633 | 31,080 | 713% | 21% |
| Solana Beach | 1,050 | 7,099 | 8,671 | 576% | 22% |
| Del Mar | 1,004 | 3,895 | 4,690 | 288% | 20% |
| San Diego (city) | 2,832 | 140,763 | 170,209 | 4,870% | 21% |
| Total: | 21,856 | 278,284 | 358,565 | 1,173% | 29% |
Growth in Trip Making and Travel Demand
Deficiency: Travel Demand Greatly Outpaces Growth in Population, Employment, and Capacity
Travel demand on I-5 in the NCC has grown considerably since the current eight-lane facility opened in the late 1960s, significantly outpacing the growth in both population and employment. Highway capacity and infrastructure has not kept pace with these growth patterns over the last 40 years.
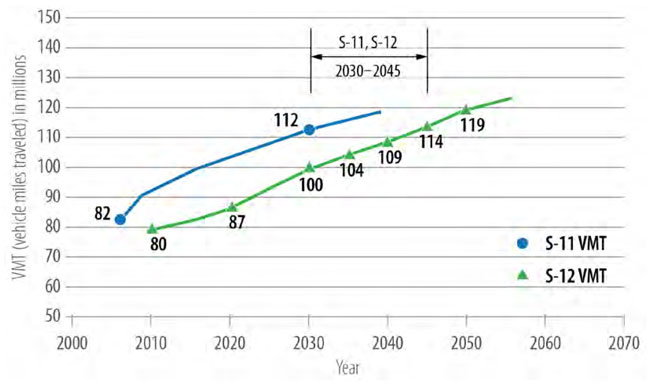
Population and employment growth tell only part of the story. While population has grown significantly in the region since 1970, vehicle miles traveled (VMT) have grown at an even faster rate. This indicates that people today are making more trips-and covering longer distances-than they were in 1970. This trend is prevalent in regions throughout the US as well as the NCC (Figure 3A-2). While the corridor experienced a decrease in VMT between 2005 and 2010, which is largely attributed to the economic downturn, VMT began to rebound in 2010 and is projected to continue its historical trend of rapid growth.

The historical growth in travel demand is even larger when examining the number of trips taken. Table 3A-9 shows historic, existing, and projected daily trips on selected segments of I-5 in the NCC (projections are for the No Build Alternative in which no improvements are made to I-5). Between I-805 and Carmel Valley Road, for example, daily trips increased by 528% from 1970 to 2010-a much higher growth rate than the 397% increase in corridor population over the same period. By 2040, this figure is expected to increase by another 32%, which greatly outpaces the projected 23% growth in corridor population over the same period. This means that the strain on the transportation system will compound quickly without significant improvements.
| I-5 Segment | 1970 | 2010 | 2040 (No build) |
% Change (1970-2010) |
% Change (2010-2040) |
|---|---|---|---|---|---|
| I-805 to Carmel Valley Rd. | 48,000 | 301,500 | 399,000 | 528% | 32% |
| Encinitas Blvd. to Leucadia Blvd. | 43,000 | 209,500 | 280,900 | 387% | 34% |
| Mission Ave. to SR-76 | 49,000 | 159,000 | 203,300 | 224% | 28% |
3A.1.2 Transit Deficiencies
Transit services in the NCC are relatively robust for an area of mostly low-density suburban development. However, the NCC still produces comparatively low transit ridership, resulting not just from its auto-oriented development patterns and local demographics but also from the many constraints on the transit system itself.
3A.1.2.1 Land Use Constraints
Deficiency: Low-Density Land Use Inhibits Successful Transit
The NCC's suburban, low-density development patterns make transit uncompetitive with the private automobile for most trips.
Transit works best when large numbers of people are traveling from the same starting point at the same time to the same destination. Transit struggles to attract riders in places like the NCC, where the population is dispersed and trip origins and destinations are widely varied-a modern development pattern that is promoted, and best facilitated, by the automobile. Rail transit is generally designed to serve long-distance and commute trips with origins and destinations that are inside the travel shed of the rail stations (i.e., more dense population and employment centers). Short local trips generally are not well served by the longer-distance spacing of rail stations, interregional trip destinations generally extend beyond the rail station service area, and recreational trips have group travel and baggage needs that make using transit less efficient or convenient.
While the NCC's local bus system covers most major arterial roads in the corridor, the area's topographic constraints and circuitous and discontinuous street network make it difficult to route buses close enough to most residences and businesses to provide convenient access. For many trips, bus stops are located beyond practical walking distance. This access deficiency between transit and the trip origin or destination is referred to as the "first mile" or "last mile" gap, and is often cited as the reason that more people do not ride transit: It can get riders close, but not close enough, for many trips.
Studies have indicated a range of thresholds for transit-supportive residential densities, but one common reference, based on a review of transit-oriented development guidelines across the U.S., indicates that thresholds of 7 dwelling units per acre are necessary to support basic bus service, 15 dwelling units per acre for premium bus service, and 20-30 dwelling units per acre for rail services.Figure 3A-3 provides visual examples of these development patterns.10

Source: Visualizing Density," Lincoln Institute of Land Policy, 2007.
The low-density development pattern in the NCC results in very few concentrated areas of population that could support high-frequency transit service. To create a transit-supportive environment and increase walking access to transit, the land use pattern in the NCC would need to be completely transformed: not only tripling residential densities but also redeveloping communities with more walkable, grid-like, better-connected local street networks. While targeted areas of Smart Growth have been identified in the corridor, most of its built environment stems from a time when local land-use decisions supported low-density, single-use development. As such, suburban, single-family residential homes make up the majority of housing stock in the NCC, with typical densities under 7 dwelling units per acre and only a few pockets of higher densities. Given the built-out nature of the corridor as well as the local cities' adopted land use plans and Local Coastal Programs, large-scale land-use changes are highly unlikely. This pattern, therefore, is projected to remain through 2050, while densities in other areas of the region will continue to intensify.11
3A.1.2.2 Employment Constraints
Like many sprawling metropolitan areas, the San Diego region lacks a single dominant employment center. Regional employment is spread widely, with the top four centers of job concentration being University City/Golden Triangle, Kearny Mesa, downtown San Diego, and Mira Mesa. If the jobs of NCC residents were all concentrated in these areas, a large percentage of commuters might be able to take advantage of transit services. However, this is not the case; despite being the largest job centers in the region, in 2008 only 6% of jobs were located in University City, with even smaller proportions in Kearny Mesa (5.8%), downtown San Diego (5.2%), and Mira Mesa (5.1%).12 In addition, the share of jobs in each of these communities is expected to decline even further in the coming decades.
When commuters leave the NCC, they travel to jobs that are scattered throughout the region, often in auto-dependent locations with an abundance of free parking. The land-use patterns in the vast majority of San Diego's employment communities are characterized by low-density and/or business park development with limited pedestrian accommodations (which are essential enablers of transit service, since all transit riders are pedestrians for some part of their trips). The absence of large, concentrated, and growing employment centers-and the ongoing trend of employment dispersal-highlight the challenge of providing efficient transit service for commute trips in the NCC area.
3A.1.2.3 Trip-Characteristic Constraints
As noted earlier in this chapter, a significant portion of trips in the NCC are internal to the corridor, and many of these trips are often only a few miles in length-to include local errands and rides to work or school. These types of trips are difficult to capture with transit in all but the densest areas, since the access and waiting times for buses generally cannot compete with the automobile for such short distances, particularly in the NCC where most residents have a car available to make the trip. In addition, the tendency of travelers to "link" several local trips into a single voyage-such as leaving work, buying groceries, and picking up children from school-greatly multiplies the time advantages of driving over transit. Finally, many of these short local trips involve shopping, errands, or other cargo-intensive purposes that are not well suited for transit. Taken together, these factors result in a local population that generally does not choose transit over driving.
3A.1.2.4 LOSSAN Rail Corridor Capacity Constraints
Deficiency: Limited Capacity on LOSSAN Rail Corridor
Single-track railway in nearly half of the LOSSAN corridor results in longer travel times, degrades on-time performance, and limits the number of trains that can operate in the corridor at any one time. These factors greatly hinder rail service from meeting growing passenger demand.
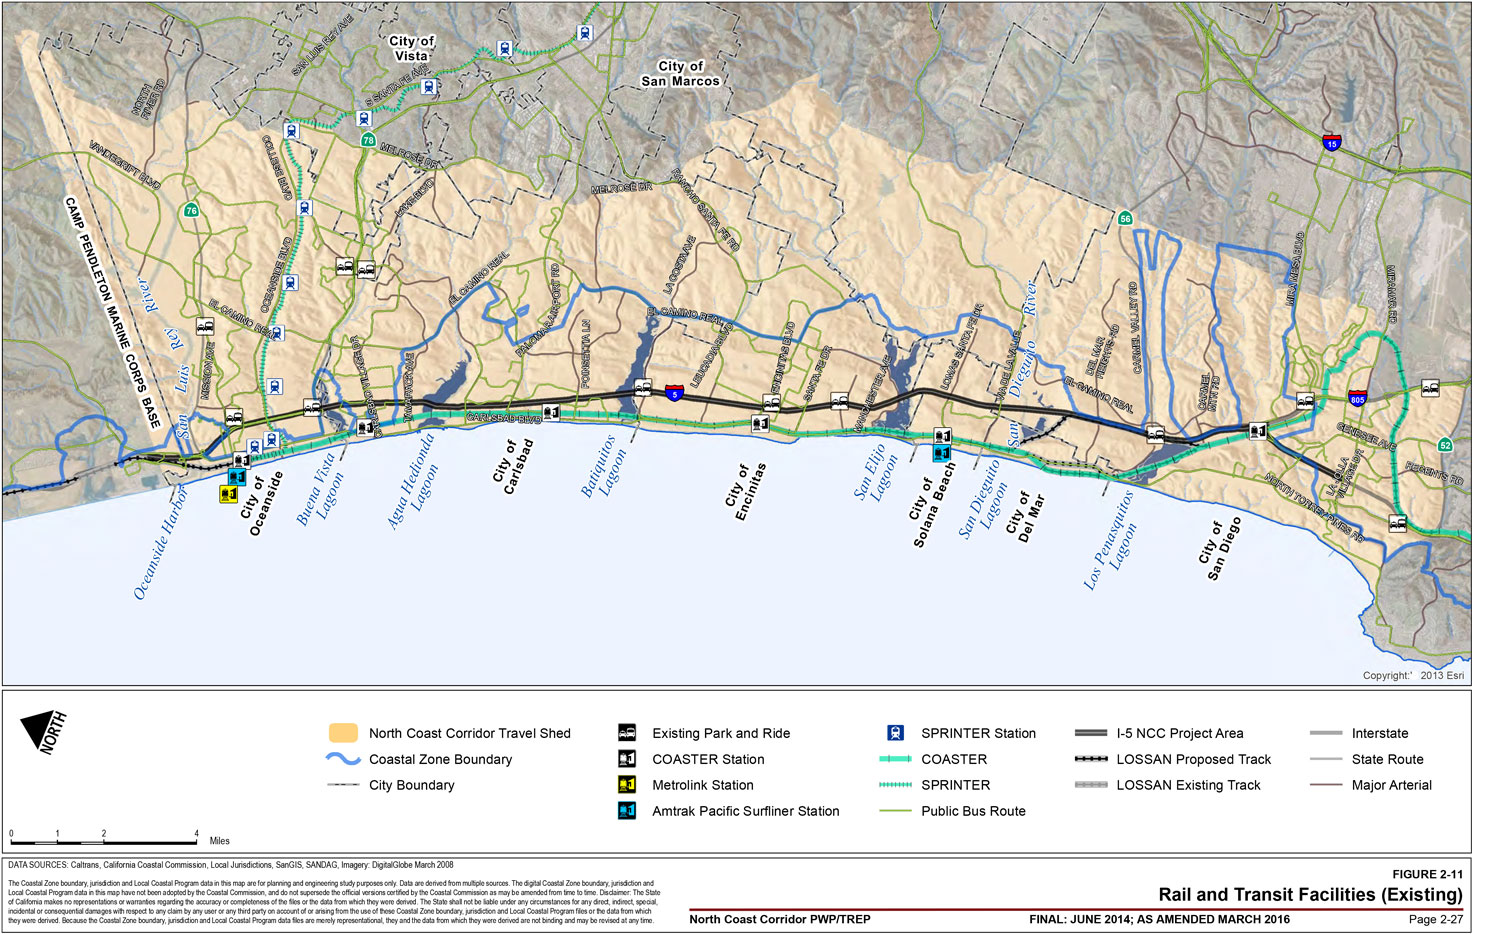
The NCC is a multimodal corridor that includes alternatives to automobile travel. In particular, the San Diego segment of the LOSSAN rail corridor provides COASTER commuter rail and Amtrak intercity passenger rail services in San Diego County and connects with Los Angeles-based Metrolink commuter rail and SPRINTER light rail at the Oceanside Transit Center (Figure 3A-4). While the vast majority of trips in the NCC will continue to be by auto through 2040 and beyond, addressing deficiencies and constraints on the existing rail corridor enhances the rail alternative and improves access and mobility along San Diego's north coast.
Growth in corridor travel is reflected in plans for increased rail service. Measuring travel in both directions, the COASTER trains currently connect Oceanside and downtown San Diego 22-26 times each weekday, plus 8-12 times per day on weekends. By 2030, COASTER commuter rail operations are expected to increase to 54 trains each weekday as well as increased weekend service. Similarly, 12 new Amtrak trips per day (in addition to the 22 that currently occur) are planned by 2030 to accommodate the projected increase in travel demand. Finally, Metrolink's operations from the Los Angeles area to Oceanside are expected to increase from 16-weekday trips to 20 by 2030 with new weekend service also planned.
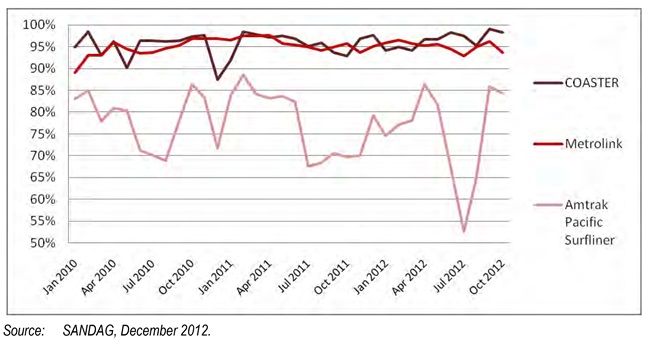
With four rail operators sharing the LOSSAN corridor-COASTER, Amtrak, Metrolink, and freight carrier BNSF Railway-passenger rail services along the corridor, including the NCC segments, are constrained by infrastructure that is significantly undersized for the volumes of traffic it accommodates. As shown in Figure 3A-5, 46% of the existing rail corridor in the NCC consists of single-track railway. These single-track sections greatly constrain the movement of trains through the corridor as trains must stop and wait at scheduled meets to allow for passing. Not only do these scheduled meets increase trip time for travelers, if one train experiences an unscheduled delay, it ripples throughout the corridor, affecting the schedules and on-time performance of other trains on the tracks. The result is relatively poor and unpredictable on-time performance on the LOSSAN rail corridor, particularly for Amtrak services, which have lower track priority than the COASTER (Figure 3A-6). Poor and unpredictable on-time performance deters people from choosing rail for trips in which it otherwise could be an acceptable option.
The single-track sections also limit the number of trains that can use the tracks at any given time, capping passenger capacity in the corridor. COASTER service operates every 30-45 minutes in the peak-period peak direction while Amtrak operates approximately hourly in the peak-period peak direction. With the addition of Metrolink and periodic BNSF freight service, the number of train trips during peak periods in the corridor is near capacity under current track conditions. The inability to increase service frequency on passenger rail reduces the attractiveness of rail as a viable transportation alternative in the NCC for many trips that require greater flexibility in travel-time choices. It also constrains the economic growth of freight rail service.

3A.1.2.5 LOSSAN Rail Corridor Access Constraints
Deficiency: Inadequate Access and Parking at Rail Stations
Most access to rail stations in the corridor is currently accomplished by car, and parking demand exceeds supply at most stations.
In attempting to improve the rail system so that it can capture more trips in the NCC, track capacity is only one of several essential factors; it is also essential to provide potential new riders with easy and reliable access to the stations. The area's low-density land-use patterns mean that relatively few people are within an efficient walk, bike and transit distance to COASTER stations; as shown in Figure 3A-7, more than half the residences in the corridor are located farther than 5 miles from rail stations (and many are closer to I-5 than the rail corridor). This results in most passengers accessing LOSSAN rail stations in the NCC by private automobile. During the morning peak period, on average, 63% of passengers boarding the COASTER at stations within the NCC drive alone and park at one of the stations.15 Combined with those who carpooled or were dropped off, 80% of NCC COASTER commuters arrive at the station by car. Relatively few passengers walk, bike, or take local transit buses to the stations, even though 17 local bus routes connect to them (Table 3A-10). To change this, corridor land uses would need to become much more transit-friendly (concentrated, higher-density development, with mixed uses and widespread pedestrian facilities) to achieve a significant shift in the way that users access to rail. However, most of the corridor is already built out, and existing land-use policies in the NCC cities' Local Coastal Programs (LCPs) generally support the current development patterns.

| Station | Rails and Intercity Services | Feeder-Bus Access | Parking Spaces | Average Weekday Utilization |
|---|---|---|---|---|
| Oceanside | COASTER, Amtrak, SPRINTER, Metrolink, Greyhound | Routes 101, 302, 303, 313, 318, 395, RTA Route 202 (Operates from Riverside County to the Oceanside Transit Center) | 1,259 | 71% |
| Carlsbad Village | COASTER | Routes 101, 325 | 540 | 90% |
| Carlsbad Poinsettia | COASTER | Routes 101, 444, 445, 446 | 335 | 97% |
| Encinitas | COASTER | Routes 101, 304, 309 | 309 | 98% |
| Solana Beach | COASTER, Amtrak | Routes 101, 308 | 326 | 95% |
| Sorrento Valley | COASTER | Routes 972, 973, 978, 979 | 118 | 73% |
Assuming the corridor does not undergo wholesale redevelopment and most users continue to access rail by driving, a significant increase in ridership would require similar increases in the parking capacities at rail stations. While parking has expanded in recent years at the Encinitas, Oceanside and Carlsbad Village stations, insufficient parking in the rest of the corridor continues to inhibit many potential passengers from using rail corridor services. Table 3A-10 shows the current COASTER parking supply and utilization rates, reflecting approximately 2,800 parking spaces at NCC stations. On average, all of the COASTER station parking lots except Oceanside and Sorrento Valley are at least 90% full on weekdays, with several exceeding 95%. This constraint not only limits the number of people who can access the stations by automobile, but it also creates uncertainty among potential new riders, who might wish to commute via rail but cannot rely on parking being available every day. This lack of parking capacity, therefore, serves as a barrier to increased ridership.
Even if increased feeder-bus service is able to capture some trips to COASTER stations, the many inherent limitations to transit in the NCC mean that the automobile will continue to be the dominant mode of access to rail stations; therefore, further gains in ridership will require the construction of new, multi-level parking structures with thousands of parking spaces, rather than the surface parking lots with hundreds of spaces that currently exist. This would mean thousands of additional vehicles accessing parking via local streets, with significant implications for local communities and coastal access, as well as possible conflicts with LCPs.
3A.1.2.6 Local/Feeder-Bus Constraints
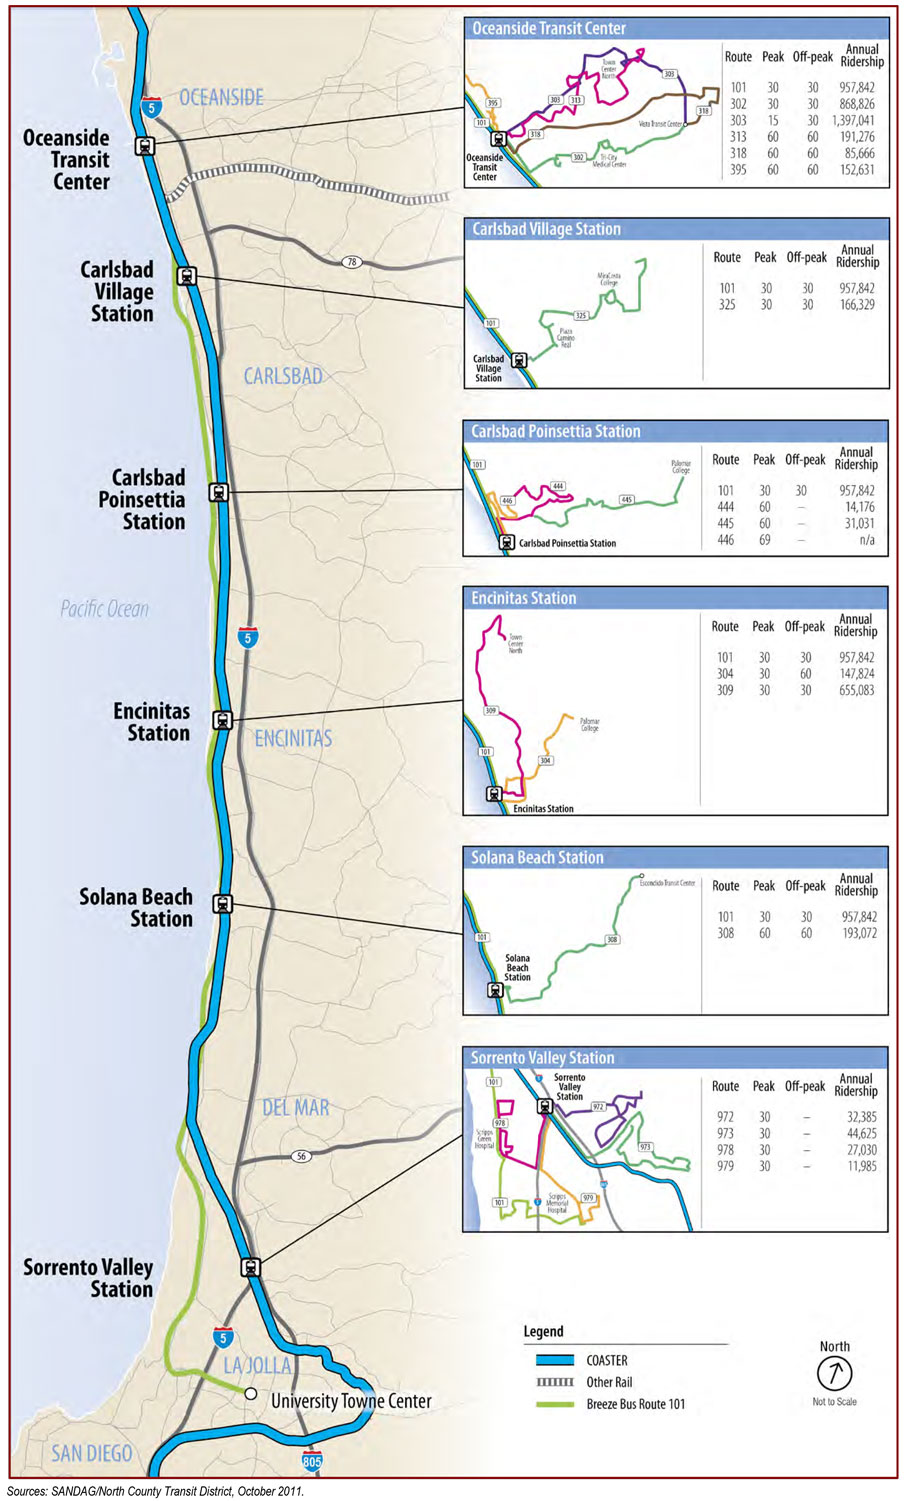
Another way to provide increased access to NCC rail stations could be through enhancement of the existing feeder-bus services. Figure 3A-8 shows the existing bus routes that serve NCC COASTER stations, including publicly provided COASTER Connection shuttles at the Sorrento Valley and Carlsbad Poinsettia stations. Taken together, these routes cover most of the major arterials and activity centers in the corridor, leaving few viable options for new direct feeder-bus routes. However, due to the low-density suburban development that pervades the NCC, only 51% of households are within one-half mile of a bus stop, compared to 66% of households across the region and 73% in the SANDAG-defined urbanized area.16 This demonstrates the considerable difficulty of providing transit service in suburban areas, where residences are spread out and automobile travel has a considerable advantage.
The existing local bus services operate at low to moderate frequencies, reflecting the relatively moderate ridership demand typical of low-density areas (compared to the denser central core areas). While improved frequencies would likely attract more riders, any increases in ridership (and accompanying fares) would not offset the increases in costs associated with providing more service. The result is likely to be that operating subsidies would increase at a faster rate than ridership. These increased subsidies would need to come from somewhere, and given the limited public operating funding available to transit agencies, the likely place would be through the elimination of services elsewhere in the region. While the revenue generated from fee-paying single-occupancy vehicle (SOV) travel on the I-5 Express Lanes could contribute to bus transit operating costs in the corridor, this revenue source is not projected to be sufficient to subsidize significant increases in both local bus service frequency and new bus rapid transit (BRT) services in the corridor. As noted in Section 3A.1.2.8, passenger fares cover less than half the cost of providing transit services in the region, meaning that significant subsidies are required to fund existing and new services. In the fiscal year 2012, North County Transit District's (NCTD) local bus services required approximately $30 million in annual operating subsidies.17 Because funding is scarce, regional decision-makers must make prudent decisions on where and how to provide transit service that balances access with cost-effective returns on investment to ensure that the transit system is sustainable over time. Local bus service is planned on a short-term basis in order to remain flexible to changes in funding and ridership, and while improvements in local bus transit service are anticipated in the NCC over the next 40 years, there will always be limits on the feasibility of investment.18
In evaluating the benefits of enhancing bus service in the NCC, it is also important to consider the likelihood that users will use the enhanced services to make their trips. Even if the region invested extremely heavily in buses to provide high-frequency coverage in every area of the corridor, the decision on whether to use transit ultimately is up to the individual traveler. By definition, a feeder bus requires the passenger to transfer between bus and rail during their trip, adding more time and an extra logistical layer to the transit experience relative to driving. In 2000, a comprehensive survey of regional residents confirmed the long-held belief among transportation experts that this "transfer penalty" is a significant barrier to transit use, especially among those who already have access to cars.19 Therefore it is unlikely that enhanced bus service, even if implemented to the maximum extent, will supplant the automobile as the mode of choice for the majority of NCC travelers.
3A.1.2.7 BRT and Rapid Bus Constraints
The NCC does not have any BRT, rapid bus, or high-frequency local bus services. Since, by definition, BRT operates on a congestion-free right-of-way that connects concentrated areas of population and employment, successful BRT depends wholly on implementing separated, congestion-free facilities (like the Express Lanes planned for I-5 in the NCC). Rapid bus service generally operates on major arterial streets that include infrastructure and facilities that reduce bus delays, increase bus travel speeds, and enhance bus stops with passenger amenities. These facilities can include dedicated bus lanes, street-lane striping (which allows buses to move ahead of stopped traffic at signalized intersections), traffic signal priority (which provides buses with a green light a few seconds ahead of adjacent automobiles), and enhanced shelters and real-time bus-arrival information at stops. In addition, rapid bus service generally includes a high level of service frequency (10 minutes or better). In locations where roadway constraints or characteristics cannot fully accommodate the rapid bus concept, improvements to local bus routes can often include select rapid bus features.
Implementation of BRT and improvements to local bus services are planned in the corridor over the next 40 years, including potential implementation of rapid bus features. But like local bus service, extensive investment in BRT or other bus service and infrastructure improvements in the NCC is constrained by the low land-use densities with few areas of concentrated populations, the challenging topography and circuitous street network that make providing direct and efficient service difficult, and limited funding. The reverse-commute BRT planned for the I-5 Express Lanes targets the peak-period commute trip between the high-density Mid-City residential area in central San Diego and the Palomar Airport Road business park in the NCC. There are other opportunities in the NCC to link dense population and employment centers. However, a BRT route between Oceanside and University City in San Diego utilizing the I-5 Express Lanes that were evaluated during the development of the 2050 RTP failed to generate enough projected ridership from NCC residents to withstand the regional screening process for allocation of scarce resources. Nevertheless, implementation of this project and others will continue to be evaluated for feasibility in future RTPs.
The 2050 RTP also identifies Coast Highway through the NCC as an appropriate corridor for enhancements to existing local bus service through the implementation of incremental rapid bus features. While it is feasible that some other local bus routes could evolve into rapid bus services, to justify the capital investment in specialized traffic signals, street reconfigurations, enhanced bus stops and additional vehicles, and the operating investment in more frequent service necessary to convert to a rapid bus, these routes require consistent activity and population concentrations along their paths-something that many major arterials in the NCC lack.
3A.1.2.8 Funding Constraints
As discussed in Chapter 2, SANDAG needs to focus a large portion of its transit investment in areas where transit services are most likely to succeed: the region's higher-density, mixed-use, pedestrian-friendly communities. However, while the NCC lacks many of the transit-supportive characteristics of some of the region's central core communities, the 2050 RTP still includes significant investment in LOSSAN rail, BRT, and local bus infrastructure and service in the corridor-a level of investment that, compared to the more urbanized areas of the region, is somewhat disproportionate to its relatively lower ridership returns. Through the 2050 RTP, SANDAG has opted for a balanced system that provides transit access throughout the urban area, while simultaneously achieving regional and state goals. Tipping this balance to allocate additional regional transit resources to the NCC above what is identified in the 2050 RTP would come at the expense of regional transit ridership and other objectives.
In addition, providing one-time capital investment in transit infrastructure is only part of the solution for improving transit in a region or corridor: Transit also requires continuous operating funding to keep services going. Like every other city and region in the U.S. (and most of the world), transit operations are subsidized heavily by local, regional, and national governments. In the San Diego region, passenger fares cover less than half the cost of providing service (and much less for the COASTER), meaning that public subsidies pay for the majority of transit operations.20 This operating funding is scarce and diminishing, which greatly limits the region's ability to increase transit services; such scarcity requires difficult decisions to be made on how to allocate the region's resources, both to maximize returns on investment and to ensure fiscal sustainability. Through its 2050 RTP, SANDAG has adopted a prudent balance between expanding transit access and maintaining an efficient regional transit system that can be sustained.
3A.1.3 Highway Deficiencies
As population and corresponding travel has grown, traffic conditions have deteriorated both in the NCC and across the region. In its annual report on the San Diego region, the Texas Transportation Institute estimated that the average delay per peak-period driver was 38 person-hours per year in 2010-up from 8 hours in 1982.21 The same report estimated that the combined economic cost of this delay for all regional travelers was over $1.5 billion annually. Within the NCC, periods of congestion on I-5 have grown in a similar fashion, increasing the duration of congestion throughout the day and lengthening travel times for motorists by up to 50% over free-flow levels. These conditions inhibit mobility, impair economic productivity, and limit access to NCC resources; without improvements, they will continue to deteriorate as growth continues. This means further increases in travel times, longer periods of daily congestion, and higher costs for all travelers.
The worst road congestion generally occurs during peak periods, but over time the duration of these congested periods has increased, reflecting the increasing travel demand in the corridor. While congestion appears on both weekdays and weekends, these two periods often feature different types of trips and travelers
3A.1.3.1 Existing Weekday and Peak-Period Highway Travel
Deficiency: Consistently Heavy Weekday Highway Congestion
Weekday peak-period highway travel demand in the NCC exceeds current capacity, resulting in a breakdown of the transportation system, impediments to travel (such as long and unpredictable travel times), and constraints on access to coastal areas and resources. In the NCC, highway travel demand is projected to increase with or without planned highway improvements (and with planned improvements to the rail corridor). Failure to accommodate the projected increase in travel demand will result in an ongoing degradation of mobility and access in the corridor, particularly for peak-period commute trips.
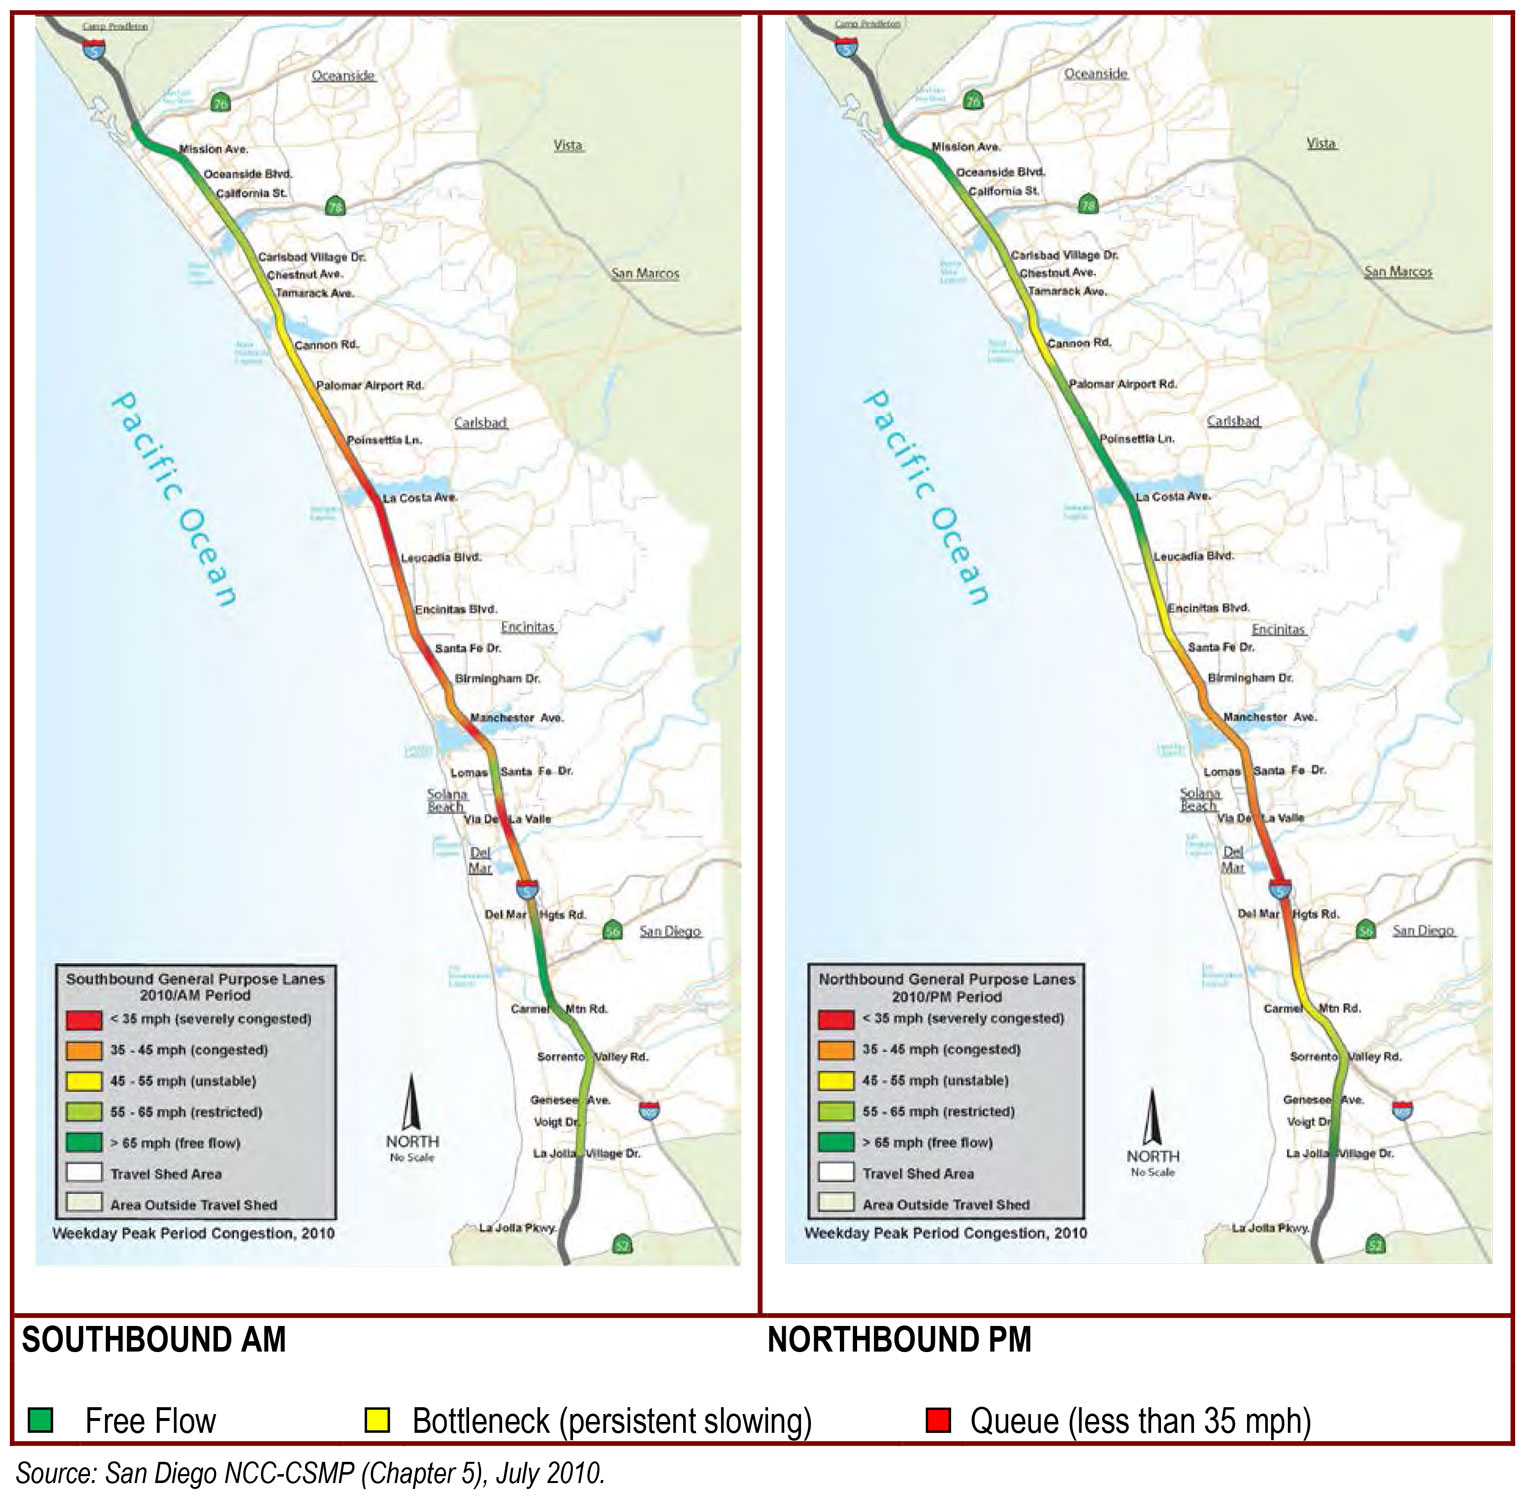
The existing freeway facility is at capacity during peak periods, resulting in significant congestion and travel delays. On most highways, peak-period congestion applies to a single direction of travel, such as a morning peak period heading into downtown and an afternoon peak period heading out of downtown. Southbound I-5, however, experiences two peak periods during the day: Congestion occurs for an average of 5 hours in both the morning and afternoon peak periods (Figure 3A-9). (Also shown in the figure are the effects of the economic recession of 2008-2009, during which congestion and travel times temporarily decreased; these began increasing toward pre-recession levels in 2010.)
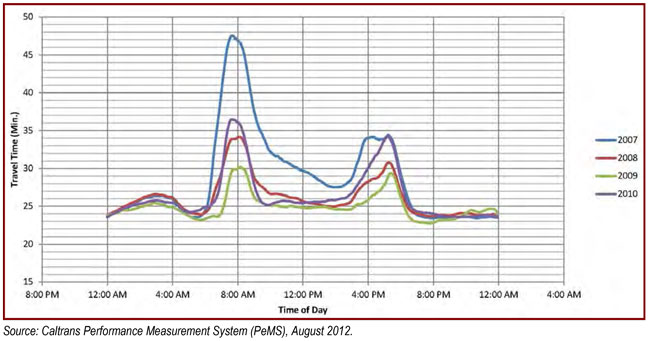
As shown in Table 3A-11, during uncongested periods it takes an average of 23-25 minutes to drive the 27 miles in either direction on I-5 between Harbor Drive at the north end of the corridor and La Jolla Village Drive at the south end. During the peak periods, mean southbound travel time increases to up to 34 minutes in the afternoon and 36 minutes in the morning. Northbound average travel time increases to up to 34 minutes during the afternoon peak period. This peak-period congestion and travel-time degradation are compounded by the multi-purpose nature of this highway that serves not only high volumes of commuter trips, but also recreational, regional, interregional, and short-distance local trips.
| Direction | Uncongested Conditions | AM Peak Hours | PM Peak Hours |
|---|---|---|---|
| Northbound | 23 minutes | 23 minutes | 34 minutes |
| Southbound | 23-25 minutes | 36 minutes | 34 minutes |
When considering the amount of time lost due to congestion, these average travel times tell only part of the story. Individual travel times fluctuate widely based on day-to-day traffic conditions-sometimes longer than the average, sometimes shorter-which results in unreliable travel for all motorists. As Figure 3A-10 shows, while the peak-period travel time on southbound I-5 generally averages between 30 and 40 minutes, it can be as high as 78 minutes on the most heavily congested days.

The concept of travel reliability focuses on this unpredictability by accounting for the wide distribution of travel times that are known to occur and measuring the amount of additional time (called "buffer time") that would be needed to guarantee an on-time arrival 95% of the time. Figure 3A-11 presents mean travel and buffer times for travel through the I-5 NCC during peak periods. The bottom green portion of the graphs represents the average weekday (Tuesday through Thursday) travel times, and the top blue portion of the graphs represents the required "buffer time." Therefore, while the average northbound afternoon peak-period travel time can be up to 34 minutes, the unpredictability of congestion means that these travelers cannot simply plan for a 34-minute trip. Rather, a commuter traversing the NCC actually must allow up to 48 minutes to ensure on-time arrival. These "buffered" travel times reflect the true economic and personal costs of congestion borne by the region's residents, visitors, and businesses.
")
3A.1.3.2 Weekend Highway Travel
Deficiency: Consistently Heavy Weekend Highway Congestion
Like weekday peak periods, weekend highway travel demand in the NCC exceeds current capacity, resulting in impediments to travel such as long and unpredictable travel times, as well as constraints on access to coastal areas and resources. Highway travel demand is projected to increase in the NCC with or without planned highway improvements (and with planned improvements to the rail corridor). Failure to accommodate the projected increase in travel demand will result in an ongoing degradation of mobility and access in the corridor on weekends, particularly for recreational trips.
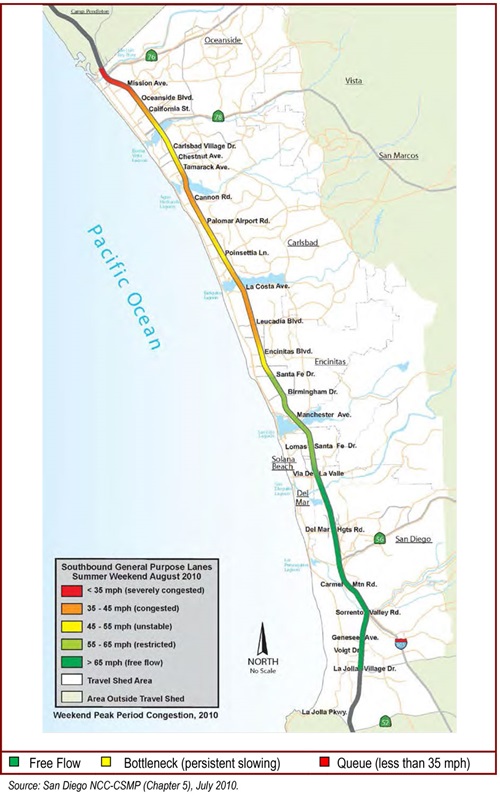
Unlike many other highways, I-5 in the NCC experiences significant congestion on weekends as well as on weekdays. During summer periods the weekend congestion can exceed the congestion experienced by travelers on weekdays. As the population has grown in the region, more people have sought access to corridor coastal resources, placing an increased demand on the region's transportation network during non-commute times as well as the traditional weekday peak hours. Projected growth in population, employment, and travel demand will further intensify the pressure on I-5 to provide reliable access to the coast. The beaches within the NCC attract millions of visitors per year. At the NCC's five-state beaches alone-without even considering the corridor's numerous other public beaches-there are over 7 million visitors per year, more than twice the population of the entire region (Table 3A-2).
Most of these coastal recreational trips in the NCC occur on weekends. The primary access route to the beach and other coastal recreational resources in the corridor for both locals and visitors is I-5. As will be discussed later in the section, corridor topography and the resulting street network limit access alternatives. Because of this high demand for beach and coastal access, weekend traffic on I-5 approaches and sometimes exceeds weekday levels. Figure 3A-13 shows the geographic extent of existing congestion and travel delay along the I-5 NCC during summer weekends in the northbound direction; this congestion persists for much of the day along nearly the entire length of the corridor. Southbound congestion on weekends is similarly prevalent.
HOVs comprise approximately 60% of weekend traffic on studied segments of I-5 in the NCC, which is significantly higher than their weekday proportion.22 Because, by definition, HOVs transport more people per vehicle than single-occupancy vehicles (SOVs), they provide a more efficient use of highway facilities. As a result, HOV lanes enhance freeway capacity by carrying a greater number of people than freeway general-purpose lanes. Even with the large percentage of HOVs using the I-5 NCC on summer weekends, traffic congestion persists, indicating that the freeway is carrying much larger volumes of people (versus autos) on weekends than weekdays.
3A.1.3.3 Limited Alternatives for Automobile Travel
Deficiency: Few Non-Highway Routes for Local Traffic
There are few alternatives to I-5 for local travel in the corridor due to the lack of parallel roadways and the sparse and circuitous arterial street network. This forces significant local traffic onto I-5, exacerbating congestion on a facility that was intended primarily to serve regional and interregional travel.
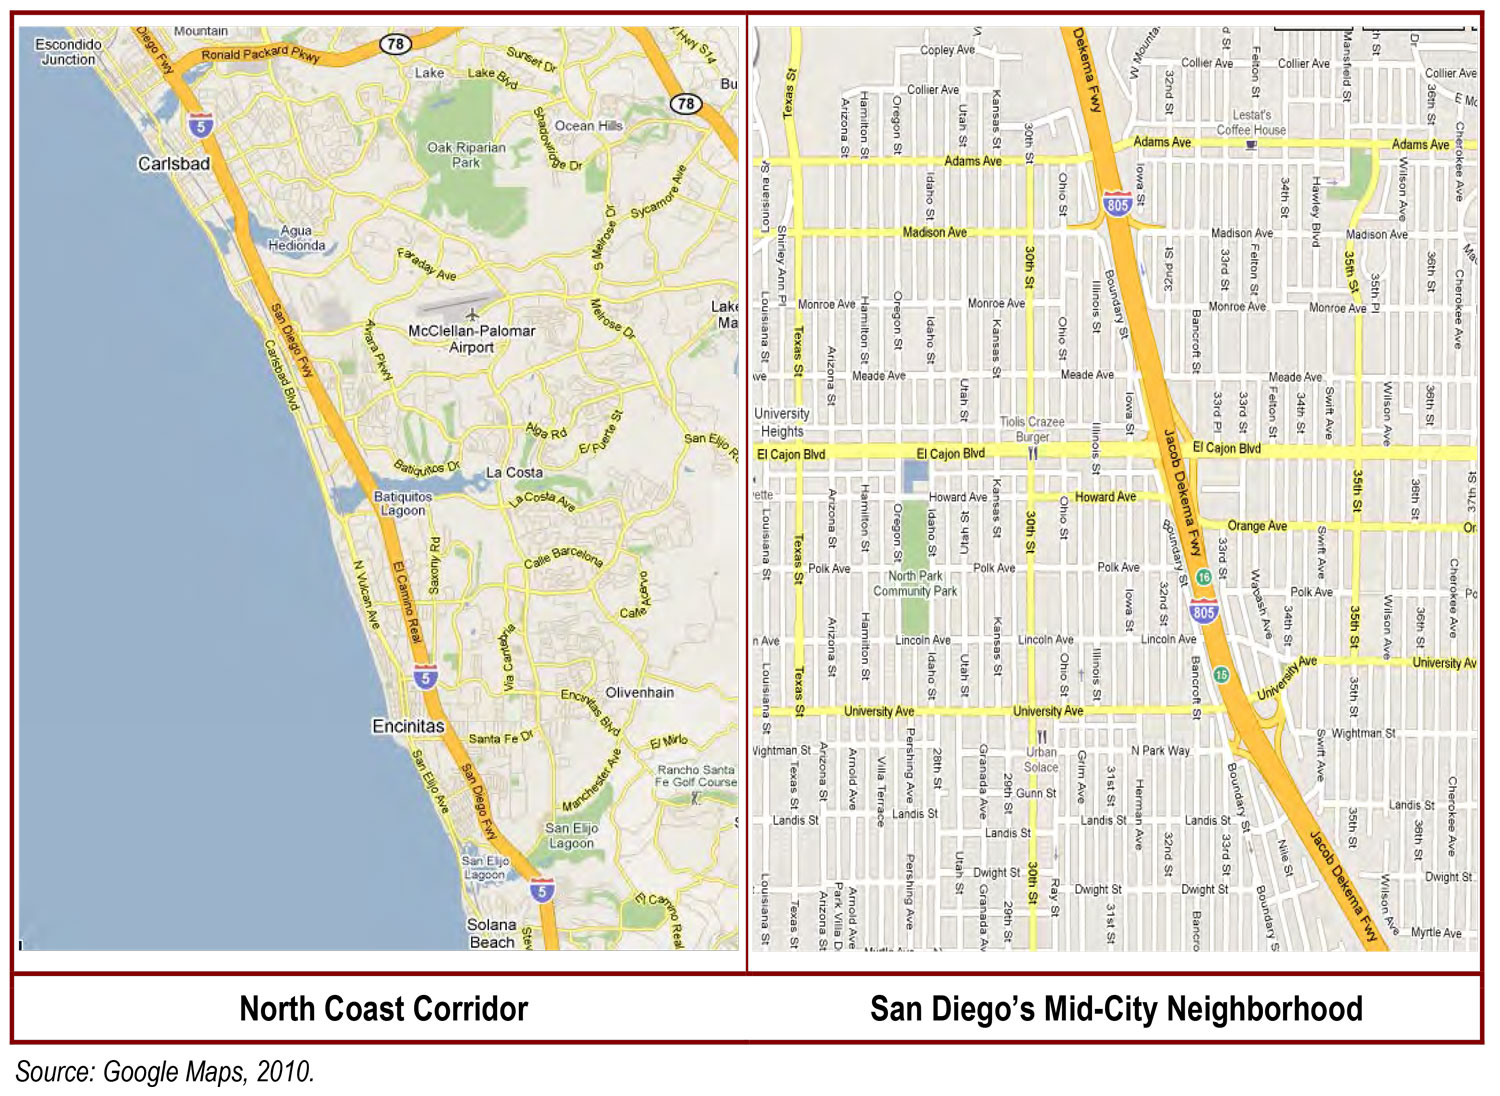
Automobile trips comprise over 95% of all commute trips in the NCC and I-5. As the most continuous and highest-capacity roadway in the corridor, I-5 is often the most desirable choice for both long-distance and local travelers.23 The default use of I-5 for short-distance local trips in the NCC compounds the demand on a facility that was intended primarily to serve regional and interregional travel. A key reason for the heavy use of I-5 for local trips is the lack of alternative routes for automobile travel in the corridor. The development of the local street network in the NCC has been restricted by topographical constraints that include hills, canyons, and six lagoons. As a result, the corridor arterial street network is sparse and circuitous, and the limited number of parallel arterial roadways in the corridor forces many local trips onto the freeway. These topographic and parallel street constraints are evident when the NCC's street network is compared to that of the Mid-City neighborhood of San Diego (Figure 3A-14). With its dense, grid-like pattern, the Mid-City street network provides far more local-trip route options and far greater access to and from the freeway than the streets of the NCC.
Coast Highway is the only parallel arterial road that extends the length of the NCC. This arterial is only one lane in each direction through most of Encinitas, and one lane southbound through Solana Beach. Moreover, most of the cities in the corridor are proceeding with "complete streets" projects on Coast Highway, which will provide for multimodal use and will include automobile-lane reductions in an effort to slow traffic and enhance the environment for pedestrians and bicyclists. These streetscape projects will promote non-automobile circulation, access to transit and coastal amenities, and quality of life in the corridor. However, they will also contribute to the lack of high-capacity, north-south roadways in the NCC and will likely divert even more traffic onto I-5, compounding the need for capacity enhancement on the highway.
3A.1.3.4 Persistent Highway Demand in the Future
Deficiency: Without Improvements, Highway Congestion Will Continue to Worsen
Travel demand on I-5 will continue to increase with or without improvements. If capacity is not enhanced to meet demand, the NCC will experience significant increases in the severity of congestion, the duration of congested periods, and the corridor travel time.
Within the NCC, existing and projected daily travel demand (VMT) on I-5 is shown in Table 3A-12. SANDAG and Caltrans produce travel demand forecasts every few years to support updates to the Regional Transportation Plan. Each forecast reflects a new horizon year (generally 10 years further out than the previous forecast) and incorporates projected population and employment growth, land-use changes, and transportation system enhancements for the forecast horizon. SANDAG also implements updates and improvements to its travel demand model with each new forecast.
| Existing 2006 | Existing 2010 | I-5 No Build 2030 |
I-5 No Build 2040 |
I-5 No Build % Change from Existing |
I-5 Build 2030 | I-5 Build 2040 | I-5 Build % Change from I-5 No Build |
|
|---|---|---|---|---|---|---|---|---|
| Daily VMT (Series 11) | 5.44 million | - | 7.05 million | - | 29.6% | 7.33 million | - | 4.0% |
| Daily VMT (Series 12) | - | 5.53 million | - | 6.47 million | 17.0% | - | 7.11 million | 9.9% |
During the planning process, SANDAG and Caltrans have produced two travel demand forecasts: the Series 11 forecast to a 2030 horizon year, and the Series 12 forecast to a 2040 horizon year. Both of these forecasts, which assume planned improvements to the parallel LOSSAN rail corridor, project significant growth in I-5 travel demand in the NCC of between 17% and 29% without the implementation of the NCC highway improvements (the No-Build Alternative). This significant No-Build Alternative growth projection indicates that travel demand (VMT) will occur regardless of whether highway-capacity improvements are made between today and the horizon years, and reveals that without any improvements, the highway will be unprepared to meet future demand. The No-Build Alternative will result in more chronically congested highways, significantly increased travel time, unpredictable and unreliable travel time, and increased emissions, impeding travel through the corridor and degrading access to coastal communities and resources.
Implementation of the NCC I-5 highway improvement project is projected to increase travel demand (VMT) by less than 10% over the No-Build Alternative (4.0% to 9.9% depending on model series and forecast year). This incremental difference between the No-Build and Build Alternatives are less a result of induced demand, and more a result of latent demand (i.e., improved access) and a shifting of travel from the parallel arterials of Coast Highway and El Camino Real to I-5 as travel becomes more efficient and reliable on I-5 and avoidance behavior is minimized.24 As discussed in Section 5.1.2, between the 2030 No Build and 2030 Build Alternatives, forecasts project respective reductions of 17% and 10% in VMT, and 12% and 3% in average daily traffic, on Coast Highway and El Camino Real with implementation of the I-5 highway improvements.25 The combined highway improvements and the resulting change in travel behavior will make corridor travel on both the highway and local streets more efficient and reliable, improving coastal access. Table 3A-13 shows corridor mean travel times under current and future conditions during peak periods. When I-5 is uncongested, it takes approximately 23-25 minutes to traverse the 27-mile route from La Jolla Village Drive in San Diego to Harbor Drive in Oceanside. This same northbound trip currently takes 34 minutes during the afternoon peak period and is expected to take a congestion-ridden 70 minutes by 2040 under the No-Build Alternative. The proposed improvements would address this future demand by increasing the operating effectiveness of the highway and enhancing mobility and access throughout the corridor.
As a result of increased travel times and reduced reliability on I-5, commuters will continue to experience work-trip delays, truck freight movements will be further affected, and access to coastal resources, activity centers, and facilities for residents and visitors will become increasingly difficult. Figure 3A-15 displays the projected geographic length of congestion and travel delay in the corridor in 2040 without any operational improvements or enhancements to the existing transportation capacity. Congestion would expand significantly as compared to the current conditions (Figure 3A-12) to the extent that the entire length of the corridor in both directions is projected to experience severe congestion and traffic delay during the peak periods by 2040.
In addition, if no improvements are made to I-5, forecasts indicate that the projected increases in average daily traffic (ADT) would extend the time duration of congestion in both the northbound and southbound directions. Currently, congestion lasts for 5 hours per day in both the northbound and southbound directions. By 2040, if no improvements are made to I-5, the duration of congestion will more than double, with northbound congestion forecast to extend to 9-10 hours and southbound congestion extending to 13 hours.26
| Time/Direction | 2010 | 2040 No Build |
|---|---|---|
| A.M. Peak Period / Northbound | 23 | 37 |
| A.M. Peak Period / Southbound | 36 | 54 |
| P.M. Peak Period / Northbound | 34 | 70 |
| P.M. Peak Period / Southbound | 34 | 40 |
Note:
The primary transportation analysis and forecasting tool that is used in the San Diego region is the SANDAG Regional Transportation Model (RTM). The RTM projects future travel demand on the region's transportation system by analyzing local land use as well as the projected growth in regional demographics such as population, employment, and housing. The Series 11 RTM, which was the basis for SANDAG's 2030 Regional Transportation Plan (RTP), projected regional travel demand to the year 2030 in metrics such as Vehicle Miles Traveled (VMT) and Average Daily Traffic (ADT). The subsequent Series 12 model, used to develop SANDAG's 2050 RTP, projected these data to the year 2050. Additionally, during the NCC planning process that led to the 2010 Draft PWP/TREP, a specialized micro-simulation model based on Series 11 data was developed to provide NCC-specific projections of corridor travel time and congestion for the year 2030.
A comparison of key measures from the Series 11 and Series 12 RTMs indicates that the Series 11 travel demand forecast for the year 2030 is generally equivalent to the updated Series 12 travel demand forecast for the years 2040-2045. In other words, the growth in both population and travel demand that had originally been anticipated by 2030 is now projected to occur at least a decade later than previously forecast.
In terms of regional demographics, projections underlying the Series 11 RTM showed that the region would add approximately 1 million people by 2030. However, the updated projections that contributed to the Series 12 RTM show that this growth will now occur around 2040.
In terms of travel demand, both VMT and ADT show similar patterns. The figure below demonstrates that the Series 11 regional VMT projection for 2030 is roughly equivalent to the Series 12 regional VMT projection for 2045.
Additionally, the ADT comparison below indicates that, at points along I-5 throughout the NCC, Series 12 projected ADT for 2040 is slightly lower than, or generally equivalent to, Series 11 projected ADT for 2030. (Series 12 projected ADT for 2050 is slightly higher than the 2040 projections, reflecting some growth beyond 2040.)
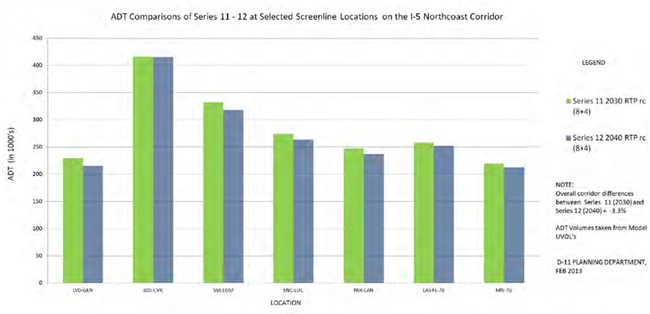
As a result of this comparison of regional population and travel demand between Series 11 and Series 12, it can be reasonably concluded that the 2030 travel time and congestion forecasts developed for the NCC under the Series 11-based micro-simulation model are valid forecasts for 2040 for the corridor, and therefore these two metrics are presented as 2040 forecasts in the PWP/TREP.

3A.1.3.5 Disincentives for HOVs and Transit
Deficiency: Lack of HOV Lanes Discourages HOV and Transit Use
The lack of HOV lanes in the majority of the corridor means that carpools, vanpools, and buses must operate in the same congestion as general traffic. This eliminates the major time incentive for travelers to choose HOVs or buses rather than driving alone.
The increased travel times and reductions in reliability arising from congestion have severe impacts beyond just those to solo drivers. Without any designated lanes for HOVs in the majority of the corridor, congestion on I-5 also negatively affects carpools, vanpools, and transit vehicles.28 These modes of travel are more efficient at moving people and, per person, are less environmentally damaging than SOVs. This makes these modes more desirable from both mobility and environmental perspectives. However, when HOVs and transit vehicles are forced to use congested freeway lanes with all other traffic, they become significantly less attractive and, especially with BRT, infeasible. This greatly diminishes the incentive for travelers to choose these alternative modes of transportation.
Deficiency: Lack of Capacity at I-5 Park-and-Ride Lots Discourages HOV Use
With many I-5 park-and-ride lots at or near capacity each day, the number of drivers who can take advantage of this HOV incentive is highly constrained. Such high occupancy rates also decrease the reliability of the park-and-rides, as potential users cannot rely on parking being available every day, and are therefore discouraged from participating in carpools and vanpools.
Seven highway park-and-ride lots in the NCC allow I-5 travelers to leave their cars behind in favor of ridesharing options such as carpools and vanpools-a practice that directly reduces highway congestion, VMT, and per capita emissions. However, as shown in Table 3A-14, several of these lots are at or near capacity every day, with the facilities at SR 78, La Costa Avenue, and Carmel Valley Road exceeding 90% occupancy. This high occupancy rate limits the number of carpoolers who can use these highway-adjacent facilities, therefore acting as a disincentive to increased HOV travel. In addition, these high occupancy rates create uncertainty among current and potential users who might wish to commute via carpool but feel they cannot rely on parking being available every day.
| Park-and-Ride Lot Location | Average Occupancy |
|---|---|
| Mission Avenue | 65% |
| SR-78 | 95% |
| La Costa Avenue | 93% |
| Encinitas Boulevard | 41% |
| Birmingham Drive | 45% |
| Carmel Valley Road | 120% |
| Gilman Drive | 88% |
3A.1.3.6 Corridor Transportation Mode Share
Deficiency: Driving Alone is the Dominant Travel Mode
Drive-alone travel comprises the vast majority of trips in the corridor. By improving the competitiveness of alternative modes, the overall corridor transportation-system capacity will increase.
While the NCC contains multimodal transportation facilities-including I-5, local roads, transit, and bike/pedestrian routes-the vast majority of trips in the corridor are made by automobile. This is because travel needs in the corridor and region are highly dispersed, with multiple origins, destinations, and times of travel. Driving-particularly on solo trips-provides travelers with a level of flexibility, convenience, and time savings that is difficult for transit, walking, and biking to achieve. Unfortunately, driving alone is also the least-efficient way to move people and a major contributor to both congestion and environmental damage.
Mode share data provide information on the percentage of total trips that occur on each mode of transportation. Table 3A-15 shows the existing work-trip mode share for trips in the NCC, California, and the United States. It reveals an extremely strong bias toward driving alone in the NCC, more than the rest of California and the nation. This demonstrates the disproportionate advantage of the automobile in such a dispersed, suburban area.
| Area | Drive Alone | Carpool/Vanpool | Public Transit | other Modes | Worked at Home |
|---|---|---|---|---|---|
| North Coast Corridor | 76% | 10% | 3% | 2% | 7% |
| California | 72% | 15% | 5% | 5% | 4% |
| United States | 76% | 12% | 5% | 4% | 3% |
Another way to evaluate commute-trip mode share is to count the person-trips on each mode as they cross a common point during the peak periods. This allows for an analysis of mode share during commute times for trips with similar general travel paths (i.e., north-south). Los Peñasquitos Lagoon offers such an opportunity as I-5, LOSSAN rail corridor, and Coast Highway (the major north-south arterial) all cross the lagoon in close proximity. Figure 3A-16 illustrates the transportation mode used as travelers cross this point during the morning peak period. (While not all travelers are commuters, a significantly large percentage is traveling to work during the morning peak period.) These data indicate that the COASTER rail service carries approximately 7% of all person-trips at this location in the corridor during the morning peak period. Almost three-fourths of the person-trips at this location are on I-5.

South of Los Peñasquitos Lagoon, the COASTER makes only three stops: Sorrento Valley, Old Town, and Santa Fe Depot. The Sorrento Valley and Santa Fe Depot stations serve University City and downtown San Diego, respectively, which are two of the region's largest job centers. The higher transit mode share for this narrowly defined trip across the lagoon (7% on COASTER plus 1% on local/regional bus), as compared to the transit mode share for all commute trips in the corridor (3%), reflects that predictable work trips to the region's few large employment centers are generally the easiest to capture via transit. Planned enhancements to the LOSSAN rail corridor are anticipated to increase the transit mode share for these peak-period work trips. However, most commuters have other widely dispersed origins and destinations and will continue to depend on the highway and arterial network for their work trips.
Both of these metrics indicate that there are opportunities in the NCC to increase the non-drive-alone mode share. Any shift away from SOV trips would enhance the capacity of the transportation system by shifting the focus from carrying more cars to carrying more people. Getting more people into carpools, onto transit, and using bicycles and their feet to travel would minimize the infrastructure expansion required to accommodate the overall travel demand in the corridor. SANDAG and Caltrans are striving for these goals. The 2050 RTP includes a program of projects that expand carpool and transit facilities and services in the NCC, in addition to innovative improvements for SOV travel, which will remain the predominant travel mode in the corridor.
3A.1.4 Bicycle and Pedestrian Deficiencies
Deficiency: North-South Bicycle and Pedestrian Access is Hampered by Barriers due to Lack of Parallel Frontage Roads, Topographical and Lagoon Constraints
There are barriers and gaps in the north-south bicycle and pedestrian/trail networks in the corridor due to the absence of parallel frontage roads to the LOSSAN and I-5 facilities, and the presence of topographical and lagoon constraints, which collectively restrict continuous north-south bicycle and pedestrian travel through the corridor, thereby limiting options for non-vehicular travel and diminishing coastal access and recreation opportunities.
Within the NCC, there is an existing bicycle and pedestrian network that provides access to the coast and other upland recreation areas. Figure 3A-17 shows the primary bicycle and pedestrian facilities in the NCC. Several of these are regional routes intended to not only connect public beaches and parks, but also residences, town centers, transit centers, and other activity centers. However, gaps and barriers within the bike and trail network limit the use of these facilities as an effective means of traveling within and through the corridor. The existing gaps and barriers also limit the ability of the bike and pedestrian network to serve as a viable coastal recreational facility that provides non-vehicular means for accessing and enjoying the shoreline and natural resource areas within the corridor.
SANDAG has prepared a Regional Bicycle Master Plan (2011) that encourages the development of a unified bicycle system throughout the San Diego region and serves the diverse needs of bicycle riders by providing connections between activity centers, transit facilities, and regional trail systems. Complementing the Regional Bicycle Master Plan, the Coastal Rail Trail is planned to provide north-south coastal access across the length of the NCC and beyond-primarily via a dedicated bicycle facility. The trail has been developed to different degrees throughout the corridor, with some segments providing completely separate rights-of-way, other segments providing bike lanes on local streets and other segments that have yet to be constructed.
In addition, the California Coastal Trail-which is intended to be a continuous 1,200-mile public right-of-way along the California coastline-is also under development, with approximately 69% of the trail currently completed in San Diego County.29 The California Coastal Trail is intended to provide linkages to other inland parallel and vertical trail systems and to the State Park system, to facilitate increased accessibility to coastal resources and state parks along the shoreline and from urban population centers. Principles for designing the California Coastal Trail, as articulated in Completing the California Coastal Trail (Coastal Conservancy 2003), further provide that the California Coastal Trail "is not a single designated pathway spanning the length of California's shoreline. It should be envisioned as a yarn comprised of several different but roughly parallel threads-here widely separated, there drawn together-with each thread being a particular trail alignment or trail improvement that responds to a specific need or accommodates a particular purpose. One thread may be for beach walkers, another for bicyclists, another may be merely an interim or temporary alignment, or may be placed where it is because of topography, land ownership, or natural barrier."
While the NCC includes an existing bicycle and pedestrian network that provides access to the coast and other upland recreation areas, development of the local street network in the NCC has been restricted by topographical constraints that include hills, canyons, and six lagoons. As a result, the corridor arterial street network is sparse and circuitous, with a limited number of parallel arterial roadways, thus resulting in large gaps and barriers to north-south bicycle and pedestrian travel. These constraints, as well as others, have similarly hindered the build-out of the Coastal Rail Trail and California Coastal Trail, which could otherwise provide additional north-south bicycle and pedestrian travel options through the corridor. In particular, the six coastal lagoons in the NCC provide a distinct barrier to north-south crossings, and incomplete local trail networks further exacerbate the barrier since there are no connecting or alternative routes around these resource areas.
Deficiency: Outdated Interchanges and Lack of Rail Crossings Result in Barriers to East-West Bicycle and Pedestrian Access to the Coast
There are substandard segments, barriers, and gaps in the bicycle and pedestrian routes and trails in the corridor, resulting in an incomplete network that increases safety risk, limits opportunities for non-vehicular travel from inland areas to the coastline, diminishing coastal access and recreation opportunities.
Bicycle and pedestrian access to coastal resources, including coastal trails, from inland areas occur along primary and secondary routes that run inland from the coast. In particular, the Regional Bicycle Master Plan is a significant transportation element providing east-west access to and from the shoreline, with local streets contributing to the network. These inland east-west routes are limited in the NCC, containing many gaps due to topographical constraints, absence of bicycle-pedestrian crossings across the transportation facilities, and environmental barriers. Additionally, where many routes cross the I-5 highway and LOSSAN rail corridors at outdated interchanges, they narrow and quality degrades. Local roads cross I-5 in the east-west direction 35 times in the NCC, and nearly all of these crossings feature narrow and outdated facilities that are unaccommodating to bicycles and pedestrians. As a result, it is difficult to reach the shoreline and other recreational areas from inland areas-including the north-south trending Coastal Rail Trail and the California Coastal Trail-using these bicycle/pedestrian routes.
3A.1.5 Mobility and Coastal Access Problem Summary and Conclusions
Travel demand in the NCC has and will continue to strain the existing transportation infrastructure and services. Both the I-5 highway and the LOSSAN rail corridor will continue to be plagued by deficiencies that inhibit coastal access and economic growth by increasing travel times, decreasing reliability, and limiting travel choices. In addition, options for non-motorized travel in the corridor contain barriers and gaps making it difficult to complete local trips by foot or bicycle. In summary:
- Existing transportation facilities focus primarily on moving cars, not people, through the corridor.
- Passenger rail capacity and performance is constrained by infrastructure deficiencies, specifically the high percentage of single-track sections within the corridor.
- Parking demand at rail stations exceeds capacity, limiting access to the rail corridor.
- I-5 was originally built as an eight-lane freeway in the late 1960s and 1970s and has not had any major improvements to keep pace with the significant population, employment, and travel-demand growth in the corridor over the last 40 years.
- Highway demand exceeds capacity, resulting in traffic congestion, delays, and long travel times in the corridor, particularly for commute trips during peak periods and recreational trips on weekends.
- Highway congestion and delays result in unreliable and unpredictable trips for travelers.
- Due to topographic constraints, there are few arterial street alternatives to I-5 for local trips, which forces more trips onto the highway.
- The bicycle and pedestrian transportation network contains barriers, gaps, and substandard facilities, which discourages local bike and walk trips and inhibits access to coastal areas.
- Population, employment, and coastal recreational use are projected to continue to grow, placing even larger demands on the highway, rail, and trail systems in the corridor. Spillover or "cut through" traffic will negatively affect local arterials and coastal access routes.
To maintain and enhance mobility in the corridor and provide access to coastal communities and resources, improvements are needed to the corridor transportation system. These improvements should:
- Expand infrastructure that will serve and encourage alternatives to SOV trips, including carpools, vanpools, and rail and bus transit services.
- Address capacity needs on the highway since travel by car, including HOVs, will continue to comprise the majority of trips in the corridor.
- Increase options for non-motorized access to the coast, particularly for recreational trips.
While the vast majority of trips in the NCC will continue to be by auto through 2030 and beyond, transit will also continue to play a vital and growing role in the corridor's transportation network. Indeed, SANDAG's 2050 RTP includes major improvements to rail and bus transit facilities and services in the NCC to address some of the existing deficiencies and make transit more competitive with the automobile. The 2050 RTP's planned investments in cost-effective transit improvements, high-occupancy highway improvements, and expansion of bicycle and pedestrian facilities in the NCC will address growing travel demand and improve access and mobility along San Diego's north coast by focusing on moving people, and not just cars. This multimodal transportation vision will ensure that ongoing access to coastal resources in the NCC will be preserved and enhanced.
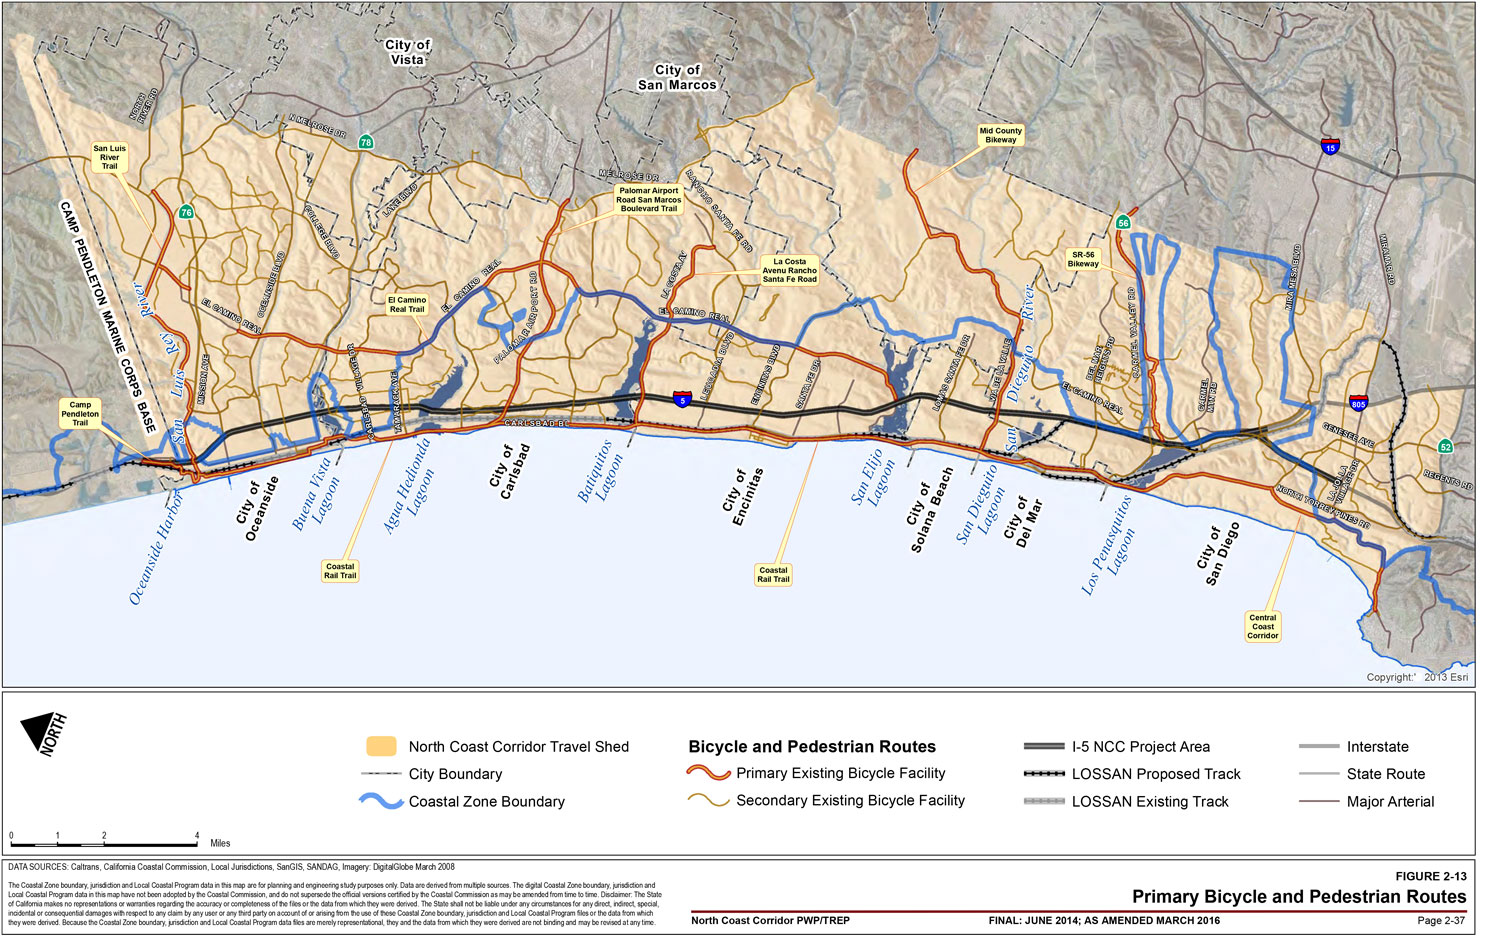
3A.2 Impacts To Coastal Communities And Natural Resources
3A.2.1 Coastal Communities
In addition to corridor mobility and coastal access issues, the NCC is in need of transportation infrastructure improvements that will serve to foster healthy and sustainable coastal communities by limiting traffic congestion on local streets, minimizing energy consumption, air, and GHG emissions related to travel, and improving the transportation system in a way that supports Smart Growth as a means of accommodating future growth in the NCC..
3A.2.1.1 Transportation Impacts to Local Communities
Deficiency: Without Improvements, Local Traffic Will Continue to Degrade
In the absence of improvements to I-5, local traffic in the NCC will continue to degrade as spillover traffic increases, leading to greater local congestion, diminished coastal access, and negative impacts to community character.
While the deficiencies arising from congestion may be most visible on I-5, the effects are not limited solely to the highway. Highway congestion often causes regional and interregional trips to "spillover" onto local streets, as frustrated travelers exit the highway in search of less-congested routes. This results in through traffic using coastal access routes and local streets in attempts to bypass congestion, which negatively affects the character of these coastal communities as well as access to coastal resources. Such impacted communities include downtown Carlsbad and Encinitas (Figure 3A-18).
El Camino Real and Coast Highway, as the primary north-south arterial roads in the corridor, stand to be especially affected by spillover traffic as regular congestion on I-5 continues to worsen. Without improvements to I-5, this is expected to result in increases in average daily (weekday) traffic (ADT) volumes ranging from 7% to 15% on segments of both El Camino Real and Coast Highway.30 It is likely that spillover impacts on seasonal and weekend travel will be even higher.
3A.2.1.2 Energy Consumption and Air Emissions
Deficiency: Energy Consumption Resulting from Travel Often Leads to Increases in Air Pollutants and GHG Emissions
Absent proposed PWP/TREP improvements, I-5 and parallel local streets in the NCC will continue to degrade and will experience increased congestion and travel times coupled with reductions in fuel efficiency, impacts to air quality, and increased GHG emissions.
Energy consumption and air emissions have resulted in negative air quality impacts as well as increased GHG emissions and the resultant effects of global climate change. Energy, air quality, and GHGs are interrelated when it comes to transportation.

An individual automobile's energy consumption per mile is the result of many variables such as the type of vehicle, including make, model, size, and fuel technology; roadway terrain where steep grades result in greater fuel consumption; and travel speeds, which is a function of both posted speed and traffic congestion. On a broader scale, data and projections about vehicle energy consumption at the corridor and regional levels can generally be extrapolated from two key travel factors:
- Vehicle Miles Traveled (VMT) - the total number of miles traveled by all vehicles on a peak-period, daily, and/or annual basis.
- Vehicle Hours Traveled (VHT) - the total number of hours vehicles spent traveling during a period. It is directly related to traffic volumes, levels of traffic congestion, and the resulting average speed (miles per hour [mph]).
While VMT and VHT can act as proxies for measuring vehicle energy consumption in the region, it is misleading to assess such at the corridor level since VMT and VHT are not driven or limited by conditions only within the boundaries of the corridor. A key concept in transportation and air quality relationship is identifying vehicle emissions and travel speeds at a given point in time. Congestion, particularly stop-and-go congestion, both decreases vehicle energy efficiency and increases VHT, leading to increased energy consumption and increased emissions. In general, stop-and-go traffic produces high emission rates for virtually all vehicle types and traditional urban-scale pollutants such as hydrocarbons (HC), carbon monoxide (CO), and nitrogen oxides (NOx). Fuel consumption increases by about 30% when average speeds drop from 30 mph to 20 mph, while a drop from 30 mph to 10 mph results in a 100% increase in fuel use.
Similarly, the highest carbon dioxide (CO2) levels from mobile sources such as automobiles occur at stop-and-go speeds of 0-25 mph and speeds over 75 mph (automobiles are most efficient when operating at steady speeds), as illustrated in Figure 3A-19.31 As such, the effects of transportation congestion on air emissions, including GHG emissions, can be substantial. A report commissioned by the state of California estimated that approximately 10% of all on-road fuel consumed is a result of congestion.32
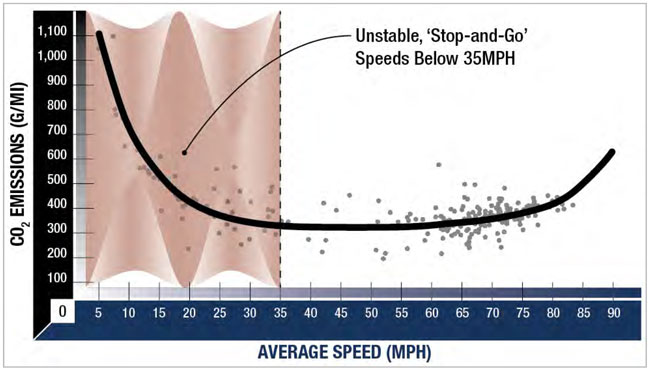
Stop-and-go congestion and idling vehicles on I-5 emit more pollutants than free-flow traffic, contributing to increased emissions and reduced air quality in the corridor-a condition that will worsen as congestion increases. Without operational improvements or enhancements to the existing transportation capacity on I-5, traffic congestion on I-5 would expand significantly as compared to the current conditions, resulting in the entire length of the corridor in both directions experiencing severe congestion and traffic delay during the peak periods. Current congestion lasts for 5 hours per day in both the northbound and southbound directions. Congested travel hours under the No-Build Alternative are projected to more than double, with northbound congestion forecast to extend to 9-10 hours and southbound congestion extending to 13 hours. Absent proposed PWP/TREP improvements, I-5 and parallel local streets in the NCC will continue to degrade, and experience increased congestion and travel times coupled with reductions in fuel efficiency, impacts to air quality, and increased GHG emissions.
Strategies to reduce GHG emissions (such as improved fuel economy and new fuel and vehicle types) are implemented most effectively at the state, national, or global levels. However, other strategies (such as improving efficiency and reducing demand on the transportation system) are better implemented at the regional or local level. Strategies to effectively reduce transportation energy consumption in the NCC-as well as improve air quality and address GHG emissions regionally-must be appropriately established and evaluated by SANDAG in terms of transportation efficiency and demand.
3A.2.1.3 Transportation Infrastructure Needs for Smart Growth
Deficiency: Existing Transportation Infrastructure is Inadequate to Support Smart Growth Policies
A robust multimodal transportation infrastructure is necessary to support Smart Growth efforts to accommodate future development within existing communities by ensuring that roads, bike routes, sidewalks, and other facilities offer safe, appealing, and comfortable travel.
The existing low-density development pattern in the NCC results in a few concentrated areas of the population to support high-frequency transit service. While large-scale land-use changes are unlikely to occur in the corridor, SANDAG and local governments have implemented a "Smart Growth" land use strategy that seeks to increase population density to accommodate projected growth, while reducing VMT and curbing GHG emissions. However, Smart Growth must be supported by sufficient public services and when it comes to travel, successful Smart Growth efforts depend largely on the availability of a sustainable, multimodal transportation system that is interconnected with supportive development patterns.
Accordingly, the Smart Growth development pattern planned for the corridor will be difficult to achieve without a robust multimodal transportation infrastructure that offers a variety of transportation choices to support it. The corridor's existing transportation infrastructure is inadequate to support Smart Growth policies and, as described previously, the corridor requires an improved transportation system that includes cost-effective transit improvements, high-occupancy highway improvements, and expansion of bicycle and pedestrian facilities to improve access and mobility within the NCC and beyond. This planned transportation infrastructure is a critical element to supporting Smart Growth efforts to accommodate future development within existing communities by ensuring that roads, bike routes, sidewalks, and other facilities offer safe, appealing, and comfortable travel to transit and activity centers. To accomplish this, focused improvements within the transportation system are particularly necessary to address the bicycle and pedestrian deficiencies discussed in Section 3A.1.4, to thereby eliminate barriers in regional and local bicycle and pedestrian networks for improved accessibility to coastal resources and recreational facilities (beaches, lagoons, open spaces), transit stations and stops, and local activity centers. Such improvements are necessary to bridge the gap between origins or destinations and the transit system to facilitate transit use and to provide active modes of travel such as walking and biking, thereby fostering more livable and walkable communities in which travel is not reliant on the automobile.
3A.2.2 Water Quality and Sensitive Coastal Habitats
The NCC is in need of transportation infrastructure improvements to address not only mobility, coastal access, and coastal community issues, but also water quality, lagoon, and natural habitat deficiencies. Such resource deficiencies at corridor beaches, lagoons, and recreation areas could affect recreation opportunities that depend on the quality of the natural resources that sustain them.
3A.2.2.1 Water Quality
Water quality within the NCC has been affected by increases in impermeable surface areas, stormwater pollutant loads, and direct alteration of watershed features, which contributes to a decrease in the valuable biological function of these areas.
Deficiency: Continued Degradation of Water Quality
Coastal waterbodies in the corridor have experienced decades of degradation from direct and indirect impacts of development-including the transportation facilities that cross these resources-which has negatively affected water quality that is essential for the protection of sensitive coastal resources and water-dependent recreation.
Runoff from Corridor Urbanization, Development, and Transportation Facilities
Corridor urbanization and development have cumulatively affected water quality as impermeable surfaces have increased and the vegetative cover has decreased. This has resulted in significant increases in stormwater pollutant loads and runoff velocity and volume, contributing to excessive erosion and sedimentation within corridor watersheds. Hydrology and water quality are also potentially affected in the coastal bluff areas of Del Mar along the rail facility where ongoing shoreline erosion problems caused by wave action require ongoing maintenance activities along or within the shoreline to ensure the facility is protected from failure.
The corridor transportation infrastructure generally contributes pollutants to surface waters, which are most often generated from roadways, parking lots, and disturbed landscapes. However, highway facilities are only a small percentage of the land area (2%) in the NCC, and I-5 also accounts for less than 2% of the tributary area of the five NCC watersheds.33 Potential pollutants from the roadway and slopes include sediment, nutrients (nitrogen and phosphorus) from native and ornamental vegetation, metals (copper, lead, and zinc), fertilizers, and pesticides. Other than runoff from parking structures associated with the rail facilities, runoff from rail improvements are relatively minor because of limited impermeable surface area associated with rail lines.
The hydrology of the watersheds in the corridor has been directly altered by adjacent development and the existing highway and rail facilities, which have displaced watershed features including lagoon, river, stream, and drainage areas. In addition, realignment and/or channelization of inland waterways conveying stormwater through the watersheds to coastal water bodies have also resulted in significant modification to the hydrology of the corridor. The physical alterations of watershed features have resulted in a cumulative loss of wetland and riparian habitat areas that, in turn, has decreased the valuable biological function of these areas to naturally dissipate and filter sediment and pollutants in stormwater runoff prior to discharge to the lagoons and eventually the Pacific Ocean.
Level of Runoff Treatment
The majority of existing transportation facilities in the corridor was constructed before current regulations were enacted to control and treat stormwater discharge in order to protect and restore water quality. As such, many of the facilities do not include current retention or treatment methods for stormwater runoff. However, Caltrans recently developed and implemented a Best Management Practices (BMP) pilot program for runoff in the corridor highway facility, which includes detention devices at I-5 and Manchester Avenue, a wet basin at I-5 and La Costa Avenue, media filters at the La Costa Park & Ride and the SR-78 & I-5 Park & Ride, and a biofiltration system at I-5 and Palomar Airport Road. Consistent with federal and state law, as well as with the terms of its National Pollution Discharge Elimination System (NPDES) permit, Caltrans also implemented maintenance BMPs that include preventative measures to ensure that ongoing maintenance activities are conducted in a manner that reduces the number of pollutants discharged to surface waters via Caltrans stormwater drainage systems. Maintenance BMPs are implemented in accordance with the Storm Water Quality Handbook - Maintenance Staff Guide, which provides detailed instructions on applying approved stormwater maintenance BMPs to maintain facility operations and highway activities in a manner that provides maximum protection of water quality.
From a Coastal Act perspective, the greatest area of concern is the transportation project's potential permanent contribution to the impervious surface area. An increase in the impervious surface is directly proportional to higher runoff volumes and higher runoff velocities (hydromodification). As a result, pollutants found in runoff are more likely to negatively affect wetland habitats and increase the risk of flooding.
Quality of Water Entering Lagoons and the Ocean
Existing water quality in the corridor is best characterized by the quality of water in receiving bodies. Within the corridor, there are a number of impaired water bodies that, as defined by the Clean Water Act (CWA), do not meet water quality standards, and therefore cannot support the beneficial uses for which the water body has been designated. Impaired water bodies are also referred to as "water quality limited segments." States are required to compile a list of impaired water bodies, referred to as the "Clean Water Act Section 303(d) List of Water Quality Limited Segments" (303(d) List). Within the corridor, Los Peñasquitos Creek, Los Peñasquitos Lagoon, Soledad Canyon Creek, the Pacific Ocean at San Dieguito Lagoon, San Elijo Lagoon, Buena Vista Lagoon, Loma Alta Slough, the Pacific Ocean at the mouth of San Luis Rey River, and the San Luis Rey River are listed as impaired water bodies. Inland waterways that are tributaries of, or discharge into, these 303(d) impaired waters may also be considered part of the 303(d) listed water bodies.
A number of impaired water bodies were given special status under the CWA for which the state is required to identify waters that will not achieve water quality standards after application of effluent limits. For these impaired water bodies, states are required to develop plans for water quality improvement. The plans consider each water body and pollutant for which water quality is considered impaired and include load-based (as opposed to concentration-based) limits called total maximum daily loads (TMDL), which is the maximum amount of pollution (both point and non-point sources) that a water body can assimilate without violating state water-quality standards. Caltrans is included as a stakeholder for Investigation Order R9-2006-076 titled, "Owners and Operators of Municipal Separate Storm Sewer Systems, California Department of Transportation, Hale Avenue Resource Recovery Facility, and North County Transit District Responsible for the Discharge of Bacteria, Nutrients, Sediment, and Total Dissolved Solids into Impaired Lagoons and Adjacent Beaches and Agua Hedionda Creek."
Pollutants discharging with a load or a concentration that commonly exceeds allowable standards and which are considered treatable by Caltrans-approved treatment BMPs are referred to as Targeted Design Constituents (TDC). TDCs in the corridor include sediment, metals (total and dissolved zinc, lead, and copper), nitrogen, phosphorus, and general metals. Table 3A-16 shows Section 303(d) receiving water bodies within the corridor and the TDCs associated with them.
| 303(d) Impaired Water Body | Constituents of Concern | TDCs |
|---|---|---|
| Los Peñasquitos Creek | Phosphate & Total Dissolved Solids | Phosphate & Total Dissolved Solids |
| Los Peñasquitos Lagoon | Sedimentation/Siltation | Sedimentation/Siltation |
| Soledad Canyon Creek | Sediment Toxicity | N/A (Not determined to be a constituent found within the Caltrans stormwater runoff monitoring program) |
| Pacific Ocean Shoreline / San Dieguito | Indicator Bacteria | N/A (Not determined to be a constituent found within the Caltrans stormwater runoff monitoring program) |
| San Elijo Lagoon | Indicator Bacteria & Sedimentation/ Siltation & Eutrophic | Sedimentation/ Siltation |
| Buena Vista Lagoon | Indicator Bacteria, Sedimentation Siltation & Nutrients | Sedimentation/Siltation/Nutrients |
| Loma Alta Slough | Indicator Bacteria & Eutrophic | N/A (Not determined to be a constituent found within the Caltrans stormwater runoff monitoring program) |
| Pacific Ocean Shoreline/ San Luis Rey River | Indicator Bacteria | N/A (Not determined to be a constituent found within the Caltrans stormwater runoff monitoring program) |
| San Luis Rey River | Chloride & Total Dissolved Solids | N/A (Not determined to be a constituent found within the Caltrans stormwater runoff monitoring program) |
In addition to the adverse impacts of polluted stormwater runoff from corridor facilities and adjacent land uses, water quality is also adversely affected, particularly within the corridor lagoons where fill embankments were used for bridge crossings for the existing highway and rail facilities. The fill embankments have substantially narrowed the lagoon cross-sections at the facility, thereby decreasing overall water circulation in the lagoon, and have contributed to and caused water stagnation. Filled to support rail or road crossings, the narrowed lagoon sections act as a partial dam, impeding the natural process of tidal flushing and slowing freshwater flows from inland waterways that convey sediment and pollutant loads to corridor lagoons during significant rainfall events. The result is a concentrated build-up of sedimentation and water pollutants within the lagoons, which substantially affects biological productivity and quality of coastal waters. The combined effects of polluted stormwater runoff from corridor facilities and adjacent land use, the absence of current treatment methods for stormwater runoff, and the impacts of physically displacing or altering natural watershed features have resulted in negatively affected water quality in the corridor's coastal water bodies.
3A.2.2.2 Lagoon Restoration
Deficiency: Continued Degradation of Lagoons
The coastal lagoons in the corridor have experienced adverse impacts on water quality and the numerous and varied sensitive habitat areas, plant, and wildlife species supported within and adjacent to the lagoons. Physical alteration of lagoon areas from the construction of highway and rail crossings and realignment and/or channelization of inland waterways have affected water quality and directly affected sensitive habitat areas. Polluted stormwater runoff and previous development encroachment of adjacent land uses have also affected lagoon areas by degrading water quality and substantially reducing the amount and quality of transitional and upland habitat areas that typically provide buffers between adjacent land use and the sensitive habitats and species supported by the lagoons. These impacts have occurred over decades and require substantial resources and major restoration efforts to remedy.
The physical alteration of the coastal lagoons in the NCC that has affected water quality through corridor development and urbanization-including highway and rail crossings and realignment and/or channelization of inland waterways-has also directly affected the varied habitat areas, plant, and wildlife species supported within and adjacent to the lagoons. Direct displacement of habitat area resulting from the construction of the corridor facilities, watershed alterations such as the diversion of freshwater from inland waterways, excess sedimentation and siltation, and, in some cases, reconfiguration of the lagoons' inlet at the ocean, have all contributed to the degradation of lagoon resources. Modification to the natural process of lagoon breaching-a critical element providing flood relief, sediment transport to beaches, good water quality, and fish migration to and from the ocean and inland waterways-has particularly resulted in long-term impacts to lagoon habitats that are difficult to reverse without major restoration efforts. Table 3A-17 summarizes the main system concerns and constraints, sensitive resources, and restoration/management goals and efforts within the NCC lagoons.
Development encroachment has also reduced the amount and quality of transitional and upland habitat areas that typically provide buffers between adjacent land uses and the habitats and species supported by the lagoons. In some cases, development has occurred adjacent to the corridor lagoons, creating a fixed and hard lagoon-habitat edge where there is no vegetative buffer. Such a buffer would typically minimize erosion and treat contaminated stormwater runoff along the lagoon periphery, protect lagoon habitats from the introduction of non-native and invasive plant species, and limit disturbance to wildlife.
Notwithstanding the current issues associated with degraded water quality-physical alteration of the lagoons and development encroachment on adjacent lands-the corridor lagoons provide significant benefits in their respective watersheds for flood relief (by allowing high flows to slow and disperse into the larger water bodies), and for water quality (where sediment loads, nutrients, and toxins from stormwater are discharged and absorbed by vegetation within the lagoon prior to entering the ocean). The lagoons also contain sensitive habitat areas for threatened and endangered species, migratory birds, fish, and many different wildlife species. In addition, were associated with open space and adjacent habitat preservation areas, the corridor lagoons provide critical habitat linkages and wildlife corridors in a coastal area that has experienced rapid population growth and urbanization over the last several decades. The corridor lagoons also provide exceptional public recreation amenities with trail systems, interpretative areas, wildlife observation opportunities, and, in some cases, wide expansive beach areas where the lagoons meet the ocean.
Ongoing lagoon resource management has been implemented and will continue to be essential in ensuring that the many floods, water quality, habitat, and recreation benefits of these significant watershed features are maintained and enhanced. Los Peñasquitos, San Dieguito, Batiquitos, and Agua Hedionda Lagoons have all been subject to restoration efforts that have included ongoing inlet maintenance to allow for improved tidal circulation, water quality monitoring, and wetland and upland habitat restoration. While a number of stakeholder groups are coordinating restoration planning efforts for San Elijo and Buena Vista Lagoons, these lagoons have yet to undergo major comprehensive restoration programs; however, alternatives have been identified and environmental and technical studies are underway. Additionally, optimization studies have been conducted for the San Elijo, Buena Vista, and Batiquitos Lagoons' systems to determine the optimum design of bridge crossings that would maximize hydraulic and ecological functions, and improve wildlife connectivity, and to ensure bridge design does not preclude any potential restoration alternative for San Elijo and Buena Vista Lagoons. These lagoons are included on the 303(d) list of impaired waterbodies since they exceed standards for eutrophication, sediment and coliform bacteria, and nutrients. In addition, irrespective of current restoration efforts, all of the corridor lagoons require ongoing management to address the effects of increased year-round freshwater input, accelerated sedimentation and water contamination, reduced tidal mixing, the introduction of exotic species, revegetation of disturbed areas, and impacts on habitats and wildlife from active recreation and adjacent development.
| Lagoon System | Los Peñasquitos | San Dieguito | San Elijo | Batiquitos | Agua Hedionda | Buena Vista |
|---|---|---|---|---|---|---|
| Concerns |
|
|
|
|
|
|
| Special-Status Species |
|
|
|
|
|
|
|
Constraints |
|
|
|
|
|
|
|
Goals |
San Diego LCP Goals
Del Mar LCP Goals
|
San Diego LCP Goals
Del Mar LCP Goals
|
Encinitas LCP Goals
|
Carlsbad LCP Goals
|
Carlsbad LCP Goals
|
Carlsbad/ Oceanside LCP Goals
|
|
Restoration Efforts |
|
(Began in 2006)
|
|
|
|
|
|
Monitoring/ Management |
|
|
|
|
|
|
3A.2.2.3 Natural Habitats
The corridor contains a wide variety of natural habitats with the potential to support threatened and endangered plant and wildlife species; however, urbanization and increased development have resulted in adverse effects on this natural environment.
Deficiency: Continued Degradation and Loss of Coastal Habitats
Incremental loss of habitat areas resulting from urbanization in the corridor, including the existing transportation facilities, has resulted in significant cumulative impacts to open space areas, lagoon and inland waterways, transitional and upland habitats, and the numerous special-status plant and animal species they support. As a result, sensitive resources including wetlands, critical habitat, sensitive plant and animal species, and surface waters have continued to decrease in abundance and quality.
Quality of Existing and Potential Corridor Habitat Areas and Wetlands
The corridor supports a variety of environmentally sensitive habitat areas (ESHA) as well as degraded habitat areas contained primarily in and around the coastal lagoons and the shoreline, inland waterways, and undeveloped hillside areas, and mesas. The coastal lagoons and inland waterways support southern willow, mulefat scrub, freshwater marsh, southern willow scrub/freshwater marsh, southern arroyo willow woodland, coastal brackish marsh, southern coastal salt marsh, salt marsh transition, mudflat, salt flat, open water, San Diego mesa hardpan vernal pool, and eelgrass, salt flat, and other open water habitat. Several sensitive upland habitats are also included in the corridor, including coastal sage scrub, Baccharis scrub, maritime succulent scrub, coastal bluff scrub, southern maritime chaparral, coastal sage-chaparral scrub, coast live oak woodland, Torrey pine forest, southern dune scrub, southern foredunes, and native grassland. Non-native grassland and non-native woodland areas are also present in the corridor and could provide valuable nesting, roosting, and foraging habitat.
ESHAs in the corridor support threatened and endangered plant and wildlife species. Several significant stands of native wetland and upland habitat areas have been preserved in, and adjacent to, the lagoons and other protected open space areas. However, the development of transportation facilities and adjacent development, realignment and/or channelization of inland waterways, armoring of the shoreline, vegetation clearing and thinning for fire protection of adjacent development, and rapid spread of exotic plant materials that supplant native plant species, have all had a cumulative negative effect on the corridor's natural environment.
The peripheries of the corridor lagoons are particularly sensitive to habitat disturbance and degradation-most often resulting from development encroachment, intense recreational use, and lack of adequate upland habitat buffers. In the corridor, these impacts are demonstrated by areas of severely degraded habitat void of vegetation, areas of disturbed southern arroyo woodland, and salt marsh and coastal brackish marsh. These areas have suffered from excessive erosion and have become infested with non-native and invasive plant species. In addition, wetland and riparian habitats typically found in inland waterways have been severely degraded by previous realignment and channelization of the corridor streams and drainages by both transportation improvements and adjacent land development. Several of the small streams and drainages that have been channelized are void of permeable surface and vegetation while other areas that have not been channelized continue to support some disturbed southern willow scrub, mulefat scrub, freshwater marsh, southern arroyo woodland, and salt marsh/brackish marsh. As with the disturbed habitat areas around many lagoon peripheries, the NCC's smaller inland streams and drainages experience excessive erosion and infestation of non-native and invasive plant species.
Development encroachment adjacent to the NCC's lagoons and other inland waterways has caused a chronic loss of transitional habitat and has reduced the overall biological diversity of the resource, severed connections between coastal waterbodies and upland habitat, and limited the ability of the resources to evolve in response to environmental conditions such as sea-level rise. In addition, development encroachment has eliminated natural buffers that provide water-quality benefits and that limit disturbance of wildlife from adjacent land uses.
Upland habitats, including Diegan coastal sage scrub, southern maritime chaparral, and native and non-native grassland, provide habitat for certain endangered and threatened species and serve as important buffers and transitional habitat for the corridor lagoons and inland waterways. These upland areas also provide wildlife corridors that connect the remaining coastal and inland habitat areas, which allows for wildlife movement. Urbanization reduced upland habitat, resulting in areas with large openings of bare earth or areas that are vegetated with non-native species. Many of the disturbed upland areas in the corridor occur along trails or adjacent to the development. The existing transportation facilities act as barriers to east-west wildlife migration where lagoons, rivers, creeks, and the surrounding upland habitat would otherwise provide corridors for wildlife to cross between inland and coastal areas. Although many of the existing highway and rail bridges have steep, narrow abutments at lagoon crossings or channelized drainages that wildlife can utilize for crossing, the design of these facilities does not adequately facilitate or support their use as wildlife corridors.
Populations of Threatened or Endangered Plants and Animals
Residential development and agriculture have imperiled a number of threatened and endangered plant species in the corridor; however, perhaps the most significant risk to special-status plant species and native habitats is incremental displacement by exotic and invasive plant species. Species including pampas grass, ice plant, African fountain grass, African veldt grass, and onion weed have become increasing problems as they spread along the transportation corridor rights-of-ways. African veldt grass is spreading into the habitats around the lagoons, and tamarisk, Arundo, castor bean, and fennel are common invasive species within the wetland habitats of the corridor. Eelgrass is considered a special aquatic site and is found in the open water areas of Batiquitos and Agua Hedionda Lagoons. Eelgrass beds are threatened by Caulerpa toxic algae and have specific regulations concerning impacts and mitigation.
The NCC includes critical habitat for the least Bell's vireo, southwestern willow flycatcher, tidewater goby, and California gnatcatcher and is frequented by a number of other special-status wildlife species. Declines in these sensitive wildlife populations have occurred because of habitat loss and fragmentation resulting primarily from urban and agricultural development, degradation of feeding and nesting habitat, human disturbance, and predation. In the case of tidewater goby, stream culverts and water diversions, riparian habitat loss, sediment loads within the streams, and introduced predators threaten the species and limit the potential for tidewater goby to occur in the corridor. Indirect impacts to threatened and endangered species are caused by night lighting, exposure to air and water pollutants, edge effect exposure to adjacent land uses, and noise.
Notes:
- SANDAG/Caltrans Series 12 Model, November 2011.
- SANDAG 2050 Regional Transportation Plan (Technical Appendix 7), October 2011
- Caltrans I-5 North Coast Freeway Operations Report, June 2010.
- SANDAG 2050 RTP (Chapter 6), October 2011.
- Ibid., Technical Appendix 11.
- $88 billion metrics from SANDAG staff estimate, July 2011; all other freight metrics from the SANDAG San Diego and Imperial Valley Gateway Study, March 2010.
- SANDAG/Caltrans Series 12 Model, November 2011.
- SANDAG 2050 RTP (Chapter 3), October 2011.
- SANDAG/Caltrans Series 12 Model, November 2011.
- Best Development Practices, Reid Ewing, 1996.
- SANDAG 2050 RTP (Chapter 3), October 2011.
- SANDAG 2050 Regional Growth Forecast, February 2010; SANDAG Urban Area Transit Strategy Policy Paper, September 2010.
- SANDAG staff estimate, May 2012.
- 47,000 trips/12 hours per service day = 3,900 trips per hour. In accordance with SANDAG models, a freeway lane is at capacity at approximately 2,000 vehicles per hour.
- SANDAG Onboard COASTER Station Access Survey, 2009.
- SANDAG/Caltrans Series 12 Model, November 2011.
- National Transit Database Transit Profiles, Federal Transit Administration, 2009; SANDAG staff.
- In accordance with California Senate Bill 468, revenues from the proposed Express Lanes (in excess of administrative and operating costs) will be used in the I-5 corridor for the improvement of HOV facilities and transit services. These revenues could help to subsidize future transit services in the corridor.
- TransitWorks Strategic Plan Report, Metropolitan Transit Development Board, January 2001.
- National Transit Database Transit Profiles, Federal Transit Administration, 2009.
- Texas Transportation Institute (TTI) Annual Urban Mobility Report, Performance Measure Summary for San Diego, 2011. TTI defines peak hours as 6:00 A.M.-10:00 A.M. and 3:00 P.M.-7:00 P.M. both of these periods end one hour later than the SANDAG/Caltrans definition used elsewhere in this document.
- Caltrans I-5 North Coast Freeway Operations Report, June 2010.
- SANDAG 2050 RTP (Technical Appendix 7), October 2011.
- The model utilized by SANDAG captures induced demand but has inherent limitations in the precision of forecasting traffic patterns and associated vehicle-generated emissions. The model applies a feedback mechanism that inputs congested travel speeds into the trip distribution and mode choice to account for travelers who changed their travel routes and modes in response to changing travel times, which may result in induced demand if the widened roadway leads to an increase in traffic over time. Although the model technologies limit the precision of estimated potential induced demand, SANDAG's approach to analyzing and forecasting future traffic conditions is consistent with current industry standards and modeling procedures. In the California Air Resource Board's (CARB) report on SANDAG's Draft SB 375 SCS, it states, "A consultant review of SANDAG's methodologies for analyzing GHG emissions conducted in September 2010 referred to SANDAG's procedures as consistent with the 'state-of-the-practice.'" The CARB staff expects that the next generation of travel models in the region will provide greater capability to account for induced demand. According to another report by the Federal Highway Administration, current travel demand models account for some, but not all, of the travel behaviors that may contribute to the increased traffic from induced demand. According to CARB's September 2011 Informational Report on the San Diego Association of Governments' Draft SB 375 Sustainable Communities Strategy, "the Federal Highway Administration acknowledges the current technical limitations of analysis methods, which preclude precise accounting for some of these travel decisions." Accordingly, the PWP/TREP acknowledges the model limitations but also applies SANDAG's model estimates as a reasonable measure to compare future travel conditions associated with the proposed project (Build Alternative) and the No-Build Alternative. In addition, estimates are presented as a range to take into account the potential forecasting imprecision (e.g., approximately 4% to 10% increase in VMT between the No-Build and the Build Alternatives as a result of latent demand and traffic shifting).
- San Diego NCC-CSMP (Chapter 8), August 2010; SANDAG/Caltrans Series 12 Model, November 2011.
- San Diego NCC-CSMP (Chapter 5), July 2010.
- As discussed in Table 3A-13, the congestion levels shown for 2040 are from SANDAG's Series 11-based micro-simulation travel forecast for 2030. Due to the general "leveling off" of regional growth trends in both demographic and travel demand measures between the Series 11 and Series 12 growth forecasts, these 2030 Series 11-based transportation forecasts can be reasonably extrapolated to be valid forecasts for 2040.
- A single HOV lane in each direction currently exists in the NCC's southern portion, from La Jolla Village Drive to Manchester Avenue (approx. 10 miles). The remainder of the corridor (approx. 17 miles) contains no HOV facilities.
- Public Access Action Plan, California Coastal Commission, June 1999.
- I-5 NCC Technical Report #5: Traffic Demand Forecasting Report, Table 5.1, August 2007. Conducted in support of I-5 NCC Project Final EIR/EIS.
- I-5 NCC Project Final EIR/EIS (Section 4.6), October 2013.
- Energy Efficiency Report, California Energy Commission, 1990.
- Water Quality Technical Memorandum for I-5 North Coast Corridor Project (Section II), Caltrans, March 2013. (Included as Appendix E to the PWP/TREP.)