To evaluate the transportation and environmental needs of the North Coast Corridor (NCC), it is important to understand the corridor's existing conditions by identifying the corridor's many cities, land uses, transportation facilities, and natural resources–all of which are presented in Section 2.1. It is also essential to consider the regional planning and policy context in which the NCC fits. The corridor is only one part of the larger San Diego region, and the scarcity of funding for both transportation and environmental projects requires planners to balance the needs, opportunities, and constraints of the region's many communities. Regional and state requirements to reduce energy consumption and air emissions also influence the planning decisions of local leaders. These regional planning processes, as well as their associated policies, are discussed in Section 2.2.
2.1 Physical Context: Land Use, Transportation, and Coastal and Natural Resources
This section includes descriptions of the cities located within the NCC, including development trends and the status of the cities' Local Coastal Programs (LCP). This section is followed by an overview of the existing transportation infrastructure and significant coastal and natural resources in the corridor.
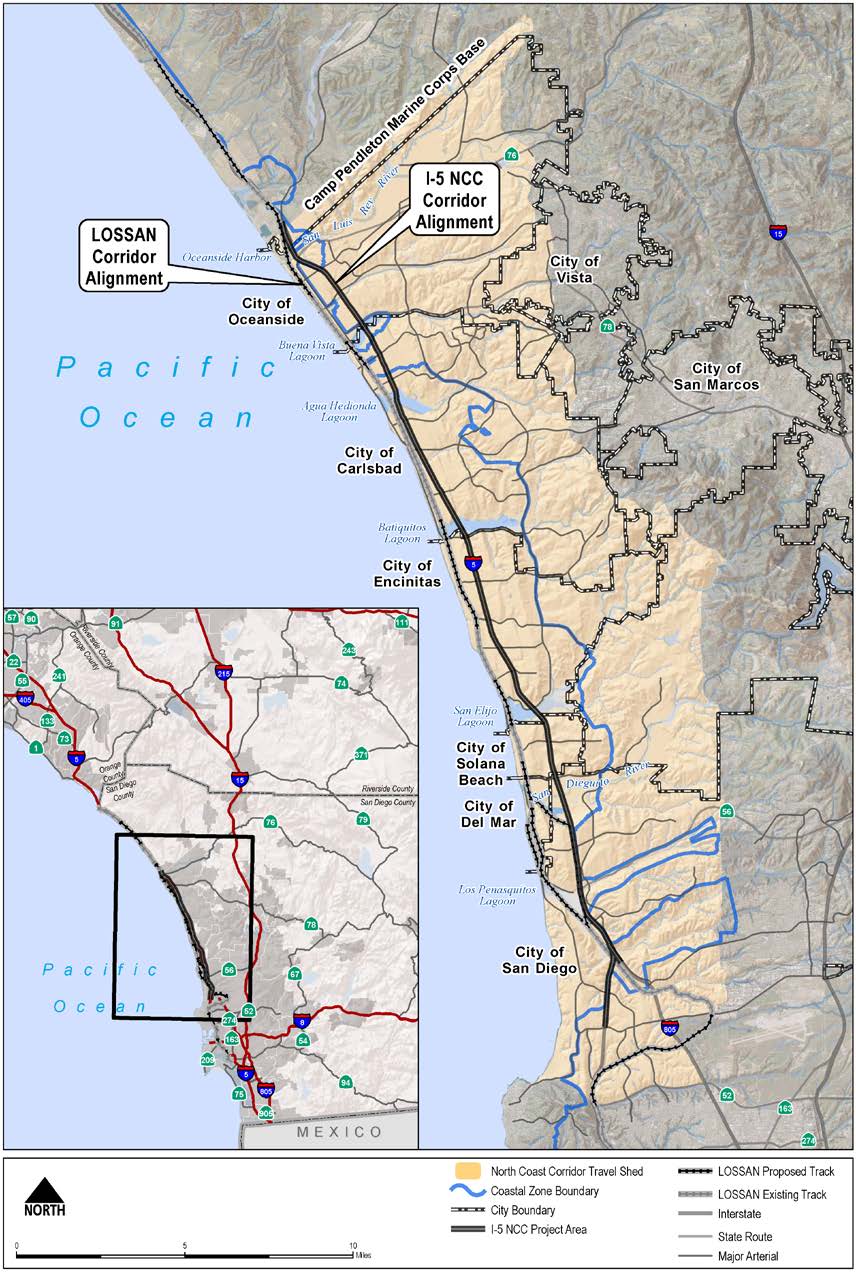
The NCC is approximately 30 miles long by 6 miles wide, consists of approximately 111,215 gross acres, and is home to over 525,000 people. Containing both the Los Angeles-San Diego-San Luis Obispo (LOSSAN) rail corridor and the I-5 highway corridor, the NCC also is a multimodal "travel shed." This term is used to define a corridor where trips tend to cluster in a linear pattern, with feeder routes (such as local streets or transit services) linking to major trunk routes (such as the I-5 highway or LOSSAN rail corridor) that carry longer-distance trips. While this PWP/TREP addresses only the portion of the NCC travel shed located in the Coastal Zone (approximately 11,066 gross acres), much of the travel shed's primary transportation facilities–namely the I-5 highway and LOSSAN rail corridors–are located almost entirely in the Coastal Zone and are critical to maintaining access to not only the corridor's coastal areas but also the regional, interregional, and international transportation systems. In 2010, the NCC accommodated over 1.4 million daily vehicle trips just on I-5 (or approximately 13% of the 11.5 million daily vehicle trips that occurred within San Diego County). By 2040, the NCC segment of I-5 is projected to accommodate nearly 1.8 million daily vehicle trips (an increase of more than 26% over existing conditions).1
2.1.1 Existing Land Use and Development
Six San Diego County cities lie entirely or partially within the NCC: San Diego, Solana Beach, Del Mar, Encinitas, Carlsbad, and Oceanside. In addition, six coastal lagoons and five creeks and rivers as well as associated open space and habitat preservation areas are located within the corridor and are discussed further in Section 2.1.5. Figure 2-1 provides a regional and corridor overview and Figure 2-2 illustrates city and Coastal Zone boundaries and significant lagoon resource areas within the NCC.
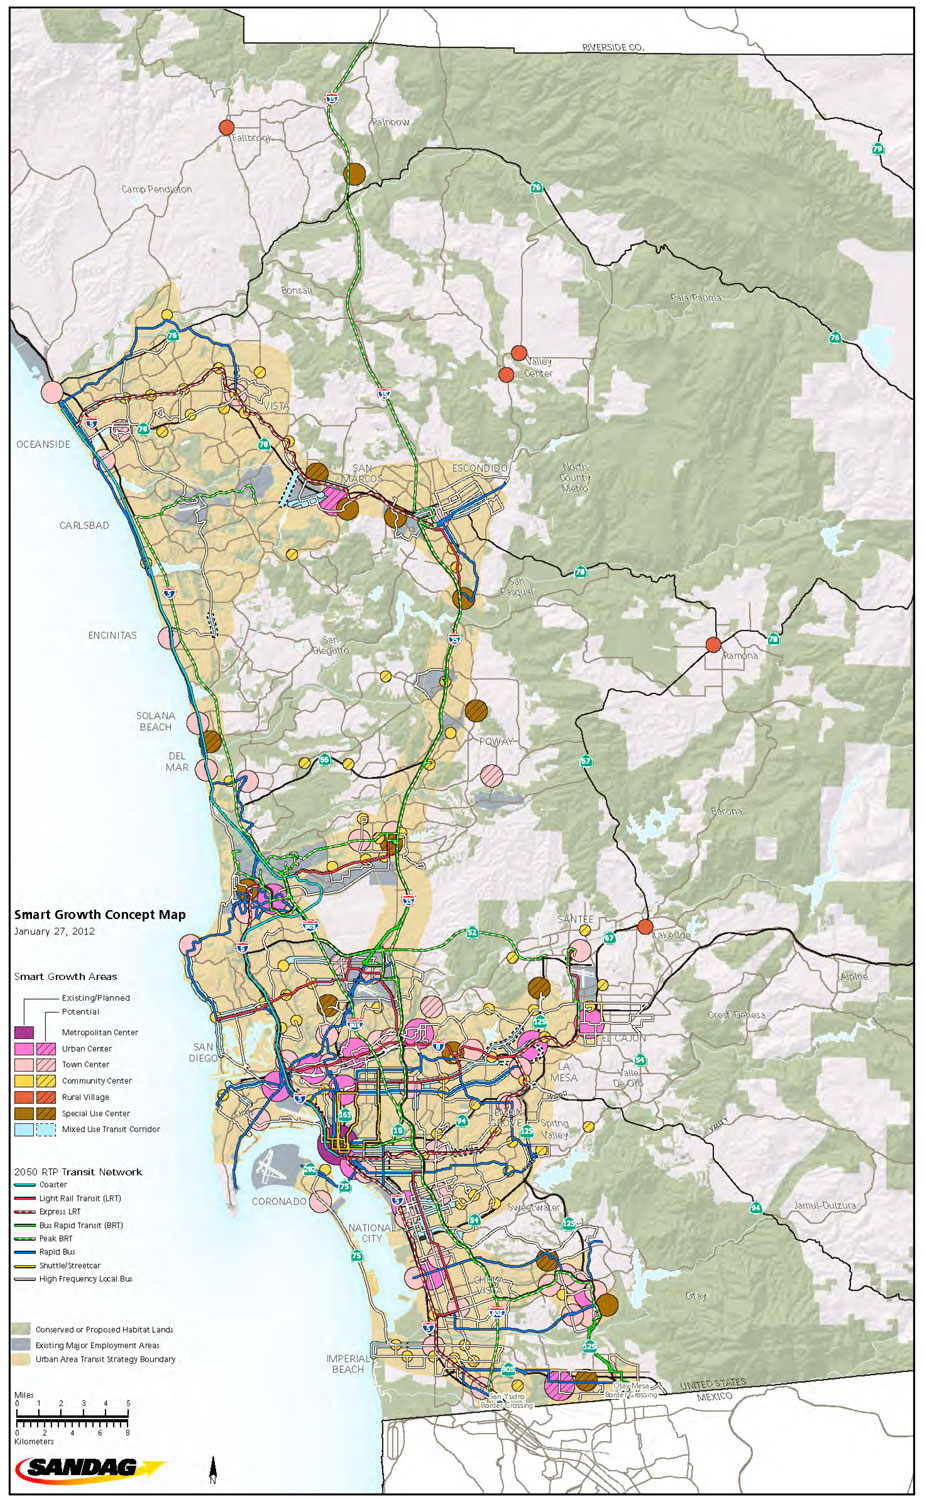
Historic development trends in the corridor generally have not supported transit use as the majority of land in the NCC was developed when local land-use decisions encouraged low-density, single-use development. This land-use configuration required an extensive highway and arterial network to connect origins and destinations. However, passenger rail service in the corridor has experienced significant investment and growth over the last few decades. In 1971, Amtrak first introduced its coastal rail service, formerly called the San Diegan. In 1995 and 2008, the COASTER and SPRINTER rail transit services were added, respectively. Considering the limited amount of remaining undeveloped land in the corridor, local jurisdictions and the San Diego Association of Governments (SANDAG) are re-examining existing land use policies and development patterns. They have developed policies to introduce Smart Growth development clusters into the corridor to accommodate future growth with higher-density, mixed-use development serviced by transit; however, most land uses in the NCC are still auto-dependent and will remain so in the coming decades.
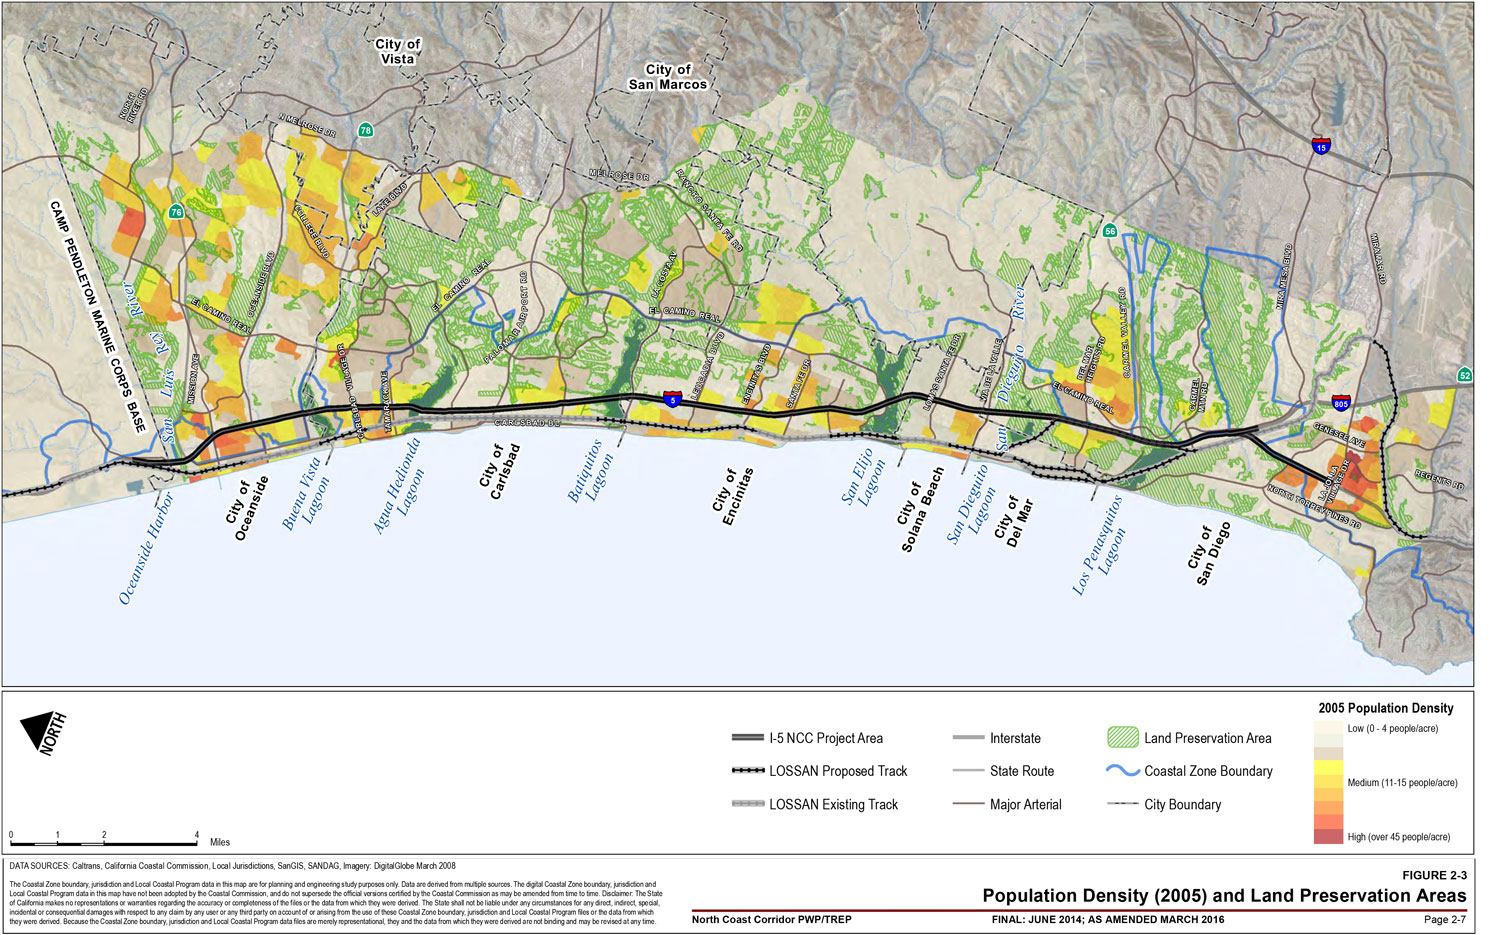
Within the corridor, existing land uses vary. The majority of land located directly adjacent to the coastline–including the LOSSAN rail and I-5 highway rights-of-way–has been developed for residential, light industrial, and commercial use and much of the corridor's population density occurs along these transportation facilities; however, many significant coastal open space and natural resource areas also occur along the I-5 highway and LOSSAN rail rights-of-way, particularly where these facilities cross Los Peñasquitos Creek, Carmel Creek, the San Luis Rey River, and the Los Peñasquitos, San Dieguito, San Elijo, Batiquitos, Agua Hedionda, and Buena Vista Lagoons. Figure 2-3 illustrates the existing population density distribution and land preservation areas in the corridor.
Travel demand in the project area has increased and has generally been influenced by population and employment growth in the region (Table 2-1). From 1970 to 2010, the San Diego County population grew by 137%.2 During that time, most of the coastal communities, with the exceptions of Solana Beach (132%) and Del Mar (13%), grew even more rapidly, with Carlsbad growing more than 500%. In 2010, approximately 525,000 people were residing within the NCC (16% of the regional population). An additional 122,000 people are anticipated to live in the corridor by the year 2040 (an increase of 23%), but this is a significantly reduced growth rate than that experienced in the corridor between 1970 and 2010 (397%). Figure 2-4 illustrates future population density distribution in the corridor.
Table 2-1: Population and Employment (North Coast Corridor)
Location
Population 1970
Population 2010
Population 2040
Employment 1970
Employment 2010
Employment 2040
Oceanside
40,494
179,105
214,530
12,040
41,620
60,377
Carlsbad
14,944
103,491
127,434
1,779
59,274
83,538
Encinitas
17,210
64,599
75,446
3,151
25,633
31,080
Solana Beach
5,744
13,338
15,619
1,050
7,099
8,671
Del Mar
3,956
4,455
5,059
1,004
4,627
4,690
San Diego (NCC Only)
23,315
160,290
209,744
2,832
140,763
170,209
North Coast Corridor
105,663
525,278
647,832
21,856
278,284
358,565
San Diego Region
1,357,854
3,224,432
4,163,688
566,900
1,401,100
1,877,668
Source: SANDAG/Caltrans Series 12 Model, November 2011.
Note: Existing (2010) populations are from the SANDAG/Caltrans Series 12 Model, and differ slightly from the final figures published in the 2010 U.S. Census.
Figure 2-1
- Regional and Corridor Map
In 2010, there were approximately 210,000 housing units in the corridor (18% of the regional housing stock). Nearly 32,000 additional housing units are anticipated to be constructed within the corridor by 2040 (a 15% increase over current conditions). In 2010, corridor employment was approximately 278,000 (slightly less than 20% of the region's total employment). By 2040, corridor employment is expected to increase to 358,000. Employment within the corridor is primarily located along established transportation routes or concentrated into large activity/employment centers. The majority of jobs in the corridor are located in the City of San Diego, particularly within the Sorrento Valley, Sorrento Mesa, University City/Golden Triangle areas, and at the University of California, San Diego (UCSD). Future employment in the corridor is expected to continue to grow within the established employment centers, along with expanding employment centers in the eastern portions of Carlsbad and Oceanside.
Figure 2-2
- Coastal Zone Jurisdiction Overview
Population growth in neighboring regions, which often exceeds that of the corridor because of the availability of affordable housing and developable land, also affects travel demand in the corridor by generating pass-through traffic to and from the borders with Mexico and the counties of Riverside, Imperial, Orange and Los Angeles. While the 2040 population of San Diego County is expected to increase by 29% from its 2010 level, in this same timeframe the neighboring Imperial County, Riverside County, and Baja California, Mexico, are projected to experience population growth rates of 94%, 87%, and 65%, respectively.3 Travel between San Diego and these regions is expected to lead to additional increases in trips (and therefore additional congestion) in the NCC.
Figure 2-3
- Population Density (2005) and Land Preservation Areas
Figure 2-4
- Population Density (2050 Projected) and Land Preservation Areas
2.1.1.1 City of San Diego4
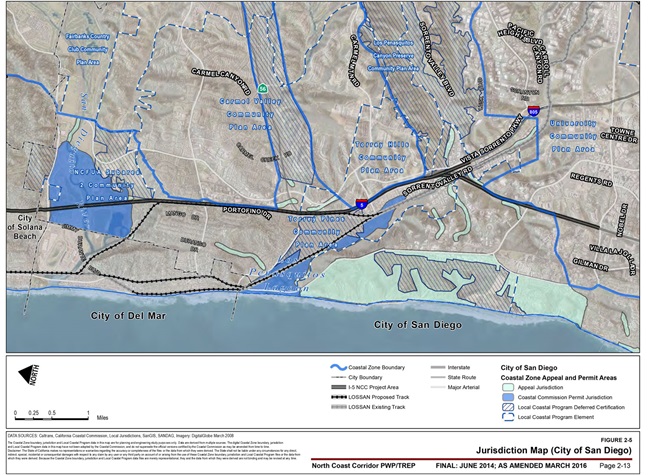
Figure 2-5
- Jurisdiction Map (City of San Diego)
Existing Land Use
San Diego is the most populous city in the county. San Diego had a 2010 population of over 1.3 million people and has an overall land area of 342.5 square miles.5 The city comprises 52 communities, five of which are located within the NCC: La Jolla, University City, Torrey Pines, Torrey Hills, and Carmel Valley. These communities are located in the northwestern area of the city.
Within these communities, primary land uses include parks/open spaces; residential, commercial, light industrial; and UCSD. Residential land uses are generally located in Carmel Valley, Torrey Pines, and Torrey Hills and the communities surrounding UCSD (University City and La Jolla). Parks and open spaces, which include Torrey Pines State Reserve and Los Peñasquitos Canyon Preserve, are prominent in the areas surrounding the I-5/I-805 junction (University City and Torrey Pines). In the northernmost area of the city (south of Solana Beach), a large open-space corridor, consisting of land mostly restricted from development, has been established within San Dieguito River Valley. Commercial land uses are generally located along major transportation corridors (including I-5, Del Mar Heights Road, La Jolla Village Drive) and surrounding UCSD. Industrial/employment land uses are concentrated in areas surrounding the I-5/I-805 junction (University City and Torrey Pines) and include high concentrations of employment in Sorrento Valley and North University City. UCSD–with a 2011 campus enrollment of 29,300 students and a 1,200-acre campus–is located in the La Jolla area of San Diego, which is south of the corridor.6 A portion of Del Mar Fairgrounds and Racetrack is located in the northernmost area of the city (south of Solana Beach), with the remainder of the property located in Del Mar. UCSD, Sorrento Valley, North University City, and Del Mar Fairgrounds and Racetrack are large trip generators in the corridor, though trips generated by Del Mar Fairgrounds and Racetrack are seasonal, occurring in the summer months. Figure 2-5 illustrates the portion of San Diego in the Coastal Zone and coastal permit jurisdiction boundaries.
Development Trends
For the past 40 years, the City of San Diego, like other California cities, has experienced rapid population growth and urbanization. Because the majority of land within the city has been developed, the city is planning for more infill development in the future. The City of San Diego General Plan (adopted in 2008) shifts the focus from how to develop vacant land to how to reinvest in existing communities. The plan focuses on growth into mixed-use activity centers that are pedestrian-friendly and that are linked to an improved regional transit system. The strategy intends to preserve established residential neighborhoods and open spaces while managing the city's long-term growth.
Local Coastal Program
San Diego has a fully certified LCP and issues coastal development permits throughout most of its Coastal Zone area. The City of San Diego LCP consists of 12 segments. One segment is the North City LCP, which is divided into individual communities, each with its community plan or coastal land use plan. The City also prepared a Multiple Species Conservation Program Subarea Plan for the region's Natural Community Conservation Plan, which is a certified element of the LCP. Although the LCP land use plan is segmented and, in the case of the North City segment, subdivided into individual community plans, the local implementation plan consists of a single element. Not all areas included in the North City LCP have been fully certified; thus, the Coastal Commission has jurisdiction to issue coastal development permits in the uncertified areas based on consistency with the California Coastal Act. The areas of deferred certification relative to the PWP corridor are as follows:
Via de la Valle Specific Plan includes approximately 100 acres east of I-5 and north of Via de la Valle.
South Slopes includes a number of small, unplanned areas on the south slopes of the San Dieguito River Valley, east of I-5 and on properties outside the 100-year floodplain.
Carmel Valley includes approximately 400 acres along Carmel Creek, east of I-5 at Carmel Valley Road and situated within the Neighborhood #8 Precise Plan area (a certified area). This area includes portions of the valley located within the City's Urban Reserve (and outside of North City West area) further east.
Los Peñasquitos Regional Park includes approximately 600 acres in Los Peñasquitos and Lopez Canyons, at the easterly end of Sorrento Valley Boulevard.
Torrey Pines State Natural Reserve is a 75-acre area that includes a mesatop and steep coastal bluffs.
Cal Sorrento Property includes approximately 25 acres located just east of I-805 and north of Los Peñasquitos Creek.
The areas of deferred certification are shown on Figure 2-5. The PWP improvements planned in San Diego would be located entirely in the North City LCP area and occur within University City, Torrey Pines, Torrey Hills, and the North City Future Urbanizing Area. Within San Diego, the proposed PWP/TREP improvements span areas both within and outside the Coastal Zone, and would be located in areas subject to the City's certified LCP as well as areas of deferred certification.
2.1.1.2 City of Del Mar7
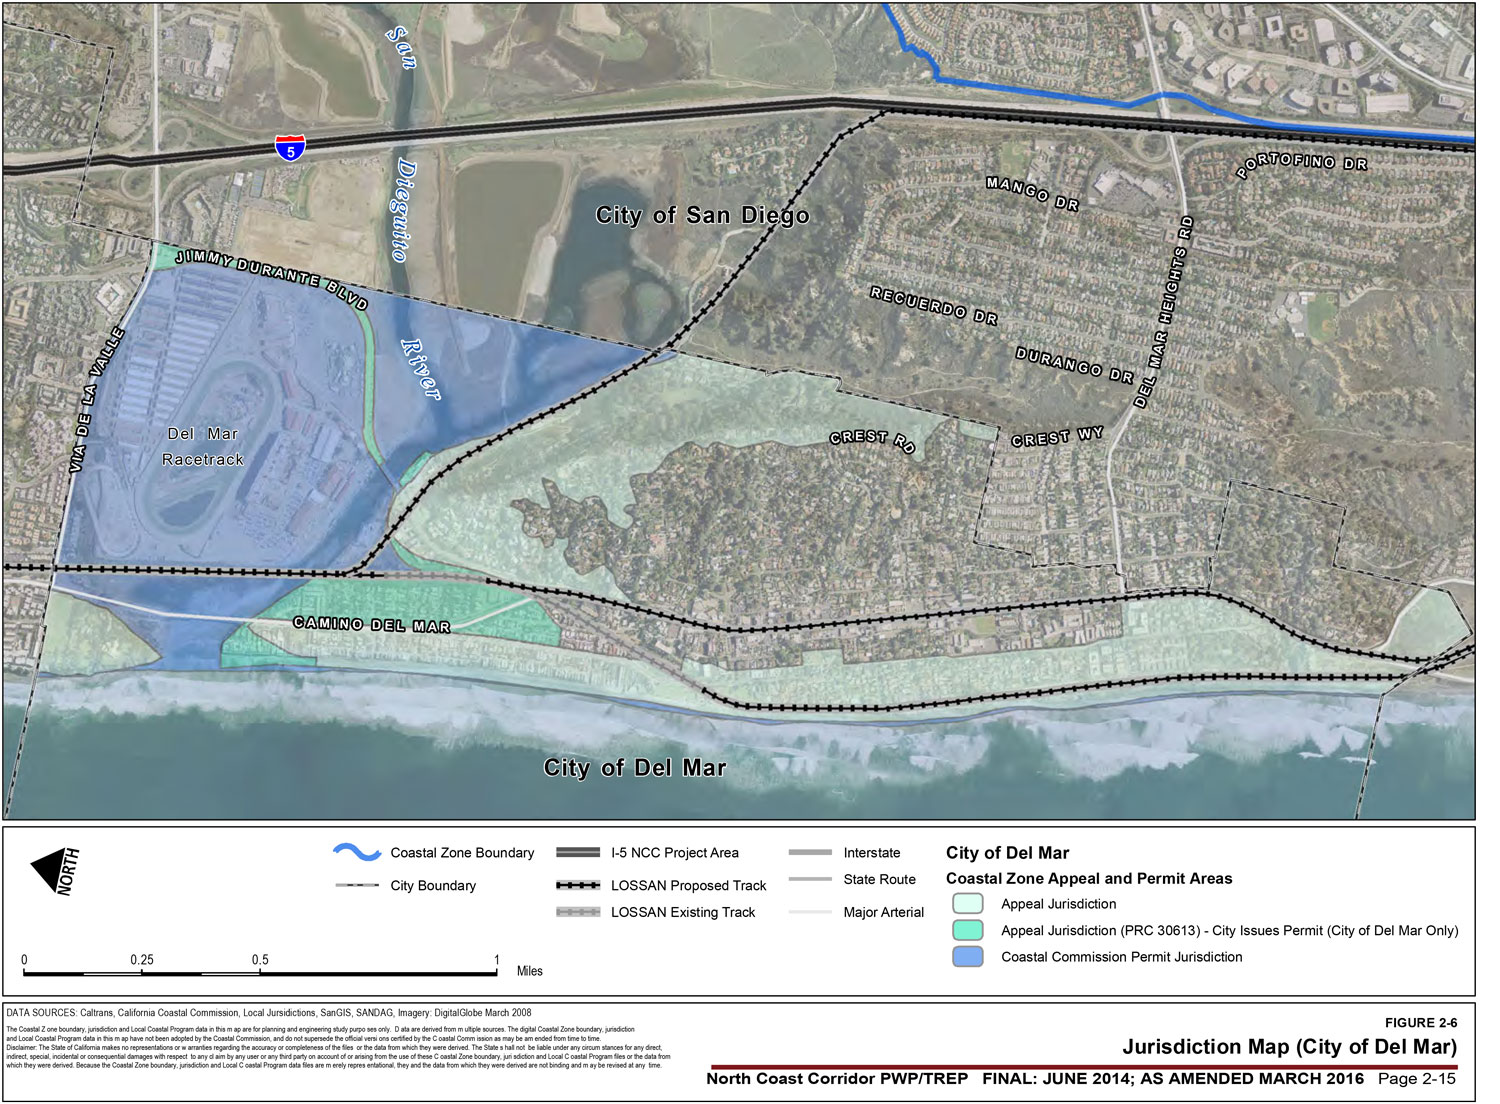
Figure 2-6
- Jurisdiction Map (City of Del Mar)
Existing Land Use
Del Mar is the smallest city in the NCC. The 2010 population was approximately 4,500 people8 and the overall land area is 1.79 square miles. It is a narrow, north-south oriented municipality bordered by Solana Beach to the north, San Diego to the east and the south, and the Pacific Ocean to the west. The city is located west of I-5. The LOSSAN rail corridor travels through Del Mar along the coast and bluffs at the south end of the city and then turns inland at the north end where it runs between Camino del Mar (Coast Highway) to the west and Del Mar Fairgrounds and Racetrack to the east.
Because of its small size and desirable location, Del Mar is urbanized and consists primarily of residential land uses. The 1993 City of Del Mar Local Coastal Plan divides the city into 10 districts, with allowable residential densities ranging from 1 to 17.5 dwelling units per acre (du/ac) specified for each district. The city also has interspersed commercial land uses along Camino del Mar, a major transportation corridor, within an area known as "Village Center." This area serves as the city's principal commercial, tourism, and professional area. Del Mar Fairgrounds and Racetrack, a regional sporting and entertainment venue, is located in the northernmost area of the city, extending slightly into the City of San Diego. San Dieguito Lagoon separates Del Mar Fairgrounds and Racetrack from residential uses to the south. The Del Mar portion of the Coastal Zone and coastal permit jurisdiction boundaries are shown in Figure 2-6.
Development Trends
Del Mar is almost entirely developed. Compared to the San Diego region, Del Mar has experienced, and will likely continue to experience low population growth. The city is mostly built out, has low housing vacancy rates, few multi-family developments, and high housing costs. Future development in the city will most likely consist of infill development and redevelopment on existing lots.
Development plans also exist for Del Mar Fairgrounds and Racetrack, which is managed by the 22nd District Agricultural Association, an independent agency of the State of California. The 2008 Del Mar Fairgrounds and Horsepark Master Plan propose immediate near-term and conceptual long-term projects to be developed over the next 15 years. The near-term projects are intended to maintain and improve existing facilities, while the conceptual longer-term projects, which require additional planning and regulatory approval, consist primarily of maintaining existing facilities and constructing a new hotel, sports complex, other structures, and trails. Included in the long-term projects is a special-event train platform adjacent to the existing LOSSAN tracks.
Local Coastal Program
Del Mar has a certified LCP and issues coastal development permits throughout most of its Coastal Zone area. Del Mar's LCP is certified as a single element and includes the city's Multiple Species Conservation Plan Subarea Plan. The 22nd District Agricultural Association lands located within the Del Mar LCP are in a deferred certification area. The Coastal Commission retains jurisdiction in this area and issues coastal development permits based in part on project consistency with the Coastal Act. PWP/TREP improvements within Del Mar are limited to rail line improvements and associated facilities including a proposed passenger platform. Within Del Mar, the proposed PWP/TREP improvements would be located in areas subject to the City's certified LCP as well as areas of deferred certification.
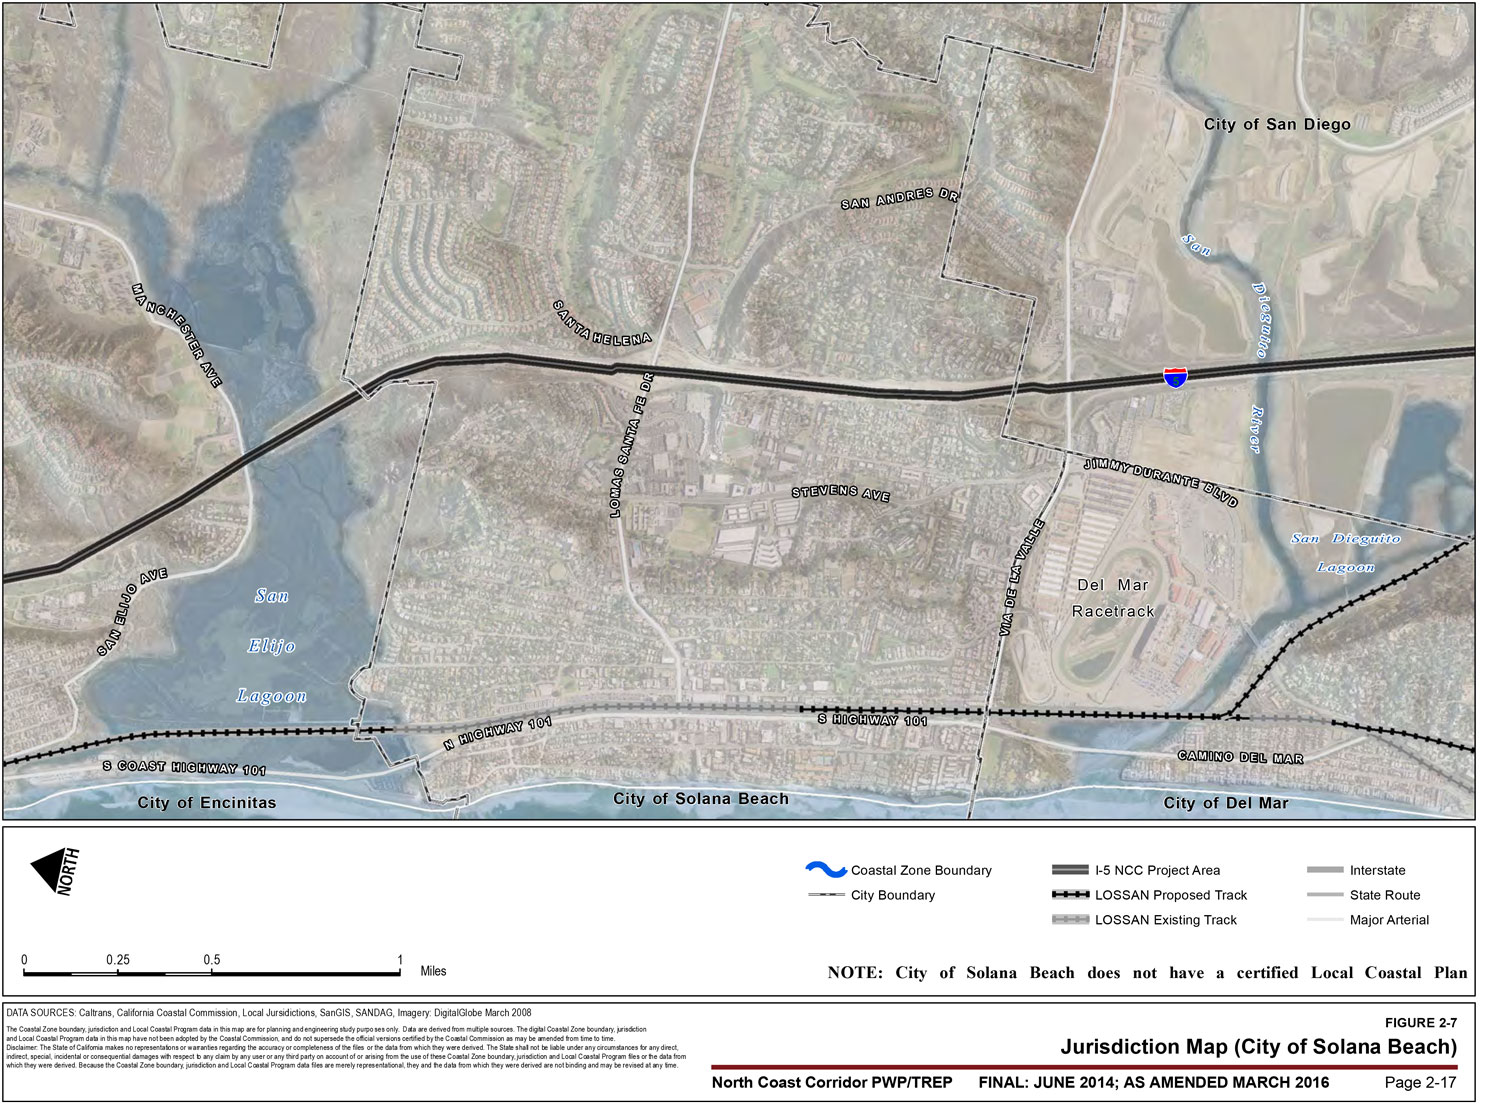
2.1.1.3 City of Solana Beach9
Figure 2-7
- Jurisdiction Map (City of Solana Beach)
Existing Land Use
North of Del Mar, Solana Beach is the second least-populous city in the corridor after Del Mar. Solana Beach had a 2010 population of approximately 13,300 people and has an overall land area of 3.42 square miles.10 Solana Beach is bordered by Encinitas to the north, unincorporated San Diego County to the east, Del Mar and San Diego to the south, and the Pacific Ocean to the west. The city is bisected by I-5. The LOSSAN rail corridor runs through Solana Beach parallel to, and east of, Coast Highway.
Due to its size and desirable location, Solana Beach is almost entirely developed. The majority of land consists of residential land uses, with densities ranging from 0.16 to 20 du/ac. Commercial land uses, including some mixed-use development, are located along transportation corridors, including Coast Highway, Cedros Avenue, and Stevens Avenue, and are in proximity to the Lomas Santa Fe Drive/I-5 interchange. Immediately west of I-5, south of Lomas Santa Fe Drive, commercial, public services, and industrial land uses are grouped into one area. East of I-5, there is a regional retail center and a golf course that weaves through residential developments. Immediately north of the city, partially within the city boundary, is San Elijo Lagoon. The LOSSAN rail corridor passes through a generally commercial area with some higher-density residential and mixed uses. The Solana Beach portion of the Coastal Zone and coastal permit jurisdiction boundaries are shown in Figure 2-7.
Development Trends
In 1986, when Solana Beach was incorporated, the population was estimated to be about 15,000 people. Since then, population estimates have decreased due to increased vacancy rates, a decrease in the average household size, and an increase in the number of housing units being purchased as second homes. Future development in the city will most likely consist of infill development and redevelopment in areas west of I-5, along Coast Highway, Cedros Avenue, and Lomas Santa Fe Drive, where scattered vacant sites are either designated or considered suitable for residential use. The city encourages the expansion of housing development opportunities through mixed-use development. Adopted amendments to the City of Solana Beach General Plan facilitate this growth stating the following: "In order to implement the city's redevelopment plan, mixed-use concepts of the Highway 101 Corridor Specific Plan, and the Housing Element, residential uses are allowed as a secondary use in conjunction with permitted commercial uses."
Local Coastal Program
Solana Beach is located entirely in the Coastal Zone; however, it is the only city in the corridor that does not yet have a fully certified LCP. The City's LCP land use plan component was approved with conditions by the Coastal Commission in March 2012; it is currently pending final approval by the City. The Coastal Commission will continue to have jurisdiction to issue coastal development permits within the city until approval of the City's LCP implementation plan component, which is under preparation.
2.1.1.4 City of Encinitas11
Figure 2-8
- Jurisdiction Map (City of Encinitas)
Existing Land Use
Encinitas is the fourth-most populous city in the NCC, with a 2010 population of approximately 64,600 people and an overall land area of 19.4 square miles.12 Encinitas is bordered by Carlsbad to the north, unincorporated San Diego County to the east, Solana Beach to the south, and the Pacific Ocean to the west. The I-5 corridor is located in the western area of the city. The LOSSAN rail corridor, located west of I-5, travels through the city, generally paralleling the east side of Coast Highway.
Encinitas is largely urbanized and consists of a mixture of residential, commercial, open space, and agricultural land uses. Residential land uses are the most prominent with densities ranging from 0.25 to 25 du/ac. Commercial land uses are generally located along major transportation corridors, including Coast Highway, Encinitas Boulevard, and El Camino Real. Agricultural land uses exist throughout the city, with larger areas located east of I-5 near the Encinitas Ranch Golf Course. Open spaces are also located east of I-5 near Batiquitos Lagoon, which is located at the northern city boundary; San Elijo Lagoon, which is located at the southern city boundary; and Encinitas Ranch Golf Course. Undeveloped land is located east of I-5 near Batiquitos Lagoon, west of I-5 at Santa Fe Drive, and east of South El Camino Real near Manchester Avenue. The Encinitas portion of the Coastal Zone and coastal permit jurisdiction boundaries are shown in Figure 2-8.
Development Trends
Like the majority of coastal cities in southern California, Encinitas has grown at a relatively rapid pace over the last several decades. As such, the City of Encinitas General Plan addresses growth-management and states policies and guidelines to facilitate development in a slower, more orderly way, in accordance with a long-term plan, to protect and enhance community values. Policy 2.3 states, "growth will be managed in a manner that does not exceed the ability of the City, special districts and utilities to provide a desirable level of facilities and services."
Much of the remaining undeveloped land within the city is constrained by environmental factors. However, there is potential to add infill housing units in mixed-use developments in downtown Encinitas and along Coast Highway.
Local Coastal Program
Encinitas has a fully certified LCP and issues coastal development permits throughout its Coastal Zone area. The City of Encinitas LCP is certified as a single element and includes the City's Multiple Habitat Conservation Program. There are no areas of deferred certification in Encinitas.
2.1.1.5 City of Carlsbad13
Figure 2-9
- Jurisdiction Map (City of Carlsbad)
Existing Land Use
Carlsbad is the third-most populous city in the NCC, with a 2010 population of approximately 103,500 people and an overall land area of 42.2 square miles.14 Carlsbad is bordered by Oceanside to the north, the cities of Vista and San Marcos to the east, Encinitas to the south, and the Pacific Ocean to the west. I-5 travels through the western area of the city. The LOSSAN rail corridor runs parallel to, and west of I-5 and east of Carlsbad Boulevard (Coast Highway).
Carlsbad is an urbanized municipality with a mix of land uses. Residential uses are predominant and concentrated in the northern and southern areas of the city. McClellan-Palomar Airport is located south of the Agua Hedionda Lagoon valley and north of Palomar Airport Road in the geographic center of the city. Because of health, safety and noise impacts associated with airport operations, residential and institutional uses are excluded from large areas around the airport. These areas have instead been developed into industrial and commercial uses or retained as open space. Thus, central Carlsbad has become a regional employment center. Commercial land uses are located along major thoroughfares including Carlsbad Village Drive and State Route 78 (SR 78), and east of I-5 (between Cannon Road and Palomar Airport Road). Vacant land is generally in areas surrounding the airport and industrial center. The city also has an interspersed golf course, public service, and public utility lands. The Buena Vista, Agua Hedionda, and Batiquitos Lagoons are located in Carlsbad. Carlsbad also has several large tourist attractions, including Legoland, "The Flower Fields," Westfield Shoppingtown Plaza El Camino Real, and the Carlsbad Company stores. The Carlsbad portion of the Coastal Zone and coastal permit jurisdiction boundaries are shown in Figure 2-9.
Development Trends
Since 1986, Carlsbad has been a "growth management" city, where major public facilities have been carefully planned and financed with defined capacities to best serve a targeted build-out population and number of household units. Future development patterns will be influenced by the city's unique landforms, nonresidential central area, the airport, and the regional employment center surrounding the airport.
To help preserve the quality of life for its residents, the city has developed the Carlsbad Growth Management Plan, which was ratified by voters in 1986, and is included in the 1994 Carlsbad General Plan. The Growth Management Plan ensures that adequate public facilities and services accompany new development. Additionally, the Citywide Facilities and Improvement Plan and the Local Facilities Management Plan have been established to provide a more orderly and systematic set of development guidelines. As of 2012, only 6% of Carlsbad's total land area is considered remaining developable land, with over half of that planned for residential development.15
Local Coastal Program
Carlsbad has a certified LCP and issues coastal development permits throughout most of its Coastal Zone area. The City of Carlsbad LCP consists of six segments: the Agua Hedionda Lagoon land use plan (which is not fully certified by the Coastal Commission); Mello I; Mello II; West Batiquitos Lagoon/Sammis Properties; East Batiquitos Lagoon/Hunt Properties; and the Carlsbad Village Redevelopment Area. In addition, Carlsbad completed a Multiple Habitat Conservation Program Subarea Plan, which has been incorporated into the Mello I, Mello II, West Batiquitos Lagoon/Sammis Properties, and East Batiquitos Lagoon/Hunt Properties segments of the City's certified LCP. Not all properties included in the City of Carlsbad LCP have been fully certified; thus, the Coastal Commission retains jurisdiction to issue coastal development permits in these areas. The areas of deferred certification consist of the following:
Tamarack Street 1 includes two properties located at the northwest corner of I-5 and Tamarack Street.
Tamarack Street 2 includes one property located at the southwest corner of I-5 and Tamarack Street.
Tamarack Street 3 includes two properties located at the northeast corner of I-5 and Tamarack Street.
Palomar Airport Road/Avenida Encinas includes one property located at the southeast corner of Avenida Encinas and Palomar Airport Road.
I-5/Poinsettia Lane includes properties described as Lots 2-7 of Specific Plan SP-186 located at the northwest corner of I-5/Poinsettia Lane.
Agua Hedionda Lagoon includes the lagoon area and adjacent upland areas. A coastal land use plan is certified for this segment; however, the segment will continue to be an area of deferred certification until an implementation plan for the segment is certified.
Areas of deferred certification within Carlsbad are shown in Figure 2-9. Within Carlsbad, the proposed PWP/TREP improvements would be located in areas subject to the City's certified LCP as well as areas of deferred certification.
2.1.1.6 City of Oceanside16
Figure 2-10
- Jurisdiction Map (City of Oceanside)
Existing Land Use
Oceanside is the second-most populous city in the NCC, with a 2010 population of just over 179,000 people and an overall land area of 42.16 square miles.17 Oceanside is bordered by Camp Pendleton to the north, the city of Vista and unincorporated San Diego County to the east, Carlsbad to the south, and the Pacific Ocean to the west. I-5 travels through the western area of the city. Just south of the city limits, the LOSSAN rail corridor crosses to the west of Coast Highway and continues parallel to the ocean.
West of I-5, Oceanside is highly urbanized. Residential land uses are predominant, with densities ranging from 0.9 to 43.0 du/ac. This includes transit-oriented development at the Oceanside Transit Center (COASTER/SPRINTER/Amtrak/bus) station. The eastern areas of the city are generally more rural in character, with a greater amount of open space, agricultural, and low-density residential lands. Oceanside has a well-defined commercial downtown extending north and south along both sides of Coast Highway. In addition to the downtown area, commercial land uses are also generally located along major transportation corridors including Mission Avenue, SR 76, and Oceanside Boulevard. Industrial land uses are concentrated east of I-5 and north of Oceanside Boulevard, in the Rancho Del Oro planning area. Vacant/undeveloped land uses generally surround existing industrial areas. The city also has interspersed public service, parks, golf courses, and agricultural lands. An open-space corridor of mainly undevelopable land associated with San Luis Rey River is located along the northern edge of the city. The Oceanside portion of the Coastal Zone and coastal permit jurisdiction boundaries are shown in Figure 2-10.
Development Trends
Since 1970, Oceanside's population growth has occurred at a higher rate than the overall San Diego region. During the 1970s and 1980s, the population grew by 82% and 67%, respectively. By 1995, approximately 75% of the land was developed. Approximately 10% of the remaining land is undevelopable.
The City of Oceanside General Plan identifies a broad range of residential land use categories, housing types, and densities. The city does not currently implement any growth-management activities to constrain residential development.
Local Coastal Program
Oceanside has a fully certified LCP and issues coastal development permits throughout its Coastal Zone area. The City of Oceanside LCP is certified as a single element. There are no areas of deferred certification in Oceanside. Within Oceanside, the proposed PWP/TREP improvements span areas both within and outside of the Coastal Zone boundary.
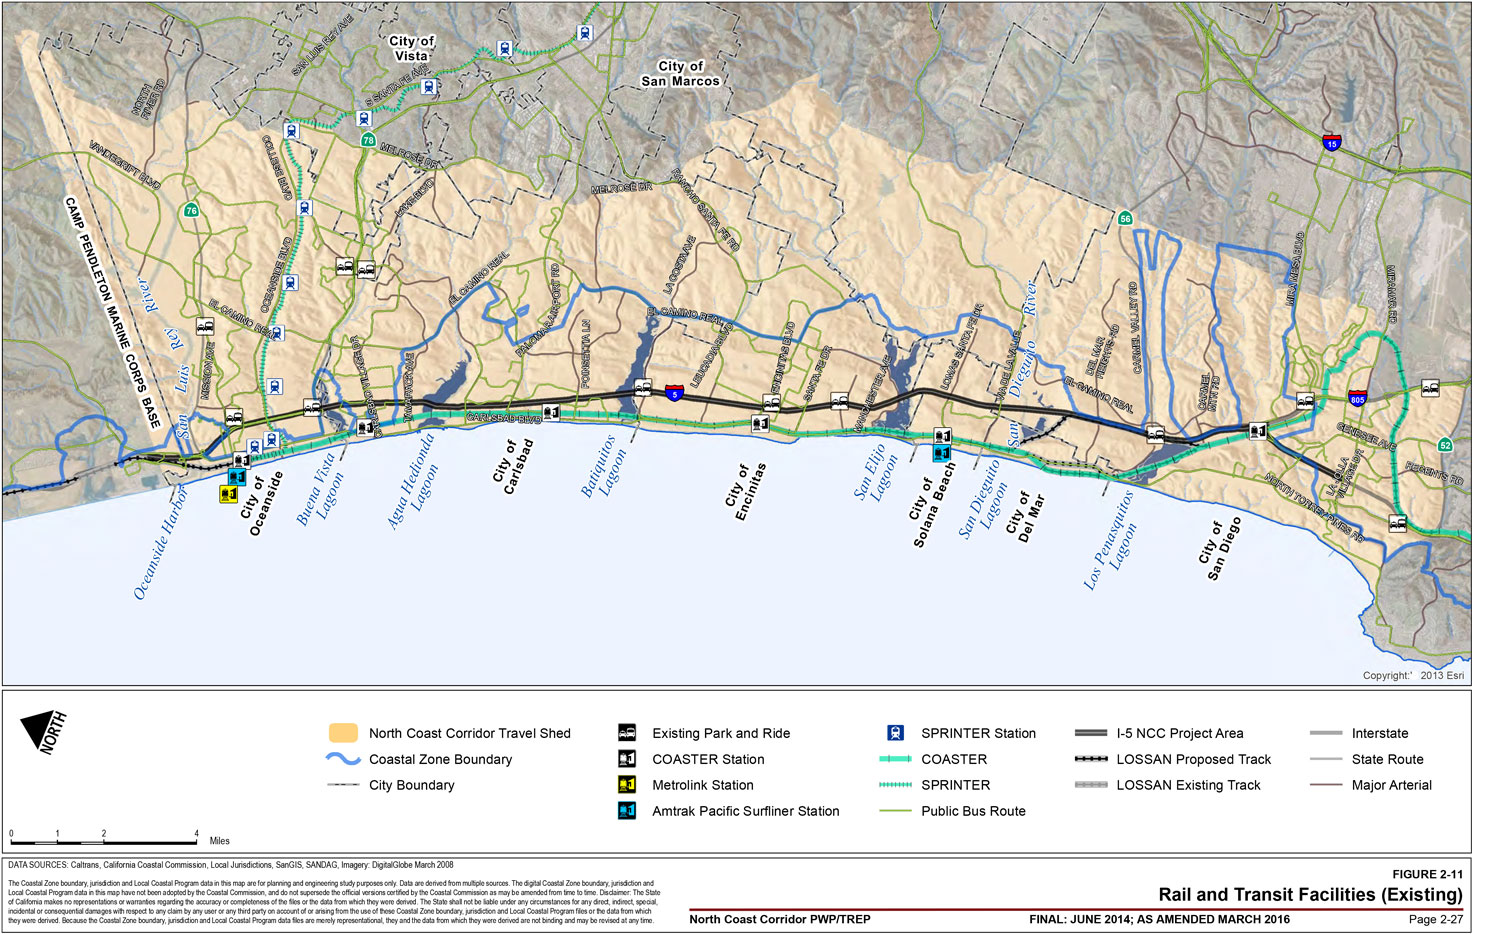
2.1.2 Existing Rail and Transit Facilities
The NCC features two rail corridors that transport passengers and freight, local bus services that are provided by two transit agencies, and vanpool and carpool services that are offered by both public and private entities.
2.1.2.1 LOSSAN Rail Corridor: Amtrak, COASTER, Metrolink, and Freight Rail
The LOSSAN rail corridor connects the major metropolitan areas of Southern California and the Central Coast, serves some of the most populous areas of the state, and runs roughly north-south through six counties: San Luis Obispo, Santa Barbara, Ventura, Los Angeles, Orange, and San Diego. It is the second-busiest intercity passenger rail corridor in the nation. Within the NCC, Amtrak's Pacific Surfliner intercity rail, COASTER and Metrolink commuter rail, and BNSF Railway and Pacific Sun Railroad freight services all operate along with parts of the corridor. Figure 2-11 illustrates the LOSSAN rail corridor as well as the other transit facilities in the NCC.
The LOSSAN rail corridor segment within the NCC was initially constructed by Santa Fe Rail Lines between 1881 and 1918. In 1992, the North County Transit District (NCTD) and the San Diego Metropolitan Transit System (MTS) acquired this segment of the rail corridor from the Atchison, Topeka & Santa Fe Railroad Company. Within the NCC, NCTD owns the northern portion of the LOSSAN rail tracks (from Oceanside to Del Mar), while MTS owns the portion located in the city of San Diego. In 1995, NCTD began operating the COASTER commuter rail service in the corridor from Oceanside to downtown San Diego. As rail use has increased, the rail corridor has approached design capacity, which has spurred regional interest in improving corridor infrastructure to increase capacity and operating performance to support existing and proposed levels of rail service. Just over 46% of the line is single-tracked, lacking the passing tracks that would allow trains to travel in opposite directions simultaneously.18 Thus, multiple operators are required to share one track for both directions of travel, which often results in long waits while one train is waiting for another to pass.
A study by the California High-Speed Rail Authority in 1998-1999 determined that the corridor was not appropriate for dedicated high-speed rail service because of the highly constrained corridor and much larger footprint required for high-speed rail; however, conventional rail improvements in the corridor merited further study. Amtrak's California Passenger Rail System 20-Year Improvement Plan (2001) and the California State Rail Plan (2002) addressed proposed capital improvements and performance goals for the statewide rail system, including the LOSSAN rail corridor. These studies began to define alternatives for the corridor and outline a program-level approach for environmental review of LOSSAN rail corridor projects. Caltrans began a program-level environmental review of proposed LOSSAN rail corridor improvement alternatives from Los Angeles to San Diego in 2002 and released a Notice of Preparation, published a Notice of Intent, and conducted scoping activities. The following year, the LOSSAN Corridor Strategic Plan reviewed the corridor-wide alternatives. A Draft LOSSAN Program Environmental Impact Report/Environmental Impact Statement (EIR/EIS) was released in August 2004. A Final Program EIR/EIS was released in September 2007 by Caltrans and its federal partner, the Federal Railroad Administration. The program-level environmental document allowed lead agencies to consider a future program of long-term improvements to the LOSSAN rail corridor. The project-level environmental review will be conducted for site-specific decisions.
The LOSSAN Board of Directors and member agencies are a Joint Powers Authority (JPA) formed to oversee efforts to improve the rail corridor. The LOSSAN Corridor-wide Strategic Business Plan was released in 2007 to provide a framework for future improvements for the entire 351-mile corridor. An updated study commissioned by the LOSSAN JPA Board of Directors, the Corridor-wide Strategic Implementation Plan, was released in 2012.
The COASTER commuter rail service, operated by NCTD, serves eight stations: Oceanside Transit Center, Carlsbad Village, Carlsbad Poinsettia, Encinitas, Solana Beach, Sorrento Valley, Old Town (San Diego), and Santa Fe Depot (downtown San Diego). With the exception of the two southernmost stations, all COASTER stations are located within the NCC. There are 22 to 26 COASTER train trips on weekdays, each with five-car trains operating under approximately 30-minute headways during the morning and evening peak periods, and less frequently during the off-peak. The average travel time between the Oceanside Transit Center and Santa Fe Depot is 57 minutes. There is service on Saturdays and Sundays as well (although with less frequency), plus special service during major sporting events. COASTER ridership has almost tripled since opening in 1995. The COASTER serves approximately 5,500 passengers each weekday and over 1.6 million passengers per year, with the majority of those customers beginning or ending their trips in the NCC.19
Metrolink commuter rail service is operated by the Southern California Regional Rail Authority and connects the Oceanside Transit Center with Orange, Los Angeles, Riverside, and San Bernardino Counties. Metrolink trains only serve the Oceanside Transit Center, the northernmost station in the NCC, providing a total of 16 trips (arrivals or departures) each weekday. On weekends, Metrolink runs a "Beach Train" (three times a day in each direction) that provides access from San Bernardino and Riverside to beaches in Orange County and Oceanside. In the fiscal year 2012, approximately 575 passengers boarded Metrolink each weekday at the Oceanside Transit Center, for a total of over 150,000 passengers annually.20
The Amtrak Pacific Surfliner provides intercity passenger rail service from downtown San Diego to Los Angeles Union Station and on to Santa Barbara and San Luis Obispo. Passengers can connect to Amtrak's interstate passenger rail services at Union Station. The San Diego-to-Los Angeles route is the second-busiest intercity passenger rail route in the nation, with over 2.6 million passengers annually. There are Pacific Surfliner trips on weekdays with frequencies of 60 to 90 minutes, and total travel time to Los Angeles of approximately 2 hours and 45 minutes. Trains stop at the Oceanside Transit Center, Solana Beach, Old Town, and Santa Fe Depot stations in San Diego County. During fiscal year 2012, approximately 766,000 passengers boarded the Pacific Surfliner at stations within the NCC, with approximately 422,000 boardings at Solana Beach and 344,000 at Oceanside.21
A new ride-sharing agreement between NCTD and Amtrak extends COASTER service to select Pacific Surfliner trains. Begun in November 2013, the program requires 6 Pacific Surfliner trains per day (3 in each direction) to stop at all COASTER stations in the NCC, rather than just at Oceanside and Solana Beach. Any passenger with a paid COASTER fare can ride these Amtrak trains at no extra cost. This effectively increases the frequency of COASTER service, providing better access to and from the NCC and further maximizing the capacity of the LOSSAN rail corridor.
Figure 2-11
- Rail and Transit Facilities (Existing)
Freight rail in the corridor services the movement of regional, interregional, interstate, and international goods. All freight services in the corridor are operated by BNSF Railway, which provides off-peak service from the Port of San Diego marine terminals to the Los Angeles area via four to eight daily trains, as well as short-haul services within the region operated by BNSF contractor Pacific Sun Railroad. The shared use agreement between BNSF, Southern California Regional Rail Authority, and NCTD prioritizes passenger trains over freight trains. This agreement also dictates a "restricted freight period" during which freight movements are strictly limited. Future demand is dependent on market forces and may lead to increases in the number of trains or to increases in train length.
2.1.2.2 SPRINTER Light Rail Transit
The east-west rail line in the NCC generally runs parallel to the SR 78 corridor. The SPRINTER light rail service operates approximately 18 hours per day and serves 15 stations on the 22-mile route between the Oceanside Transit Center and the Escondido Transit Center. Service is provided every 30 minutes in both directions. SPRINTER passenger service was initiated in March 2008 and now attracts over 2 million passengers annually, or approximately 7,000 passengers each weekday.22 The 2050 Regional Transportation Plan (RTP) contains plans to double-track the SPRINTER corridor by 2030, which will allow for increased frequencies as well as express service.
Freight service also runs on the east-west SPRINTER corridor and is temporally separated from passenger service. It is authorized to operate on weeknights between 10 P.M. and 4 A.M. Currently, the line is used two to three nights per week by BNSF and Pacific Sun freight trains, which traverse the corridor in approximately three hours.
2.1.2.3 Bus Network: MTS, NCTD, Private Operators
Both public and private buses operate within the NCC. Public bus service is provided by NCTD in the northern and central areas of the corridor, and by MTS in the south. Private coach services, Greyhound, and airport shuttles primarily use I-5 to make longer-distance trips through the corridor.
NCTD operates the vast majority of local bus service in the NCC. Its local buses branded "BREEZE," are the principal public transit option in all five NCC cities, with service reaching as far as the cities of Escondido and San Clemente and the communities of Ramona and Fallbrook. NCTD operates 34 bus routes that served 7.7 million riders in the fiscal year 2011; 15 of those routes serve the NCC, carrying approximately 4.5 million passengers during the year.23 This includes three COASTER Connection shuttles that operate from the Carlsbad Poinsettia Station during peak hours. These shuttle services meet COASTER trains to facilitate convenient passenger transfers, which improves the viability of COASTER as a commute mode since many employment centers are not within walking distance to rail stations. Several major employers in the area also provide private shuttles to and from the station.
In addition to traditional bus service, NCTD offers two on-demand "FLEX" services that provide door-to-door transportation to and from anywhere within the following designated service areas: southern Carlsbad (including Carlsbad Poinsettia Station) and Encinitas (including Encinitas Station). These services–which are available for an adult fare of $5, or for free to anyone with a COASTER monthly pass–enhance COASTER service by providing the "last mile" connection to homes and employment centers.24
MTS provides bus services in the southern portion of the corridor, reaching as far north as the University City neighborhood in the City of San Diego. Four MTS COASTER Connection shuttles operate principally in the NCC, linking the COASTER Sorrento Valley Station to employment sites in Sorrento Valley, Mira Mesa, and University City. As in Carlsbad, these public shuttle services are augmented by several private, employer-operated shuttles serving COASTER passengers. The other eight MTS bus routes in the NCC operate only at the southern edge of the corridor, providing service from University City to downtown San Diego, Old Town, and other major neighborhoods to the south.
Local bus routes in the NCC travel along regional arterials and local streets, with most of the public bus service in the corridor providing local circulation, serving short-distance trips, and acting as a feeder service to COASTER and SPRINTER services as well as local activity centers such as Camp Pendleton, Plaza Camino Real, and UCSD. With the exception of NCTD Route 101, which connects University City with Oceanside via Coast Highway, most bus services do not focus on serving regional and interregional trips.
2.1.2.4 Vanpools and Carpools
Some existing facilities and programs in the corridor encourage vanpooling and carpooling. SANDAG's Regional Vanpool Program provides subsidies to vanpool participants to encourage ridesharing. SANDAG subsidizes nearly 800 vanpools that serve approximately 6,000 passengers each weekday across San Diego County.25 SANDAG also provides ride-matching services to encourage carpooling. Additionally, nine park-and-ride parking lots are located in the corridor to facilitate carpooling, vanpooling, and regional transit ridership. High-occupancy vehicle (HOV) lanes, commonly known as "carpool lanes," are provided on I-5 from the interchange at I-805 to just south of the interchange at Manchester Avenue. On a typical weekday, about 3,600 vehicles use the northbound HOV lane during the PM peak period, and about 1,800 and 1,400 vehicles use the southbound HOV lane during the PM and AM peak periods, respectively.26 These figures are expected to grow significantly in the coming decades as travel demand continues to swell.
2.1.3 Existing Highway and Major Arterial Facilities
The NCC contains one major interstate highway that runs its entire length, several state highways of varying capacities, and multiple arterial roads. Together they comprise a roadway network that connects residents and visitors to the corridor's many residential, recreational, and community destinations.
2.1.3.1 Interstate Highways: I-5
I-5 is the principal north-south highway corridor in the western US and extends from the US/Mexico international border to the US/Canada international border. The federal government has named I-5 as one of six "Corridors of the Future" based on its essential role in interstate and international commerce.27 In Southern California, I-5 connects San Diego County with Orange County and the Los Angeles metropolitan area. At the northern edge of the NCC, I-5 provides the primary access to Camp Pendleton, the country's second-largest Marine Corps Base. Twenty miles south of the NCC, I-5 terminates at the San Ysidro Port of Entry, the world's busiest international border crossing.
Most of I-5 within the project area was planned and constructed in the 1960s and 1970s as part of the Interstate Highway System. Within the NCC, I-5 has eight general-purpose lanes (four northbound and four southbound) that are separated by a median barrier. In the southern portion of the NCC–from the I-5/I-805 merge in San Diego to just south of Manchester Avenue in Encinitas–the highway also contains one HOV lane in each direction. The freeway includes 24 local street interchanges (in San Diego, Solana Beach, Encinitas, Carlsbad, and Oceanside) and four freeway-to-freeway interchanges (at I-805, SR 56, SR 78, and SR 76). I-5 acts as a local circulation and commuter link for coastal communities, a regional route to the Los Angeles metropolitan area, and as a regional and an international goods movement corridor. By the late 1980s, traffic congestion on I-5 had increased significantly due to population growth and shifts in the region's economy.
Within the NCC, I-5 serves as the transportation backbone, carrying more than 700,000 vehicle trips on an average weekday to and from local communities, employment centers, and recreational facilities.28 Development of an additional north-south corridor to alleviate demand on I-5 is not feasible because of right-of-way limitations and natural resource constraints; thus, I-5 will be the only continuous north-south coastal route for the foreseeable future.
As congestion has grown on I-5, various studies have been initiated to determine how to best address corridor transportation. Between 1995 and 1997, Caltrans, SANDAG and other stakeholders conducted scoping meetings to initiate a Major Investment Study (MIS) for I-5, the LOSSAN rail corridor, parallel arterial streets, and other transportation modes in the NCC. Based on these scoping meetings, SANDAG developed the North Coast Transportation Study (the MIS for the NCC) in 2000. The MIS identified a range of transportation deficiencies and alternatives in the corridor along I-5 and I-805 between SR 52 and the Orange County line. Proposed improvements included the implementation of HOV lanes for the length of I-5 in the corridor, additional general-purpose lanes, and double-tracking on the LOSSAN rail corridor. Specific highway recommendations were developed concurrently by Caltrans in the Project Study Report for the I-5 NCC and supporting technical and environmental studies.
SANDAG's 2002 Regional High Occupancy Vehicle/Managed Lane Study determined that HOV demand in the corridor would require a four-lane HOV facility by 2030–an improvement that was then included in the 2030 RTP. A further technical study led to additional project elements such as the HOV viaduct on I-5 over Sorrento Valley, new general-purpose lanes in some segments, and direct access ramps. In November 2004, voters approved a 40-year extension of the TransNet sales tax measure, which is projected to generate $14 billion for regional transportation improvements. The I-5 NCC improvements were among those listed on the ballot measure to receive funding through this program. The 2006 SANDAG Managed Lanes Value Pricing Study deemed "value pricing" feasible for the corridor HOV lanes.29 Based on these studies, preparation of the I-5 North Coast Corridor Project Draft EIR/EIS was initiated and released for public review in June 2010.
Concurrently, the San Diego North Coast Corridor-Corridor System Management Plan (CSMP) was developed and released for public review in July 2010. A CSMP is required for the region to receive funds from California's Proposition 1B Corridor Mobility Improvement Account bond measure. Proposition 1B funding is directed to projects that move people and goods in California's most congested corridors. The CSMP looks at the entire integrated system of transit, local roadways, highways, pedestrians, and land use. The CSMP identifies priorities for each mode to phase improvements across jurisdictions and is a system- and performance-based approach to addressing mobility in the corridor.
Following the initial construction of I-5, few improvements to the corridor were made for several decades; however, in recent years, there have been multiple improvement projects, including freeway widening at the I-5/I-805 merge area, the addition of I-5 HOV lanes from the I-5/I-805 merge north to the Manchester Avenue interchange, construction of direct connector ramps (westbound SR 56 to southbound I-5) at the I-5/SR 56 freeway-to-freeway interchange, and other improvements. Additionally, Intelligent Transportation Systems (ITS) such as ramp meters and information displays have been introduced to the corridor to improve operations and capacity. The closest north-south highway alternative to I-5 is I-15, which parallels I-5 to the east. The I-5 and I-15 alignments are approximately 10 miles apart (separated by topographical barriers), and the I-15 corridor is a separate travel shed. (Travel sheds are defined considering the origin and destination patterns, traffic volumes, land uses, terrain, route junctions, and modes of travel.) I-5, as well as other regional arterials and state highways, are shown in Figure 2-12.
2.1.3.2 Regional Arterials and State Highways
Regional arterials and state highways provide access to and within the NCC. Coast Highway and El Camino Real, the two primary north-south arterials in the NCC, supplement some of the local circulation provided by I-5. Before the construction of I-5, Coast Highway was the main north-south coastal route. After the development of I-5, control of the four-lane road was relinquished by the state to the jurisdictions through which it passed: Oceanside, Carlsbad, Encinitas, Solana Beach, Del Mar, and San Diego. Correspondingly, the jurisdictions have renamed Coast Highway to the following: Carlsbad Boulevard (Carlsbad), Highway 101/First Street (Encinitas), South Highway 101 (Solana Beach), Camino del Mar (Del Mar), Pacific Highway (San Diego), and it remains as Coast Highway in Oceanside. The road parallels I-5 about 0.5 mile to the west, traversing many of the same water resources. Congestion on I-5 generally spills over onto Coast Highway as "cut-through" traffic, creating congestion as drivers seek an alternate north-south coastal route; however, traffic calming, commercial development, and pedestrian enhancements in some areas have made Coast Highway a pedestrian-oriented "Main Street" that does not provide a feasible alternative to I-5 for regional trips.
El Camino Real is the other north-south arterial in the corridor located 1 to 3 miles east of I-5. It runs through the newer, developing inland areas of San Diego, Encinitas, Carlsbad, and Oceanside and contains extensive commercial development near SR 76, SR 78, and SR 56 interchanges. El Camino Real is not continuous throughout the corridor, which prevents it from being a feasible alternative to I-5 for regional and some local trips. Within the corridor, El Camino Real runs from south of SR 56 to Via de la Valle in San Diego, and then again from Manchester Avenue in Encinitas to SR 76 in Oceanside.
Figure 2-12
- Highway and Major Arterial Facilities (Existing)
In addition to the north-south regional arterials, there are three east-west state highways that intersect I-5 and provide access to the corridor:
SR 76 is a four-lane expressway from I-5 east to North Santa Fe Avenue, and a four-lane conventional highway to Jeffries Ranch Road before tying into the existing two-lane winding road east to I-15 and beyond. SR 76 intersects I-5 near the northern edge of the NCC. It is listed on the California State Scenic Highway System and is an east-west corridor between the communities of western Riverside County and the work and recreational areas of north coastal San Diego County.
SR 78 (located 3 miles south of SR 76) is the principal east-west arterial for northern San Diego County that links I-5 with I 15 to the east. There is extensive commercial development along SR 78. It currently consists of three general-purpose lanes in each direction, and the construction of a new Express Lane in each direction is planned.
SR 56 (located 18 miles south of SR 78) is an east-west expressway corridor that connects I-5 with I-15 to the east. It currently consists of three general-purpose lanes in each direction; a new general-purpose lane in each direction is planned.
Numerous east-west arterials provide access to and from I-5 to the residential areas, places of employment, retail, and other destinations of the corridor. Many of these arterials have gaps due to environmental constraints. Capacity expansions or extensions are constrained by existing development and sensitive environmental resources.
2.1.3.3 Operations and Intelligent Transportation Systems
To better manage the existing transportation infrastructure through reduced congestion and improved reliability, the region employs electronic communications, equipment and information processing. Within the NCC, multiple ITS elements are being used. Real-time regional transportation information is distributed to travelers through 511, a phone- and Web-based service, which allows travelers to make informed decisions. Ramp metering manages traffic flow onto freeways to balance traffic flows. In the NCC, 48 of the 58 local street entrances to I-5 are metered. Four changeable message signs on I-5 also distribute travel information to drivers. Vehicle detection devices are located throughout the corridor to provide real-time data about the performance of I-5 to system operators.
The corridor includes about 30 miles of Pacific Ocean coastline with world-renowned public beaches, coastal sandstone bluffs, and six lagoons that are part of river valley systems. Scenic public beaches include La Jolla Shores, Torrey Pines State Beach, Del Mar Beach, Cardiff State Beach, San Elijo State Beach, Moonlight State Beach, Leucadia State Beach, Carlsbad State Beach, and Oceanside State Beach. The beaches are used for surfing, swimming, tide-pooling, camping, hiking, fishing, playing sports, and relaxing. At the NCC's designated state beaches alone (not including the numerous other public beaches), over seven million visitors were counted in the 2009-2010 fiscal year, which is more than twice the population of the entire San Diego region.30 Primary access to these coastal areas is accomplished by private automobile. On I-5, 19 of the 30 interchanges provide direct access to the corridor's beaches and harbors via major arterial roads. While the majority of access to the NCC's coastal areas is provided by vehicle, all of the corridor's north-south passenger rail services also support access to these coastal beaches and/or lagoons, with some circulation and local access obtained on foot and by bicycle, as discussed in the following section.
The lagoons in the corridor have varying levels of recreational and educational facilities, including trails and interpretive facilities. Many of the corridor lagoons provide coastal and upland recreation opportunities. Additional upland recreation areas within the corridor include San Luis Rey River Trail, Los Peñasquitos Canyon Preserve, Torrey Pines State Reserve, and San Dieguito River Park, in addition to several other smaller community parks and open spaces.
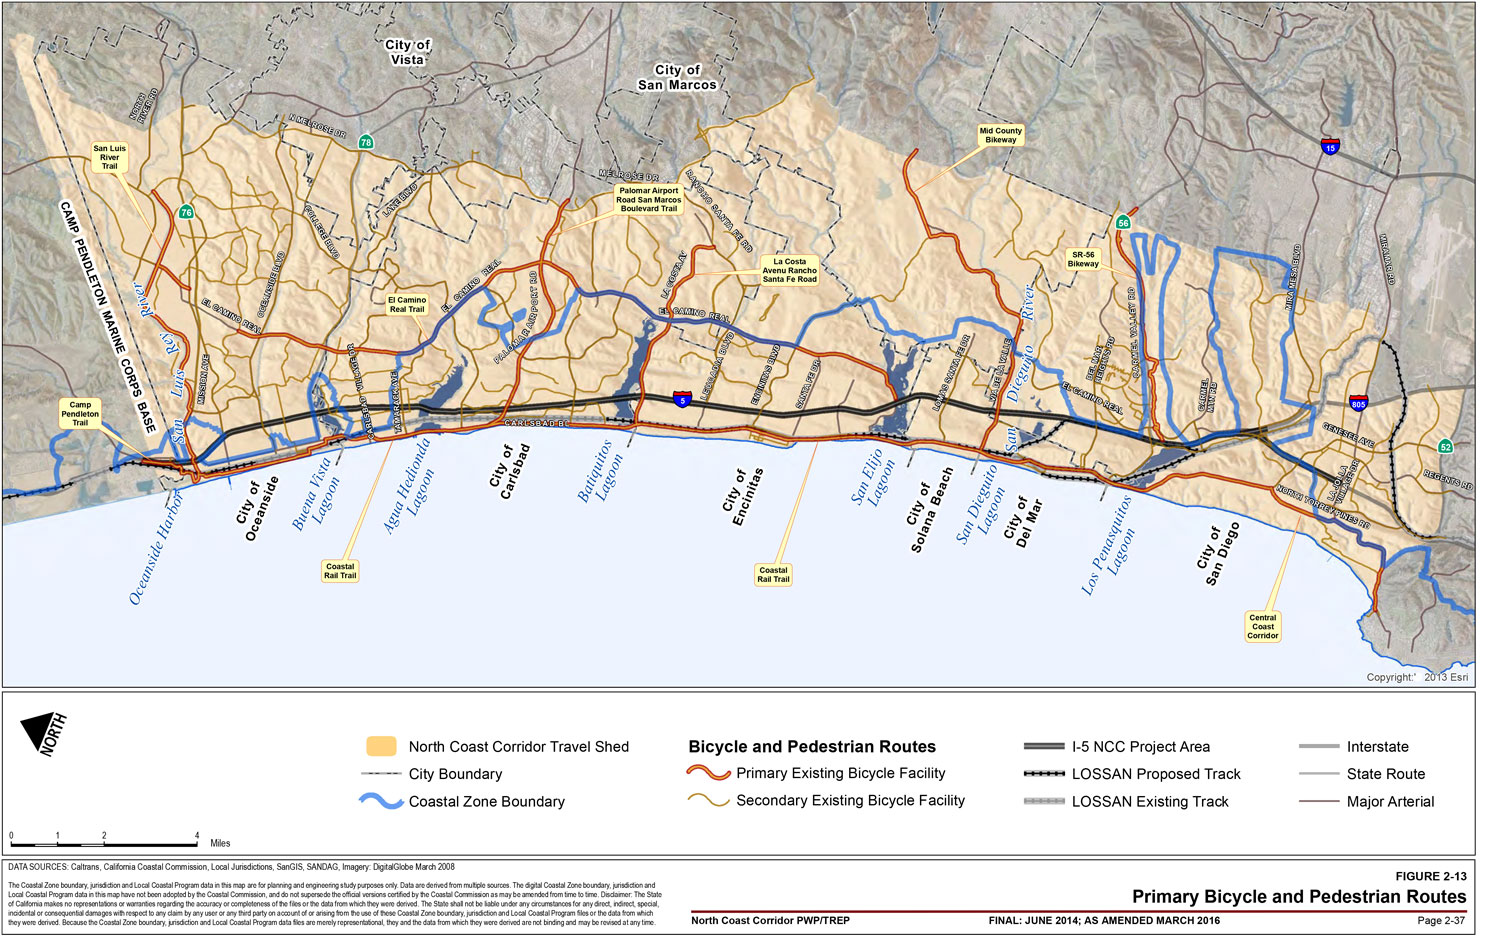
2.1.4.1 Bicycle and Pedestrian Facilities
Figure 2-13
- Primary Bicycle and Pedestrian Routes
Within the NCC there is an existing bicycle and pedestrian network that provides access to the coast and other upland recreation areas. Like the corridor's arterial network, gaps and barriers in the routes prevent fulfilling many local and longer-distance trip needs. Existing primary bicycle and pedestrian routes in the NCC include the Coastal Rail Trail, California Coastal Trail, Camp Pendleton Trail, San Luis Rey River Trail, El Camino Real Bikeway, Palomar Airport Road/San Marcos Boulevard Bikeway, La Costa Avenue/Rancho Santa Fe Road Bikeway, Mid County Bikeway, SR 56 Bikeway, and the Central Coast Corridor (Figure 2-13). These routes connect public beaches and parks, residences, town centers, transit centers, and other activity centers.
SANDAG's 2050 RTP contains $2.6 billion for an Active Transportation Program that seeks to improve bicycle and pedestrian facilities across the region, including the NCC. The program includes a Regional Bicycle Plan that encourages the development of a unified bicycle system throughout the San Diego region that serves the diverse needs of bicycle riders by providing connections between activity centers, transit facilities, and regional trail systems. One focus of this document is to improve bike and pedestrian network connectivity by providing links to the region's major bicycle facilities–including the Coastal Rail Trail as well as the planned I-5 North Coast Bike Trail (a part of the PWP/TREP). By addressing existing barriers to east-west pedestrian and bicycle travel, the enhancements in the PWP/TREP will help further this regional goal, while simultaneously improving access to coastal resources, LOSSAN rail corridor stations, and other community facilities.
The Coastal Rail Trail, once fully completed, will provide a continuous north-south Class I bike path through the corridor with direct access to coastal facilities. The Coastal Rail Trail is part of the Pacific Coast "Bike"-Centennial Bicycle Route, which is the length of the California coastline. This bikeway serves many users: short segments serve as ideal commuter access between adjoining communities; longer segments accommodate the recreational bicycle users as well as some commuters, and the full length of this bikeway within San Diego County serves the interregional user.
The California Coastal Trail is a parallel, complementary multimodal trail facility intended to be a continuous 1,200-mile public right-of-way along the California coastline. Within the NCC, the trail exists and/or is generally planned along the beach, roughly parallel to the Coastal Rail Trail (Figure 2-13). The trail California Coastal Trail fosters appreciation and stewardship of the scenic and natural resources of the coast through hiking and other complementary modes of non-motorized transportation. A primary goal of the trail, as articulated in the state-mandated, Coastal Commission-supported report, Completing the California Coastal Trail, is to "create linkages to other trail systems and units of the State Park system, and use the Coastal Trail system to increase accessibility to coastal resources from urban population centers."31 The Coastal Commission's Public Access Action Plan indicates that approximately 69% of the California Coastal Trail in San Diego County is completed, with approximately 20 miles of missing link located in North County at Camp Pendleton.
Within the corridor, many pedestrian and bicycle routes cross over or under the I-5 highway corridor and the LOSSAN rail corridor facilities. There are 35 such I-5 crossings and 33 rail crossings, with varying levels of quality. Physical crossings are not provided at all pedestrian/bicycle routes and rail/freeway facility intersections, which leads to dead-ends and in some cases, unpermitted track crossings.
Bicycle paths, lanes, and routes provide differing levels of separation from automobiles within the NCC. Some bicycle access is also allowed on the I-5 freeway shoulders, specifically between Sorrento Valley Road and Genesee Avenue in San Diego and from Vandegrift Boulevard to Las Pulgas Road north of Oceanside.
All of the corridor's major transit services–Amtrak, Metrolink, COASTER and SPRINTER trains, as well as MTS and NCTD buses–accommodate bicycles on their systems. The San Diego NCC coastline is reasonably well equipped to accommodate non-motorized travel modes; however, a number of east-west bike and pedestrian routes are still precluded from crossing the I-5 and LOSSAN rail corridor facilities due to incomplete or inadequate facilities.
2.1.4.2 Transit and Highway Access
With the exception of Sorrento Valley, all COASTER commuter rail stations in the corridor are located within blocks of a coastal beach or lagoon. In addition, 15 local bus routes serve the NCC, many of which terminate at COASTER stations. This information indicates that, in addition to its primary role serving commute trips, the NCC's transit infrastructure could also serve tourist and recreational trips to coastal areas. However, as discussed in Chapter 3, transit has struggled to attract riders in places like the NCC, where the population is sparse and trip origins and destinations are highly dispersed–a modern development pattern that is promoted, and best facilitated, by the automobile.
In addition, recreational trips to the coast often have group travel and baggage needs that make using transit less efficient or convenient. For travelers coming from outside the NCC, a transit trip to the beach typically requires multiple transfers, increasing total trip time and compounding baggage-related hassles. For NCC residents who could use local bus service to reach coastal areas, the short length of these trips often means that driving has substantial time and access advantages over fixed-route buses. Therefore, for both types of recreational travelers, transit generally is not competitive with driving.
As such, most coastal access in the NCC is facilitated by private automobile. As noted previously, I-5 has frequent exits that provide direct arterial access to the coast. During periods of high visitation such as summer weekends, corresponding travel demand leads to congestion on I-5 and thus impedes access to corridor coastal resources. Coast Highway provides an alternate access to coastal facilities, but as it is primarily reached from I-5 and the corridor's east-west arterials, congestion on I-5 also tends to impede coastal access via this route.
2.1.5 Existing Natural Resources
The NCC includes approximately 30 miles of coastline in northern San Diego County–a region recognized for a number of unique and significant marine and environmentally sensitive resource areas. The coastal watersheds, lagoons, and upland areas in the corridor consist of diverse habitats and ecosystems that support a variety of plant and wildlife species. The corridor's most significant natural resource areas, such as the corridor's six coastal lagoons, also support some of the region's most significant passive and active coastal recreational opportunities for San Diego residents and visitors. This section briefly describes the most prominent marine and environmentally sensitive habitat areas in the corridor, which are discussed in more detail in Chapter 5 of the PWP/TREP.
2.1.5.1 Hydrology and Water Quality
Surface hydrology within the corridor is influenced primarily by the lagoons, creeks, and San Luis Rey River. The corridor improvement areas cross the following five (of the eleven) hydrologic units (HUs) within the San Diego Regional Water Quality Control Board (RWQCB) Basin:
The Santa Margarita HU covers 750 square miles, with 26.5% in San Diego County and the remaining 73.5% in Riverside County. The watershed consists of single major drainage–the Santa Margarita River–which comprises several smaller tributaries. The San Diego County portion of the watershed contains the Camp Pendleton Marine Corps Base, as well as the inland community of Fallbrook. The Santa Margarita River HU is one of the least-developed watersheds in southern California and drains to the Oceanside Harbor at the southwest limits of the watershed.
The San Luis Rey watershed is the largest of the four HUs within the corridor and is the least developed; however, development within this watershed is expected to increase from approximately 16% to 23% by 2015.32 The entire basin is drained by the San Luis Rey River.
The Carlsbad HU comprises seven sub-basins that include San Elijo Lagoon (Escondido Creek), Cottonwood Creek, Batiquitos Lagoon (San Marcos Creek), Encinas Creek, Agua Hedionda Lagoon (Agua Hedionda Creek), Buena Vista Lagoon (Buena Vista Creek), and Loma Alta Creek. The freeway and rail bisect four lagoons in this HU: San Elijo Lagoon, Batiquitos Lagoon, Agua Hedionda Lagoon, and Buena Vista Lagoon. All four of the lagoon crossings, including Loma Alta Creek, are on bridge structures. Cottonwood Creek crosses under the freeway in a concrete culvert south of Encinitas Boulevard, and Encinas Creek crosses the corridor in a concrete box culvert south of Palomar Airport Road. Development within the Carlsbad HU is projected to increase from 56% to 70% by the year 2015.33
The San Dieguito HU drains into San Dieguito River. The developed area within the hydrologic unit is projected to increase from approximately 26% to 38% by 2015.34
The corridor begins near the middle of the Los Peñasquitos HU and crosses Carroll Canyon Creek, Los Peñasquitos Creek, and Carmel Creek. Existing facility crossings occur via bridge structures with the exception of Carmel Creek, which currently drains through a concrete box culvert. The developed area in this HU is projected to increase from 58% to 66% of the total watershed by the year 2015.35
The San Diego RWQCB Basin Plan (Basin Plan) defines "beneficial uses" for water bodies as those necessary for the survival or well-being of people, plants, and wildlife. These uses promote tangible and intangible economic, social, and environmental goals.
Most of the inland waterways provide or could provide the following beneficial uses: agricultural supply, industrial service supply, contact, and noncontact recreation, warm freshwater habitat, and wildlife habitat; the exceptions are Encinitas and Loma Alta Creeks, which are not designated for agricultural supply or industrial services supply. Additional beneficial uses include spawning, reproduction, and/or early development for San Dieguito River, and cold freshwater habitat for Soledad Canyon and Carroll Canyon Creeks and San Dieguito River. Los Peñasquitos Creek is designated for preservation of biological habitats of special significance, and beneficial use for rare, threatened, and endangered species are also assigned to Carroll Canyon Creek and San Luis Rey River. Beneficial use for hydropower generation is assigned to San Luis Rey River, and beneficial uses for groundwater resources associated with Loma Alta Creek and Encinas Creek include municipal and domestic supply (for both creeks) and industrial service supply (Encinas Creek only).
Beneficial uses for the lagoons in the corridor generally include contact and noncontact recreation; preservation of biological habitats of special significance, estuarine habitat (potential estuarine habitat for Buena Vista Lagoon), marine habitat, wildlife habitat, rare, threatened and endangered species; and fish migration and spawning, reproduction, and/or early development (with the exception of Buena Vista Lagoon, which is the only lagoon with the beneficial use of warm freshwater habitat). Beneficial uses for Los Peñasquitos Lagoon and Agua Hedionda also include shellfish harvesting, with additional beneficial uses assigned to Agua Hedionda for industrial service supply, commercial and sport fishing, and aquaculture. Loma Alta Slough is designated for contact and noncontact recreation, estuarine, marine and wildlife habitat, and rare threatened and endangered species. The mouth of San Luis Rey River is also designated for contact and noncontact recreation, marine, and wildlife habitat, and rare, threatened and endangered species, as well as for fish migration.
2.1.5.2 Corridor Lagoons
San Diego's lagoons provide habitat for sensitive animals and plants, stopping points for migratory birds, natural water treatment and flood prevention, scenic beauty, opportunities for passive recreation, and many other benefits. However, portions of these lagoons were historically filled to construct transportation facilities, and–coupled with build-out of the watershed to accommodate other adjacent developments and recreational use–increases in year-round freshwater input, accelerated sedimentation and water contamination, reduced tidal mixing, introduction of exotic species, and impacts on habitats and wildlife have occurred. Ongoing lagoon resource planning, restoration, and management has been implemented at varying levels for the corridor's lagoons and will continue to be essential in ensuring that the many floods, water quality, habitat, and recreational benefits of these significant watershed features are maintained and enhanced. The six lagoons in the NCC are Los Peñasquitos, San Dieguito, San Elijo, Batiquitos, Agua Hedionda, and Buena Vista. Three of the six lagoons have ongoing restoration programs. Restoration plans for the other three are being developed. Summary information about the status of each lagoon is provided in Table 2-2.
Los Peñasquitos Lagoon
Los Peñasquitos Lagoon is located in the northwest section of the city of San Diego. The lagoon area is owned entirely by public entities such as the State of California, City of San Diego, San Diego Metropolitan Transit Development Board, Caltrans, and San Diego Gas & Electric. The southernmost portion of the lagoon is part of the Torrey Pines State Reserve, and beach areas north and south of the lagoon mouth are State Parks recreation areas.
Los Peñasquitos Lagoon includes approximately 460 acres of tidal wetlands. The lagoon watershed includes Carroll Canyon Creek, Soledad Canyon Creek, Los Peñasquitos Creek, and Carmel Creek. Habitats present in, or within the vicinity of, Los Peñasquitos Lagoon primarily include coastal salt marsh, estuarine, coastal and valley freshwater marsh, southern riparian scrub, beach, Diegan coastal sage scrub, southern maritime chaparral, and valley and foothill grasslands. The lagoon provides important wildlife habitat for special-status species including Belding's savannah sparrow, light-footed clapper rail, and western snowy plover, migratory birds, a variety of mammals, and nursery grounds for many fish species.
The Los Peñasquitos Lagoon Enhancement Plan was developed in 1985 by the California Coastal Conservancy with partial funding provided by local developers and homeowner associations. The enhancement plan was certified by the Coastal Commission as a part of the City of San Diego's North City Land Use Plan. The management program called for water quality monitoring and mechanically opening the lagoon mouth to prevent poor water quality from killing channel organisms. The Pacific Estuarine Research Laboratory (PERL), based at San Diego State University, was contracted to monitor lagoon water quality. This effort led to the opening of the lagoon mouth in the early 2000s, which was approved by the Coastal Commission pursuant to Coastal Development Permit #6-02-13. The Los Peñasquitos Lagoon Foundation continues to work to keep the lagoon mouth open, monitor physical changes, restore habitat, and improve channel circulation.
San Dieguito Lagoon
San Dieguito Lagoon is located in the cities of San Diego and Del Mar and is owned by a variety of private and public entities. Public ownership includes the State of California, Cities of San Diego and Del Mar, the 22nd District Agricultural Association, NCTD, Caltrans, San Dieguito River Valley Land Conservancy, and the JPA. A large portion of the lagoon is owned by the California Department of Fish and Game (CDFG) and is maintained as a State Ecological Reserve, and much of the lagoon area along the San Dieguito River is owned by a JPA and is maintained as the San Dieguito River Park.
San Dieguito Lagoon is approximately 456 acres. The lagoon watershed includes the San Dieguito River and a number of drainages along I-5 that convey water to the river. Habitats present in or within the vicinity of San Dieguito Lagoon primarily include open water, estuarine/palustrine flats, salt marsh, brackish/freshwater marsh, coastal salt marsh, riparian scrub, and Diegan coastal sage scrub. The lagoon habitat supports special-status wildlife species including Belding's savannah sparrow, California least tern, western snowy plover, California gnatcatcher, and light-footed clapper rail.
The San Dieguito Lagoon Restoration Project, completed in 2011, restored 116 acres of coastal wetlands. The restoration project is designed to restore the aquatic functions of the lagoon through the excavation of uplands and to expand the tidal basin and create subtidal and intertidal habitats east and west of I-5 and permanent inlet maintenance. Upon completion, the lagoon will serve as a fish hatchery and a refuge for migratory waterfowl as well as open recreational space. Southern California Edison and the San Dieguito River Park Authority are partners on the project, which was required to mitigate impacts on marine fish populations from the San Onofre Nuclear Generating Station. Coastal Development Permit #6-04-88 was issued by the Coastal Commission in October 2005, and construction began in fall 2006. Maintenance of the functioning wetland is the responsibility of Southern California Edison until 2050.
San Elijo Lagoon
San Elijo Lagoon is located in the city of Encinitas just north of Solana Beach and is owned primarily by public agencies including the State of California (CDFG), the County of San Diego, and the San Elijo Lagoon Conservancy. The lagoon is part of the larger San Elijo Lagoon Ecological Reserve that includes approximately 1,000 acres of wetland and upland habitat. The reserve is operated by CDFG and includes the San Elijo Nature Conservancy Center.
San Elijo Lagoon area consists of approximately 491 acres. The lagoon watershed encompasses all drainages that convey water into San Elijo Lagoon including Escondido Creek and San Elijo Creek. Habitats present in, or within the vicinity of, San Elijo Lagoon primarily include open water (estuarine and fresh), sand/mudflats, coastal salt marsh, fresh/brackish marsh, riparian, and Diegan coastal sage scrub. In addition, San Elijo Lagoon and its upland habitat support a number of special-status wildlife species including California least tern, Belding's savannah sparrow, California gnatcatcher, and light-footed clapper rail.
Table 2-2: Lagoon Summary Table
Los Peñasquitos
San Dieguito
San Elijo
Batiquitos
Agua Hedionda
Buena Vista
Lagoon Owner/Operator
State Parks, City of San Diego, NTCD, Coastal Conservancy, Los Peñasquitos Lagoon Foundation
CDFG, san Dieguito River Park, JPA, County of San Diego, City of San Diego, 22nd Agricultural District, NCTD, Private
East of I-5: CDFG, County of San Diego, San Elijo Lagoon Conservancy
West of I-5: CDFG, San Elijo Lagoon Conservancy
State Lands Commission, CDFG, Port of Los Angeles, Batiquitos Foundation
CDFG, San Diego Gas & Electric, Leases to YMCA, City of Carlsbad, Private
CDFG, Buena Vista Lagoon Foundation, Private
Size
460 acres
456 acres
491 acres
600 acres
286 acres
203 acres
Watershed Features
Carroll/Soledad Canyon Creek, Los Peñasquitos Creek, Carmel Creek
San Dieguito River, Drainages along I-5
Escondido Creek, San Elijo Creek
San Marcos, Encinitas, Encinitas Creek
Agua Hedionda Creek
Buena Vista Creek
Habitat
Coastal salt marsh, estuarine, coastal/valley freshwater marsh, southern riparian scrub, beach, Diegan coastal sage scrub, southern maritime chaparral, valley and foothill grasslands
Open water estuarine/palustrine flats, salt marsh, brackish/freshwater marsh, coastal salt marsh, riparian scrub, Diegan coastal sage scrub
Open water (estuarine and fresh), sand/mudflats, coastal salt marsh, fresh/brackish marsh, riparian, Diegan, coastal sage scrub
Eelgrass, with mud flats, coastal salt marsh, brackish emergent marsh, riparian, Diegan coastal sage scrub
Open water, brackish/freshwater, mudflats, estuarine flats, patchy salt marsh areas, riparian, Diegan coastal sage scrub, eelgrass
LOSSAN Rail, I-5, Jimmy Durante Blvd, Coast Highway, El Camino Real
LOSSAN Rail, I-5, Coast Highway
LOSSAN Rail, I-5, Coast Highway
LOSSAN Rail, I-5, Coast Highway
LOSSAN Rail, I-5, Coast Highway, El Camino Real
Stakeholders, including the San Elijo Lagoon Conservancy, SANDAG, and Caltrans, are currently coordinating efforts to prepare a Draft EIR for the San Elijo Lagoon Restoration Project. Plans include the restoration of the hydrological regime and the marsh habitat and conversion from mudflats and low marsh habitat to middle and high marsh habitat. Two restoration alternatives under consideration include potential relocation of the lagoon inlet at Coast Highway, which could further enhance lagoon functions. Additionally, all of the restoration project alternatives under consideration will reduce tidal muting effects and enhance coastal lagoon habitat, particularly the mudflats.
Batiquitos Lagoon
Batiquitos Lagoon is located in the city of Carlsbad and is owned by a variety of private and public entities. Public ownership includes the State of California (CDFG) and the State Lands Commission. The lagoon is maintained as a State Ecological Reserve by CDFG; however, public recreational use of the lagoon area is limited to trails and an interpretative center operated by the Batiquitos Lagoon Foundation and located on the northern edge of the eastern basin.
Batiquitos Lagoon comprises approximately 600 acres with a watershed that includes all drainages that feed the lagoon including San Marcos and Encinas Creeks. Habitats within or in the vicinity of Batiquitos Lagoon primarily include open water that supports eelgrass, with mudflats, coastal salt marsh, brackish emergent marsh, riparian and Diegan coastal sage scrub at its perimeter. The large, open-water lagoon provides an important habitat for fish, waterfowl, and shorebirds. Batiquitos Lagoon also provides important habitat supporting special-status wildlife species such as California least tern, western snowy plover, Belding's savannah sparrow, California gnatcatcher, and light-footed clapper rail. The slopes of the lagoon are also important wildlife corridors for both large and small mammals.
A large restoration project in Batiquitos Lagoon was completed in 1996 to permanently restore tidal influence to the lagoon while protecting important habitat. Restoration and 10 years of maintenance and monitoring were completed by the Port of Los Angeles/Long Beach as mitigation for the loss of habitat in the Port's Outer Los Angeles Harbor. Coastal Development Permit #6-90-219 was issued in 2006 for the restoration and enhancement plan. The restoration project included 1) a rock tidal inlet structure to allow uninterrupted tidal flushing; 2) dredging to create habitats and maintain an open inlet; 3) replacement of two highway bridges (on Coast Highway); 4) scour protection for the I-5 and LOSSAN rail lagoon crossings, and 5) the creation and monitoring of least tern nesting sites. The CDFG is the long-term manager of the nature reserve.
Agua Hedionda Lagoon
Agua Hedionda Lagoon is located in the city of Carlsbad and is owned by a variety of private and public entities. Public ownership includes the State of California (CDFG), NCTD and Caltrans. CDFG maintains the eastern portion of the lagoon as the Agua Hedionda Lagoon Ecological Reserve, while NRG Energy, owner of the Encina Power Station, owns and maintains the western basin. Use of the lagoon is unique from that of the other corridor lagoons in that commercial, industrial and active recreational uses occur in the lagoon.
Agua Hedionda Lagoon is approximately 286 acres and is located in the Agua Hedionda and Macario Creek watershed. The lagoon is an important cultural, economic and environmental resource that provides critical habitat for migratory and resident birds and fish. Habitats present in, or within the vicinity of, Agua Hedionda Lagoon are primarily open water, brackish/freshwater, mudflats, estuarine flats, patchy salt marsh areas, riparian, Diegan coastal sage scrub, and eelgrass. The lagoon habitat supports special-status wildlife species such as Belding's savannah sparrow, California gnatcatcher, and light-footed clapper rail.
A restoration feasibility analysis for the lagoon was completed in 2004. Although, the Agua Hedionda Lagoon Foundation is active in the preservation and maintenance of the lagoon, a major lagoon restoration project has yet to occur. The foundation has expressed a preference for keeping the existing open-water regime at the lagoon, which is further supported by the approved desalination plant that will ultimately replace the power plant.
Buena Vista Lagoon
Buena Vista Lagoon is located in the cities of Carlsbad and Oceanside and is owned by a variety of private and public entities. Public ownership includes the State of California, Cities of Carlsbad and Oceanside, NCTD, and Caltrans. The lagoon is part of the Buena Vista Lagoon Ecological Reserve that is maintained by CDFG and is used for a variety of recreational activities.
Buena Vista Lagoon consists of approximately 203 acres and is located in the Carlsbad watershed that drains Buena Vista Creek. The lagoon itself contains the only U.S. Army Corps of Engineers jurisdictional wetland/waters within the watershed. Buena Vista Lagoon is a freshwater lagoon that, for the most part, is not connected to the ocean except through a non-adjustable weir. Habitat present within or in proximity to the Buena Vista Lagoon consists primarily of estuarine, freshwater, coastal and freshwater marsh, southern riparian scrub, and eucalyptus woodland. Bird and waterfowl nesting islands were created in the lagoon in 1983. The lagoon provides important habitat supporting special-status wildlife species such as Belding's savannah sparrow, California gnatcatcher, and light-footed clapper rail.
The Buena Vista Lagoon Foundation and its partners have completed a strategic plan and a restoration feasibility analysis that proposed potential hydraulic regimes–saltwater, freshwater, or mixed water–and project alternatives. Restoration alternatives are being examined further as part of an ongoing lagoon restoration project EIR/EIS. In 2012, SANDAG agreed to assume the role of lead agency in the project to advance the progress of the EIR/EIS and facilitate future engineering, permitting, and construction phases.
2.1.5.3 Existing and Potential Habitat Areas
Riparian/Wetland Habitat
In addition to the large coastal lagoon system discussed previously, the corridor includes a number of significant coastal and inland waterways that support sensitive habitat. These include Cottonwood Creek, Moonlight Creek, Encina Creek, Loma Alta Creek, and San Luis Rey River.
Cottonwood Creek is a small creek that flows intermittently above- and below-ground through Encinitas between San Elijo and Batiquitos Lagoons. Cottonwood Creek is primarily channelized or underground near I-5; however, several drainages feed into Cottonwood Creek from the east side of I-5 to the west side where the outlet to the Pacific Ocean has recently been restored. Restoration efforts have also included the creation of Cottonwood Creek Park west of I-5. In this area, the creek channel has been restored to an above-ground channel between I-5 and the ocean. Moonlight Creek is a small tributary in Cottonwood Creek Park that runs parallel to and west of I-5. Moonlight Creek primarily conveys urban runoff from both sides of I-5 into Cottonwood Creek. Cottonwood Creek and Moonlight Creek flow through an urbanized section of Encinitas. Cottonwood Creek often flows through culverts and channels near I-5 and does not provide much flood relief, water quality improvement, or wildlife habitat until reaching the newly restored channels in Cottonwood Creek Park. Moonlight Creek supports some freshwater marsh habitat and southern willow scrub and provides habitat to riparian bird species and limited water quality and flood relief benefits.
The Encina Creek watershed includes the creek itself and a long earthen drainage parallel to I-5 that is fed mostly by urban and freeway runoff, which then flows into the creek through a concrete channel. Encina Creek contains many invasive plant species and has been channelized along some of its length. The drainage paralleling I-5 supports cattails, amphibians, and bird species. Encina Creek provides limited wildlife habitat and water quality and flood relief; however, because it is disturbed, the function and value of the habitat are limited.
Loma Alta Creek is highly disturbed and is fed by several concrete-lined ditches. The creek extends from north of the California Street interchange to Mission Avenue. There is a riparian area just east of I-5 and north of Oceanside Boulevard that ultimately flows into the creek. Loma Alta Creek provides a limited amount of water quality filtration and flood relief; however, the creek's concrete lining and highly disturbed nature of the habitat minimizes these benefits.
San Luis Rey River is a significant resource and riparian feature within the corridor and is one of the few perennial rivers in San Diego County. The San Luis Rey River reach located within the corridor is a combination of open-water habitat, freshwater marsh, Arundo scrub, and riparian habitat that supports a variety of common and sensitive wildlife species. San Luis Rey River also plays an important role in flood relief and improves water quality, which results from filtering by freshwater marsh species.
Upland Habitat
The San Diego coastal climate supports a wide variety of sensitive upland habitat areas. The majority of the significant habitat within the corridor is contained in and around the six coastal lagoons, on undeveloped hillside areas and mesas, within the inland waterways, and along the shoreline. In addition to the plant communities present, there are several communities with little or no vegetation. These include mudflat, salt flat, open water, and unvegetated or other waters of the US. Sensitive upland habitats identified in the corridor include Diegan coastal sage scrub, Baccharis scrub, maritime succulent scrub, coastal bluff scrub, southern maritime chaparral, coastal sage, chaparral scrub, coast live oak woodland, Torrey pine forest, southern dune scrub, southern foredunes, and native grassland. Although not commonly considered a sensitive habitat type, nonnative grassland, and nonnative woodland areas often provide valuable nesting, roosting and foraging habitat for raptors, and, therefore, some areas may be considered sensitive habitat areas and subject to resource protection policies.
Plants
The mosaic of vegetation communities that occur in the corridor support a number of protected special-status plant species. Each of the six coastal lagoons supports coastal sage scrub, coastal bluff scrub, chaparral, native grasslands, bluff, and dune habitats, which are particularly recognized for supporting special-status plant species although the occurrence of such plants is not always associated with these habitats. Special-status plant species that occur within the corridor near the improvement areas that are listed as CDFG species of special concern, U.S. Fish and Wildlife Service (USFWS) candidate species, and non-listed California Native Plant Society rare and endangered plants include California adolphia, south coast saltscale, southern tarplant, Orcutt's pincushion, summer holly, sea dahlia, San Diego barrel cactus, Del Mar Mesa sand aster, Torrey pine, Nuttall's scrub oak, and Estuary seablite. In addition to these special-status species, a number of federal- and/or state-listed threatened and endangered species have been observed in the corridor near the improvement areas. These include the Del Mar manzanita, San Diego ambrosia, Encinitas Baccharis, thread-leaved brodiaea, San Diego button celery, spreading navarretia, and San Diego mesa mint. Section 5.5 includes a list of special-status, federal- and/or state-listed plant and animal species and a general description of their location in the corridor and listing status.
Wildlife
Resources along the corridor support a number of sensitive wildlife species that have special status and/or recognition by federal and state resource agencies. Federal-listed wildlife include the coastal California gnatcatcher; state- and federal-listed wildlife species include the least Bell's vireo, southwestern willow flycatcher, least tern, light-footed clapper rail, western snowy plover, tidewater goby, Southern steelhead trout, and Pacific pocket mouse; state-listed wildlife include the Belding's savannah sparrow and peregrine falcon; and Fully Protected Species include the clapper rail, least tern and peregrine falcon. Coastal sage scrub, southern maritime chaparral, and/or maritime succulent scrub have the potential to support San Diego horned lizard, Coronado Island skink, orange-throated whiptail, Rufous-crowned sparrow, raptors, loggerhead shrike, desert woodrat, and the San Diego pocket mouse.
Many bird species that migrate along the Pacific Coast flyway use the lagoons in the NCC to stop over and forage. Several of these bird species are considered sensitive at their breeding grounds, but not necessarily along their migration routes. These include the white pelican, long-billed curlew, and double-crested cormorant. The white-tailed kite–a California Fully Protected Species and Species of Special Concern–occasionally forages within the corridor (often over the agricultural fields). Nest sites are not known to occur within or in proximity to the PWP/TREP improvement areas. Other sensitive species known to occur in the corridor are the two-striped garter snake, least bittern, great blue heron, great egret, osprey, northern harrier, sharp-shinned hawk, Cooper's hawk, long-billed curlew, California horned lark, loggerhead shrike, and yellow warbler. Section 5.5 includes a list of special-status, federal- and/or state-listed plant and animal species and a general description of their observed location in the corridor and listing status.
The corridor also contains critical habitat for the least Bell's vireo, southwestern willow flycatcher, spreading navarretia, and California gnatcatcher. Vernal pools located in proximity to the corridor (near the Carlsbad Poinsettia Station) include a critical habitat for the San Diego and Riverside fairy shrimp. Habitat areas along the creeks, rivers and lagoons and adjacent upland areas also provide wildlife corridors from inland San Diego County to the coastal region and connect large areas of natural open space that allow for wildlife movement. The lagoons include potential Essential Fish Habitat for northern anchovy, Pacific sardine, and jack mackerel. Open water in the San Luis Rey River may also provide Essential Fish Habitat.
2.2 Policy Context: Regional Planning and Sustainability Efforts
SANDAG and Caltrans utilize and promote the programs, policies, and strategies described in this section to develop an integrated approach to strengthening both the transportation and environmental resources of the NCC and the region. Improved mobility and the protection and enhancement of natural resources are necessary to achieve transportation system objectives, to improve the quality of life in the region's communities, and to ensure sustainable growth into the future. With limited funding available to achieve all of these goals, regional planning is also bound by fiscal constraints that require a constant focus on cost-effectiveness and the balancing of regional needs.
2.2.1 Planning for Growth and Mobility
The explosive growth of the San Diego region in the last four decades serves as a reminder of the importance of effective planning by regional governments in order to ensure the provision of adequate and efficient infrastructure. As discussed in Chapter 3, the combination of rapid growth, fiscal and physical constraints, and the absence of reliable, multimodal travel options in the NCC have created both transportation and environmental deficiencies that continue to worsen. While the PWP/TREP will implement a comprehensive, multimodal solution to these deficiencies, a more desirable goal is to avoid the outgrowth of such deficiencies in the first place.
To deal with the region's continued growth–and to meet regional and state-mandated targets for energy consumption and air emissions–SANDAG employs a comprehensive, publicly influenced planning process that attempts to anticipate and accommodate future demands. The process begins with projecting regional population, employment, and housing needs decades into the future, which then informs the prioritization of transportation projects, housing and infrastructure development, and environmental preservation efforts. The results of this process are several policy documents that embody the goals and priorities of the San Diego region.
2.2.1.1 Regional Comprehensive Plan
SANDAG is responsible for developing the planning framework to integrate the region's land use and transportation system, and for managing regional growth while preserving natural resources and sustaining economic prosperity. The Regional Comprehensive Plan (RCP)–adopted in July 2004 and currently being updated–provides this planning framework upon which local and regional decisions can be made to move the region towards a sustainable future. It served as the basis for the 2050 RTP and its associated programs.
The RCP is notable for its emphasis on Smart Growth opportunities, which aim to concentrate housing and jobs in urban areas served by multimodal transportation systems. This type of growth discourages urban sprawl and preserves open space, agricultural, and natural resource areas. Smart Growth also advances the region's goals of mitigating the impacts of global climate change, including air emissions, sea-level rise, and shoreline erosion. (See Section 2.2.1.2 for more on the RCP and the region's Smart Growth efforts.)
2.2.1.2 2050 Regional Growth Forecast
The 2050 Regional Growth Forecast (adopted by SANDAG in February 2010) provides a starting point for regional planning. The forecast is not intended to be a prescription for future growth; rather, it is intended to anticipate future development patterns, based on a combination of regional projections and input from local cities.
Based on the land use information received from local jurisdictions, as well as predictions of likely development patterns in the future, the 2050 Regional Growth Forecast projects that approximately 50% of future job and housing growth will occur in Smart Growth opportunity areas, which are defined as locations in the region that can support future growth and infill development close to jobs, services, and transit and public facilities. These opportunity areas were designated to maximize the use of existing infrastructure and to preserve open space and natural resources. In addition, the growth forecast projects that more than 70% of future job and housing growth are likely to occur within transit investment areas, which are given the highest priority for future transit investments due to their transit-friendly density, land use, and demographic characteristics. The result will be that 56% of new residences and 42% of new jobs will be located within a 10-minute walk of high-frequency transit stations.36 The development of new multimodal transportation facilities will be necessary to meet these future demands.
2.2.1.3 SANDAG 2050 Regional Transportation Plan
The PWP/TREP and the associated I-5 NCC Project EIR/EIS utilize land use and growth projections from the SANDAG 2050 Regional Transportation Plan (2050 RTP), which was adopted in October 2011 as the region's transportation and growth blueprint. SANDAG adopted the following vision statement for the 2050 RTP:
A transportation system that supports a prosperous economy, promotes a healthy and safe environment, including climate change protection, and provides a higher quality of life for all San Diego residents. The transportation system should better link jobs, homes, and major activity centers; enable more people to walk, bike, and use transit; efficiently transport goods; and provide fast, convenient, effective transportation options for all people.
RTP Goals and Objectives
The 2050 RTP is based on six primary goals (Table 2-3). Taken together, the goals seek to:
Enhance regional mobility by expanding travel choices, including transit, ridesharing, walking and biking options, and single-occupant auto travel.
Ensure a reliable transportation system and travel times by improving traffic flow, reducing bottlenecks, and providing facilities that allow for consistent travel times with commensurate improvement of access to recreational destinations as well as general mobility.
Develop transportation improvements that respect and enhance the environment and meet state-mandated emissions reduction targets.
Table 2-3: Goals of the SABDAG 2050 Regional Transportation Plan
Source: SANDAG 2050 RTP (Chapter 2), October 2011
Goal
Definition
Mobility
The transportation system should provide the general public and those who move goods with convenient travel options. The system should also operate in a way that maximizes productivity. It should reduce the time it takes to travel and the costs associated with travel.
Reliability
The transportation system should be reliable. Travelers should expect relatively consistent travel times, from day to day, for the same trip and mode of transportation.
System Preservation and Safety
The transportation system should be well maintained, to protect the public's investments in transportation. It also is critical to ensure a safe regional transportation system.
Social Equity
The transportation system should be designed to provide an equitable level of transportation services to all segments of the population.
Healthy Environment
The transportation system should promote environmental sustainability, and foster efficient development patterns that optimize travel, housing, and employment choices. The system should encourage growth away from rural areas and closer to existing and planned development.
Prosperous Economy
The transportation system should play a significant role in raising the region's standard of living.
The RTP associates each broad goal with specific policy objectives to help focus the decision-making process. To support the goal of a prosperous economy, for example, one such policy objective is to "maximize the economic benefits of transportation investments."37 With financial constraints limiting the number of transportation projects possible, this objective requires selecting the projects that will yield varied needs, along with a rational assessment of which projects are most likely to attract users.
Sustainable Communities Strategy
The Sustainable Communities Strategy (SCS) is a new element of the 2050 RTP, its development mandated by California Senate Bill 375 (SB 375) (Chapter 728, Statutes of 2008). The SCS demonstrates how state-mandated greenhouse gas (GHG) emission targets, as established for the region by the California Air Resources Board, will be achieved through feasible development patterns, transportation infrastructure investments, and targeted transportation measures and policies. The 2050 RTP and SCS:
seek to guide the San Diego region toward a more sustainable future by integrating land use, housing, and transportation planning to create communities that are more sustainable, walkable, transit-oriented, and compact. Planning for future patterns of density, how people get around, and how land is used is driven by one goal: creating great places to live, work, and play.38
The SCS also includes the San Diego Regional Bicycle Plan (titled Riding to 2050) and was originally adopted in May 2010 and then integrated into the SCS in October 2011. The bicycle plan encourages the development of a unified bicycle system throughout the region that serves the needs of all bicycle riders by looking for the best way to provide connections to local and regional activity centers, transit facilities, and regional trail systems. As a component of the RTP and SCS, the bicycle plan provides overall assistance to local jurisdictions in their efforts to improve the safety of bicyclists, enhance education for bicyclists, and increase awareness about bicycle travel.
Urban Area Transit Strategy
To initiate the transit planning effort for the 2050 RTP, SANDAG developed an Urban Area Transit Strategy (UATS) focused on the most urbanized areas of the region where investments in transit are generally most efficient and effective. The UATS is another component of the 2050 RTP that was developed to help the region comply with SB 375. The primary goals of the strategy are:
Making transit more time-competitive with automobile travel.
Maximizing the role of transit within the broader transportation system.
Reducing vehicle miles traveled and greenhouse gas emissions in the region.39
SANDAG and the project team undertook an extensive planning process that involved developing a range of differing transit strategies and approaches to determine the kind of transit future that is desirable for the San Diego region. Public and stakeholder input was sought to identify three transit network alternatives, which were then evaluated using performance measures and mode share goals that the project team developed through a collaborative process. The UATS utilized a three-pronged approach to:
identify key corridors and communities that have the most potential for transit investments;
develop transit mode share goals (ranges) for each corridor/community; and
use the transit mode share goals and transit performance criteria to evaluate the alternatives and create a single transit network for incorporation into the 2050 RTP.
Transit Mode Share Targets
A primary output of the UATS is the establishment of transit ridership targets. Achieving SANDAG's regional GHG and vehicle miles traveled reduction goals will require an increase in the region's transit mode share, which is defined as the proportion of trips taken on public transportation. The 2050 RTP specifies that transit mode share will be measured using weekday, peak-period commutes between home and work, as this is the type of trip for which behavior shifts to transit are the most likely.
The current transit mode share (again measured only by peak-period commute trips) is 2 to 3% for the San Diego region as a whole and just over 5% in the SANDAG-defined urban area. Two of the region's densest areas boast significantly higher numbers: Downtown San Diego has a 24% transit mode share and the largely residential central core area (which includes Mid-City neighborhoods as well as parts of eastern San Diego) is just below 12%. All other parts of the region have transit mode shares well below 10%.40 For comparison, Table 2-4 lists the commute transit mode shares for selected U.S. cities; despite a handful of transit-centric areas, 17 of the nation's 30 largest cities have mode shares of 5% or less.41
Table 2-4: Commute Transit Mode Share (Selected U.S. Cities)
Source: U.S. Census American Community Survey, 2005-2009 5-Year Estimates; SANDAG 2050 RTP (Technical Appendix 7), October 2011.
* For consistency, this figure includes only the city of San Diego. As noted above, SANDAG data breaks this down further, revealing a 2-3% transit-mode share for the entire San Diego region, and a 5% transit-mode share for the SANDAG-defined urban area.
City
Commute Transit Mode Share
New York City
55%
Washington, DC
37%
San Francisco
32%
Chicago
26%
Seattle
19%
Portland, OR
12%
Los Angeles
11%
Goal for San Diego Urban Area and NCC
10-15%
Denver
8%
Houston
5%
Phoenix
4%
San Diego*
4%
San Antonio
3%
The 2050 RTP sets an ambitious goal of achieving a peak-period commute transit mode share of 10-15% in the urban area by 2050 (a 400% increase from current levels). Though it may be difficult to reach, this growth in transit mode share will be crucial to meeting GHG reduction targets. To achieve the transit mode share goals, SANDAG divided the urban area into districts and established district-level mode share goals based largely on the viability of transit in each area. Transit investments in the 2050 RTP were then allocated according to these goals, with the greatest investment going to areas where transit is most likely to succeed. Downtown San Diego and the central core–where density and land use patterns are most conducive to transit–are charged with raising their transit mode shares to +30% and 20-25%, respectively. The goal for the NCC (10-15%) is ambitious given the area's limitations to transit effectiveness (discussed in Chapter 3A) and would be a major improvement from the current share (2-3%). Overall, decisions made at the regional level to implement regional goals and address state-mandated GHG reduction targets have resulted in a planned allocation of transit resources and projects throughout the region that focuses on investment in the densest urban areas.
Goods Movement Strategy
The relationship between freight transportation and economic growth has long been recognized as an important ingredient in both regional and national policy. The 2050 Goods Movement Strategy (GMS), developed as part of the 2050 RTP, recognizes the importance of freight and goods movement to the region's economic prosperity and seeks to balance regional and national freight priorities.42 The GMS serves as the region's freight blueprint, emphasizing the efficient flow of economic goods to and through the San Diego region via truck, rail, maritime, and air modes. It identifies and prioritizes the key infrastructure needs to maintain or grow goods movement in the region by providing additional throughput with increased capacity, efficiency, and connectivity.
By volume, the region's roads and highways accommodate more than 90% of its freight movements. This underscores the importance of maintaining an efficient and uncongested highway network to carry the economic activity generated by the region's active manufacturing and maritime industries, along with one of the nation's largest and most vital international border crossings. As two of the primary routes connecting San Diego to the rest of the nation, both the I-5 and LOSSAN corridors are identified in the GMS as key links in the region's goods movement network.
Figure 2-14
- Capital Project Allocations in 2050 RTP
Funding
The 2050 RTP allocates over $112 billion to transportation in the next 40 years, measured in 2010 dollars.43 Of this sum, 50% is dedicated to transit-related uses, including capital, operations, and maintenance. Another 41% is allocated to roads and highways. The remainder is earmarked for active transportation projects (bicycle and pedestrian), Smart Growth incentives, and other initiatives. Subtracting operations, maintenance, and administrative costs, a total of $26.6 billion (55%) is allocated for transit capital projects, $16.0 billion (34%) for the construction of Express Lanes and other HOV facilities, and $5.4 billion (11%) for general-purpose highway projects.44 These proportions are depicted in Figure 2-14. Because Express Lanes support transit service and discourage single-occupancy travel, they represent a more efficient use of capital funds than general-purpose highway expansions; overall, 89% of the 2050 RTP's capital budget is allocated to transit or transit-supportive highway projects.
Despite the seemingly large size of these expenditures, the 2050 RTP represents an abridged list of the region's desired transportation projects. By law, the 2050 RTP must conform to a revenue-constrained scenario that makes reasonable assumptions about funding availability in the coming decades. In the planning process, however, SANDAG first devises a revenue-unconstrained scenario, which is essentially a "wish list" of projects the region would accomplish if given unlimited resources. This unconstrained list is then pared to fit available funding according to the ranked priorities of the projects.
To keep fares low enough to attract ridership, most of the world's transit systems require public subsidies to operate. The proportion of costs covered by fare revenue–known as the "farebox recovery ratio"–is currently 35% in the San Diego region, which is consistent with national trends. The remainder of transit funds comes from various public sources, ranging from federal grants to the local TransNet sales tax.
The amount of transit subsidy varies among the region's areas and types of transit service. In the densest areas of San Diego, bus and trolley routes enjoy high ridership and relatively low subsidies: In the fiscal year 2011, MTS buses required $1.53 in subsidy for each passenger boarding, while MTS trolleys' subsidy per passenger boarding was just $0.77.45 By contrast, local bus routes operated by NCTD–the main transit operator in the NCC–required a subsidy of $4.09 for each passenger boarding, reflecting the challenges of providing efficient transit service in large, low-density suburban areas. Subsidy per passenger on the COASTER was $6.92 in the fiscal year 2011, reflecting the higher cost of operating and maintaining commuter rail service compared to bus service in the corridor.
Transit services that require large public subsidies present a cost/benefit dilemma for regional decision-makers. While there is a social benefit to providing transit access to everyone in the region, fiscal constraints mean that investing in areas with inherently low ridership effectively excludes investment in more cost-effective services in other areas. SANDAG has crafted a careful balance in the 2050 RTP that allocates transit throughout the urban area, ensures a fiscally sustainable transit system, and achieves regional transportation goals and state GHG mandates.
NCC Projects in the 2050 RTP
Due to the importance of the NCC in the regional and national transportation systems, the 2050 RTP includes numerous projects in the corridor. Some of these projects are contained in the PWP/TREP, while others are not–mostly because while they serve the NCC, they are located principally in other parts of the region. Altogether, the 2050 RTP includes over $14 billion in capital projects that will serve the NCC (Table 2-5).
2.2.1.4 Smart Growth and Alternative Mode Opportunities
The SANDAG Board of Directors adopted the most recent Smart Growth Concept Map in January 2012. Shown in Figure 2-15, it identifies more than 200 existing and future transit-supportive and Smart Growth opportunity areas in the region and is used by the board to prioritize transportation investments and determine eligibility for funds from the Smart Growth Incentive Program. The NCC contains over 15 of these Smart Growth opportunity areas, the majority of which are located in community cores near COASTER and SPRINTER transit stations.
The majority of the region's Smart Growth is planned to occur in places that have existing transit-supportive land-use patterns–primarily the central core area. Since most of the NCC features a low-density, suburban land use pattern, it has not been SANDAG's primary focus for coordinated high-intensity Smart Growth and transit investments. Nevertheless, local jurisdictions and SANDAG are working together to introduce stronger Smart Growth development clusters into the NCC to accommodate future growth with higher-density, mixed-use development, particularly around LOSSAN rail corridor stations.
Table 2-5.1: SANDAG 2050 RTP Capital Projects (North Coast Corridor).
* These costs are planning-level estimates that appear in the 2050 RTP; actual project costs may differ.
** Includes bicycle/pedestrian projects such as the I-5 North Coast Bike Trail and community enhancements.
Mode/Facility
Project
Planning-Level Cost Estimate (2010 Dollars)*
LOSSAN Rail
Coastal Rail Double-Tracking
$440M
LOSSAN Rail
Parking and Station Improvements
$129M
LOSSAN Rail
Grade Separations
$350M
LOSSAN Rail
Del Mar Bluffs Stabilization
$26M
LOSSAN Rail
Del Mar Tunnel
$1,184M
Bus Rapid Transit
Mid-City to Palomar Airport Road via Kearny Mesa/I-805/I-5
$10M
Enhanced Bus
Coast Highway Rapid Bus or Other Enhancements
$127M
Highway (I-5)**
Manchester Avenue to SR-78 (2 HOV Lanes)
$480M
Highway (I-5)**
La Jolla Village Dr to I-5/I-805 Merge (2 HOV Lanes)
$250M
Highway (I-5)**
I-5/I-805 HOV Connectors
$110M
Highway (I-5)**
I-5/I-805 Merge to Palomar Airport Rd (2 Express Lanes)
$1,500M
Highway (I-5)**
SR-56 Interchange
$185M
Highway (I-5)**
Palomar Airport Rd to Harbor Dr (2 Express Lanes)
$1,170M
Highway (I-5)**
SR-78 Interchange and HOV Connectors
$346M
Total Estimated Cost of PWP/TREP Capital Projects in 2050 RTP
$6,307M
Table 2-5.2: SANDAG 2050 RTP Capital Projects (North Coast Corridor).
* Projects will serve, but will not be principally located in, NCC.
Mode/Facility
Project
Planning-Level Cost Estimate (2010 Dollars)*
SPRINTER Light Rail
SPRINTER Double-Tracking
$970M
SPRINTER Light Rail
SPRINTER Express
$284M
San Diego Trolley Light Rail
Mid-Coast Corridor Transit Project
$1,642M
San Diego Trolley Light Rail
UTC to Mira Mesa via Sorrento Mesa/Carrol Canyon
$1,140M
San Diego Trolley Light Rail
UTC to San Ysidro via Kearny Mesa, Mission Valley, Mid-City, Southeastern San Diego, National City/Chula Vista
$2,548M
Enhanced Bus
Oceanside to Vista via Mission Ave/Santa Fe Rd Corridor Rapid Bus
$49M
Enhanced Bus
Old Town to Sorrento Mesa via Pacific Beach, La Jolla, UTC Rapid Bus
$102M
Highway
SR-56: I-5 to I-15 Additional Lanes
$135M
Highway
SR-78: I-5 to I-15 Express Lanes
$570M
Total Estimated Cost of Other NCC Capital Projects in 2050 RTP
$7,440M
TransNet Smart Growth Incentive Program
Since 1988, TransNet–the half-cent sales tax for local transportation projects–has been instrumental in expanding the transportation system, reducing traffic congestion and bringing critical transit projects to life. In 2004, voters chose to extend the half-cent sales tax to 2048. The TransNet sales tax extension includes a $280 million Smart Growth Incentive Program (SGIP) to be allocated also through 2048. This program funds transportation and transportation-related infrastructure improvements and planning efforts that support and facilitate compact, mixed-use development focused around public transit, and that increase housing and transportation choices. As a result, approximately $9 million in Smart Growth incentives are available per biennial funding cycle, which can be leveraged with local matching funds or other state and federal funds to augment the total amount of funding available. The RCP specifies to compete for these funds, an area must be designated on SANDAG's Smart Growth Concept Map (Figure 2-15).
About 75% of the areas on the Smart Growth Concept Map qualify as existing/planned Smart Growth areas.46 The existing/planned areas are eligible to compete for both infrastructure and planning grants from the SGIP. Infrastructure grants could include streetscape or sidewalk enhancements, transit station improvements, traffic calming measures, or other quality of life amenities that support Smart Growth in that area. The remaining 25% of the areas on the map represent potential Smart Growth areas and are eligible to compete only for planning grants. These planning grants could be used to prepare specific plans, to update zoning ordinances, or to prepare other plans that provide the institutional framework for Smart Growth development in these areas.
Mid-Coast Corridor Transit Project
In 2011, the SANDAG Board of Directors approved an 11-mile extension of the San Diego Trolley light rail transit (LRT) system from just north of the Old Town Transit Center to UCSD and University City. Planned to open in 2018, the Mid-Coast Corridor Transit Project will improve public transit services between the many employment and activity centers in University City, UCSD, Old Town, and downtown San Diego, and will connect corridor residents with existing LRT lines that serve Mission Valley, South County communities stretching to the international border, and East County communities to Santee. Even though University City is the region's largest single employment center and one of its biggest trip generators, it is not served directly by regional transit. Instead, existing transit to these areas is mostly provided by local bus routes that travel on circuitous and congested streets, and are not competitive with individual auto travel.
Between Old Town and Gilman Drive, the Mid-Coast Corridor LRT system will travel in the existing railroad right-of-way owned by MTS on the east side of I-5. Three stations are proposed in this segment at Tecolote Road, Clairemont Drive, and Balboa Avenue. At Gilman Drive, the alignment will cross to the west side of I-5 to a station at Nobel Drive, then continue to the UCSD campus, cross I-5 again to serve major medical centers, and ultimately terminate at the University Towne Center (UTC) Transit Center and the adjacent shopping mall.
Completion of the Mid-Coast Corridor Transit Project will enhance direct public access between the NCC and regional residential, employment, and activity centers beyond the NCC, including the Mid-Coast Corridor as well as other areas linked by the LRT system. The planned rail transit connection provided by this project will improve travel options to the NCC and enhance NCC coastal access from throughout the region for residents, commuters, and visitors.
Figure 2-15
- San Diego Regional Comprehensive Plan Smart Growth Concept Map
2.2.1.5 Senate Bill 468 and Safe Access to Transit and Coastal Resources
California Senate Bill No. 468 (SB468), sponsored by local state Senator Christine Kehoe and signed into law in October 2011, detailed specific requirements for the NCC project. It directed the highway expansion to conform to the "8+4 Buffer Alternative" that is envisioned in the PWP/TREP, required highway and rail construction to proceed concurrently, and mandated the lowest possible environmental impacts in lagoon bridge construction. It also directed that "SANDAG shall establish a safe-routes to transit program that integrates the adopted regional bicycle plan with transit services" within the NCC. This initiative, which SANDAG is now undertaking at the regional level, began in the NCC with the Safe Access to Transit and Coastal Resources (SATCR) study (included as Appendix A of the PWP/TREP). The SATCR study evaluated gaps and barriers in the existing and planned bicycle and pedestrian networks in the NCC that prevent or inhibit access to NCC rail stations and coastal activities/resources, and identified projects for incorporation into the PWP/TREP that would help address these deficiencies. Utilizing the following process, the SATCR study provided a comprehensive and systematic approach to identifying new projects and facility enhancements that would improve non-motorized access to transit and coastal resources in the NCC:
Established transit and coastal resource destinations
Identified and mapped the LOSSAN rail corridor stations and significant coastal destinations and resources in the NCC. Coastal destinations and resources include major activity centers such as the Del Mar Racetrack and coastal city downtowns, and more broadly defined resources such as coastal lagoons and beaches.
Identified gaps, barriers and other deficiencies in bicycle and pedestrian access routes to transit and coastal resources
Identified the bicycle and pedestrian facilities at existing and planned crossings of the I-5 highway and LOSSAN rail corridors to determine where potential deficiencies exist at crossing locations.
Mapped the existing and planned regional and local bicycle networks in the NCC to identify deficiencies in bicycle access to LOSSAN rail stations and coastal resources.
Established a three-quarter-mile radius around each LOSSAN rail station and mapped the existing pedestrian network (sidewalks and trails) within that radius to identify deficiencies in pedestrian access to those stations.
Identified PWP/TREP improvements to address deficiencies
Identified PWP/TREP improvements that would correct the aforementioned gaps, barriers and other access deficiencies. These bicycle and pedestrian projects included new and improved facilities at I-5 highway and LOSSAN rail corridor crossings, implementation of segments of the Coastal Rail Trail, and implementation of the new north-south I-5 North Coast Bike Trail within the highway right-of-way. These PWP/TREP projects would be implemented as part of the I-5 highway and LOSSAN rail corridor transportation projects and would include such facilities as upgraded bicycle routes (e.g., rebuilding an existing Class III bicycle facility as a Class II facility on a new I-5 bridge overcrossing) and new or wider sidewalks at highway and rail over- and under-crossings.
Analyzed opportunities for additional improvements across or along the I-5 highway and LOSSAN rail rights-of-way. The analysis concluded that no further improvements are necessary within the highway right-of-way and that five potential opportunities for improvements within the LOSSAN right-of-way should be considered as part of future LOSSAN projects.
Provided baseline information for potential independent pedestrian projects
Outside the I-5 highway and LOSSAN rail rights-of-way, the SATCR study provided pedestrian circulation information within a three-quarter-mile walking distance of LOSSAN rail stations. Local jurisdictions could use this mapped information to identify any additional opportunities to improve pedestrian access to transit stations and coastal resources that could be permitted independently of the PWP/TREP.
The SATCR analysis revealed that nearly all identified deficiencies would be addressed by PWP/TREP improvements. At the LOSSAN rail corridor, these improvements include the construction of several grade-separated crossings as well as the completion of several segments of the Coastal Rail Trail. At the I-5 corridor, key improvements include rebuilding highway over- and under-crossings with improved bicycle and pedestrian facilities; constructing the I-5 North Coast Bike Trail (a new regional facility that would run the length of the NCC); and implementing an extensive suite of Community Enhancements in local jurisdictions. Taken together, these improvements would accomplish the goals of the SATCR study and will help jump-start the regional "safe routes to transit" program that SANDAG will undertake in response to SB468. A complete discussion of the SATCR analysis, results, and maps are included in the SATCR report in Appendix A. Further details about the planned bicycle and pedestrian improvements in the NCC are discussed below and shown in Figures 5.3-1A through 5.3-1E.
2.2.2 Reducing Regional Energy Consumption and Air Emissions
The planning efforts that underlie the 2050 RTP and its associated programs are based largely on efforts to reduce regional energy consumption and air emissions. These efforts are motivated not just by a desire to achieve long-term sustainability but also by legal mandates from California state regulatory bodies.
2.2.2.1 State-Mandated Greenhouse Gas Reduction Targets
The state of California has set ambitious goals for GHG reduction across its 18 metropolitan regions. In 2008, the California Air Resources Board set a 7% per-capita reduction in GHG emissions by 2020 and a 13% reduction by 2035 for the San Diego region.47 Since a significant portion of GHG emissions come from transportation sources, these targets heavily influenced the composition of transportation projects and the design of the transportation network in the RTP. In addition, the region's plan to meet these targets is contained in the SCS.
To achieve the mandated GHG reductions, the region cannot continue growing with the same transportation and land use patterns that dominated its past. SANDAG has determined that meeting the goals will require significant changes in travel behavior at the regional level, including both a reduction in vehicle miles traveled as well as an increase in the share of trips taken on public transit. As financial constraints limit the number of transportation projects possible, the RTP, therefore, attempts to direct transportation investment to the areas where the greatest changes are possible.
2.2.2.2 SANDAG Climate Action Strategy
Approved in March 2010, the Climate Action Strategy is SANDAG's guide to climate change policy. Recognizing that many climate change solutions and impacts occur at regional and local levels, the strategy identifies a range of potential policy measures–"tools in the toolbox"–for consideration as SANDAG periodically updates long-term planning documents like the RTP and RCP and as local jurisdictions update their general plans and other community plans.
A primary focus of the Climate Action Strategy is to help SANDAG identify land use, transportation, and related policy measures and investments that could help SANDAG and local governments achieve GHG reductions from the on-road transportation sector, including measures to reduce GHG emissions from passenger cars and light-duty trucks as required in future updates of the RTP. The focus of the Climate Action Strategy is organized around the following four goals–some coupled with a specific set of objectives intended to reduce transportation-related GHG emissions at regional and local levels and help the region prepare for potential impacts to the transportation system:
Reduce total miles of vehicle travel.
Minimize GHG emissions when vehicles are used.
Support increased use of low carbon alternative fuels.
Protect transportation infrastructure from climate change impacts.48
Potential policy measures are also identified for improving efficiency in buildings and energy use, protecting transportation and energy infrastructure from climate impacts, and helping SANDAG and local jurisdictions reduce GHGs from their operations. Decisions on which measures to pursue will be considered by regional and local officials, stakeholders, and the public during the development of subsequent public policy documents (and related regulatory mechanisms).
2.2.2.3 SANDAG Regional Energy Strategy
The Regional Energy Strategy (RES)–approved in December 2009–provides information, goals, and policy measures for a comprehensive set of energy issues. It addresses a host of issue areas, including energy efficiency and conservation, renewable energy, the smart grid, transportation fuels, and the economics of clean energy. Although there is overlap between the energy policy guidance provided in the RES and the types of policy measures that would reduce GHG emissions addressed in the Climate Action Strategy, energy and climate change are not synonymous issues. As a result, SANDAG prepared the Climate Action Strategy to accompany the RES to provide further policy guidance on climate change and energy issues, respectively.
In light of significant state control over energy policy in certain areas like electricity and natural gas, the RES focuses on the opportunities and authority that SANDAG and its member agencies have to address energy issues and achieve both local and regional goals related to energy and climate change. SANDAG anticipates addressing energy considerations through future updates of the RCP and RTP, while local governments can use mechanisms like their General Plans and can participate in the SANDAG Energy Roadmap program. The RES identifies six core strategies that, if implemented, would help the region significantly in meeting its energy and climate change mitigation goals. The strategies, of which SANDAG and local governments could play integral roles in implementing, include the following:
Pursuit of a comprehensive building retrofit program to improve efficiency and install renewable energy systems.
Creation of financing programs to pay for projects and improvements that save energy.
Utilization of SANDAG-San Diego Gas & Electric Local Government Partnership funding to help local governments identify opportunities and implement energy savings at government facilities and throughout their communities.
Support of land use and transportation planning strategies that reduce energy use and GHG emissions.
Support of planning of electric charging and alternative fueling infrastructure.
Support use of existing unused reclaimed water to decrease the amount of energy needed to meet the water needs of the San Diego region.49
2.2.2.4 Caltrans Climate Action Program
The Climate Action Program developed by the Caltrans is an interdisciplinary effort intended to promote, facilitate, and coordinate implementation of climate change strategies and related activities within Caltrans and with partner agencies. The Climate Action Program serves as a resource for technical assistance, training, information exchange, and partnership-building opportunities.
The program focuses on both reducing GHG emissions and adapting to climate change. The overall objective is to balance progressive program delivery within the context of responsible environmental stewardship in a way that:
allows transportation strategies, plans, and projects as a whole to contribute to the state's GHG emission reduction plan;
provides guidelines, procedures, performance measures, and a quantifiable set of reporting protocols to monitor GHG footprints;
considers potential impacts of climate variability on the transportation system and development of risk assessment for long-lasting transportation investments; and
advances applied research to support climate change knowledge base in transportation.
2.2.2.5 Transportation Demand Management
To encourage the use of alternative modes–including carpooling, vanpooling, using transit, biking, and walking–SANDAG coordinates a variety of activities through the iCommute program. The goal of the program is to reduce congestion and air pollution while improving the commutes of residents. Program activities include carpool partner-matching, the Regional Vanpool Program, the iCommute Subsidy Program, the iCommute Guaranteed Ride Home Program, the Regional Bike Locker Program, the SchoolPool Program, employer outreach services, and marketing of transportation demand management (TDM). iCommute is a cost-effective method for easing traffic congestion and reducing air pollution through managing the demand for area roadways by offering a "gateway" of information, resources, and tools describing regional TDM and commute options online or through SANDAG's 511 regional transportation information program.
In addition to the regionwide emphasis of the iCommute program, the 2050 RTP also requires the development of corridor-specific TDM plans to address the varied needs and demands of the region's distinct corridors and communities. Together, SANDAG and Caltrans have prepared a comprehensive TDM plan for the NCC. The September 2013 NCC Transportation Demand Management Implementation Plan was developed to support the NCC infrastructure and environmental program by reducing single-occupancy vehicle (SOV) trips and encouraging the use of more sustainable modes of travel to alleviate congestion both during construction of NCC rail, transit, highway and roadway projects and over the long term to reduce capacity issues on I-5. As such, the plan seeks to provide a foundation for continued travel behavior changes in the corridor once NCC project construction is complete.
The first phase in the development of this plan was extensive market research and analysis of existing conditions–including all trip markets–through surveys and interviews of employers, commuters, schools, cities, and major institutions to identify the best opportunities for TDM programs and services in the corridor. Based on the market research, customized TDM measures and strategies were developed for the NCC and were tailored to reflect the propensity of NCC residents, commuters, and others to shift their modes of travel from SOV to non-SOV alternatives such as transit, walking, cycling, carpooling/vanpooling and teleworking. Implementation strategies include programs and services geared toward employers, agencies, schools and commuters, financial incentives to encourage alternative travel behavior, public outreach to corridor residents and institutions, and performance monitoring to measure the program's effectiveness.50
2.2.3 Preserving and Enhancing Natural Resources
Within the NCC, multiple regional efforts are underway to restore, preserve in perpetuity, and enhance the unique natural resources and habitats that comprise the local coastal environment.
2.2.3.1 Environmental Mitigation Program
The TransNet Extension Ordinance and Expenditure Plan, approved countywide by voters in November 2004, includes an Environmental Mitigation Program (EMP) funding allocation to mitigate habitat impacts of regional transportation projects. The EMP provides for proactive, large-scale acquisition and management of habitat lands for future mitigation before individual transportation projects cause habitat impacts. This plan creates a reliable approach for funding the required mitigation for future transportation improvements, while at the same time reducing overall costs and accelerating resource enhancement activities and project delivery. TransNet will provide the EMP with funding for the next 40 years to mitigate impacts from regional and local transportation projects (Biological Mitigation Fund), and for regional habitat acquisition, management, and monitoring activities (Regional Habitat Conservation Fund). This funding allocation is tied to mitigation requirements and the environmental clearance approval process for transportation projects outlined in the RTP.
In March of 2008, SANDAG entered into a Memorandum of Agreement (MOA) with the U.S. Fish and Wildlife Service, the CDFG, and Caltrans to formalize a process for implementing early land mitigation for transportation improvements. The MOA is a 10-year processing agreement that will allow SANDAG, Caltrans, and the wildlife agencies to evaluate how the EMP implements the provisions of the TransNet ordinance for early land mitigation.
The MOA has budgeted for implementation of mitigation over the next 10 years to assist in regional land management and monitoring. The TransNet EMP funding (in 2012 dollars) that is specifically programmed for the NCC corridor, allowing for the expenditure of the EMP funds with the implementation of the NCC transportation projects, includes the following:
$150.1 million for coastal wetland mitigation.
$4.8 million for freshwater wetland mitigation.
$26.1 million for upland mitigation.51
After the first 10 years of the program, a comprehensive analysis will be conducted to quantify the direct cost savings associated with early mitigation. This direct cost savings will be used in the future to continue to assist with the implementation of regional habitat preservation efforts.
2.2.3.2 San Elijo Lagoon Restoration Project
The San Elijo Lagoon Restoration Project seeks to preserve, protect and enhance the San Elijo Lagoon Ecological Reserve and its watershed. To achieve this, a feasibility study was prepared to evaluate alternative actions to restore the habitat functions and values of the lagoon. San Elijo Lagoon is a vital coastal resource in the region as it provides a mechanism for conveyance and dissipation of floodwater, thereby reducing erosion by slowing runoff velocities, deposition of flood suspended sediments, shoreline stabilization, recharge of groundwater, and storage of surface water. San Elijo Lagoon also serves to filter suspended sediments, remove organic and inorganic nutrients, remove toxic substances, facilitate nutrient cycling, denitrification, and mineralization.
The City of Encinitas, U.S. Army Corps of Engineers, USFWS, CDFG, County of San Diego, and San Elijo Lagoon Conservancy are working to complete a Draft EIR/EIS for the restoration of the lagoon. The Draft EIR/EIS will assess several alternatives that seek to restore the hydrological regime and the marsh habitat that is being converted from mudflats and low marsh to middle and high marsh. SANDAG/Caltrans have participated with the City of Encinitas and the U.S. Army Corps of Engineers as part of the feasibility analyses, as well as with other resource agencies as part of the National Environmental Policy Act (NEPA) 404 process for the I-5 project to determine the optimal bridge openings at all of the infrastructure crossings to help facilitate restoration plans for the lagoon. This large regional restoration project could ultimately facilitate the restoration of many hectares of wetlands and help to ensure the lagoon's continued functioning, greatly enhancing the coastal lagoon habitat.
2.2.3.3 Buena Vista Lagoon Restoration Project
The Buena Vista Lagoon Restoration Project lies within the cities of Carlsbad and Oceanside. The lagoon is California's first Ecological Reserve and is owned and managed by the CDFG. Historically a tidally influenced system, Buena Vista Lagoon has been affected by increased sedimentation from the surrounding watershed and, in the 1940s, construction of a concrete weir across the ocean entrance that controls the water level. The presence of the weir at the mouth of the lagoon, combined with increasing sediment and nutrient loading has reduced the depth and circulation of the lagoon, accelerated the growth of cattail, bulrush, and algae, and led to a decline of biodiversity and increased vector (e.g., mosquito) problems. Restoration is a high priority because, given current rates of sedimentation, it is predicted that the lagoon will fill in and become a wet meadow in less than 50 years. Restoration of Buena Vista Lagoon is a high priority (Tier One) project on the work program of the Southern California Wetlands Recovery Project.
Numerous agencies and organizations have been working toward restoring the lagoon, including, but not limited to, the California Coastal Conservancy, USFWS, RWQCB, NOAA, the Cities of Carlsbad and Oceanside, the Buena Vista Lagoon Foundation, and other permitting agencies. The first phase of restoration planning–consisting of several studies assessing the feasibility of restoring function and habitat values by modifying the lagoon's hydrology–was completed in 2010.
"Phase II" restoration planning is underway and consists of preparing preliminary engineering and environmental documents that require further development and evaluation of restoration alternatives for the lagoon. In 2012, SANDAG agreed to assume the role of lead agency in the project in order to advance the progress of the project EIR/EIS and facilitate future engineering, permitting, and construction phases. SANDAG/Caltrans have participated with the resource agencies as part of the NEPA 404 process for the I-5 project to determine the optimal bridge opening at I-5 to help facilitate (and not preclude) any future restoration plans for the lagoon.
2.2.3.4 Coastal Regional Sediment Management Plan
SANDAG received a grant from the California Department of Boating and Waterways for the development of a Coastal Regional Sediment Management Plan to facilitate the management of shoreline sand on a regional basis. The region is one of three areas in the state chosen to prepare a plan. This plan is part of a statewide program to develop a Sediment Master Plan led by the Coastal Sediment Management Workgroup, a group of state, federal, and local/regional entities.
The plan describes how the management of sediment targeted at coastal erosion can be implemented in an expeditious, cost-effective, and resource-protective manner throughout the region. The goal is to identify sediment sources that can be used to restore and maintain coastal beaches and other critical areas of sediment deficit or excess, reduce the proliferation of protective shoreline structures, sustain recreation and tourism, enhance public safety, and restore coastal sandy habitats through a consensus-driven process.
While total loads of sediment reaching the ocean have been decreasing, a disproportionate amount ends up trapped in coastal wetlands due to factors related to urbanization such as unstable inlets, decreased tidal prisms, and ecosystem fragmentation. Routine maintenance dredging is required at most lagoons and harbors in the region, and sediment placement at beaches provides beneficial reuse of suitable maintenance dredged materials. Healthy beaches are important for maintaining the integrity of the wetland systems existing behind them. Habitat quality may affect managed or sensitive species uses of beaches, including California grunion, Pismo clams, and shorebirds including threatened western snowy plover.
Notes:
SANDAG/Caltrans Series 12 Model, November 2011.
The San Diego region, as defined by SANDAG and used throughout this document, consists entirely of San Diego County.
SANDAG/Caltrans Series 12 Model, November 2011; California Department of Finance; United Nations Department of Economic and Social Affairs; Mexico Consejo Nacional de Población (CONAPO).
I-5 NCC Project Final EIR/EIS (Section 3.1), October 2013.
SANDAG Profile Warehouse, March 2012.
Total Campus Enrollment, UC San Diego Student Affairs, Fall 2011. http://studentresearch.ucsd.edu/sriweb/enroll/total.pdf. Accessed May 2, 2012.
I-5 NCC Project Final EIR/EIS (Section 3.1), October 2013.
SANDAG/Caltrans Series 12 Model, November 2011.
I-5 NCC Project Final EIR/EIS (Section 3.1), October 2013.
SANDAG/Caltrans Series 12 Model, November 2011.
I-5 NCC Project Final EIR/EIS (Section 3.1), October 2013.
SANDAG/Caltrans Series 12 Model, November 2011.
I-5 NCC Project Final EIR/EIS (Section 3.1), October 2013.
SANDAG/Caltrans Series 12 Model, November 2011.
SANDAG, July 2012.
I-5 NCC Project Final EIR/EIS (Section 3.1), October 2013.
SANDAG/Caltrans Series 12 Model, November 2011.
SANDAG, May 2012.
SANDAG, January 2013.
Ibid.
Ibid.
SANDAG Coordinated Plan 2012-2016 (Appendix C), July 2012.
Ibid.
The "last mile" (or "first mile") refers to the access gap between transit services and a trip's origin or destination. This is often cited as a reason more people do not ride transit: It can get riders close, but not close enough, for many trips.
iCommute Vanpool Program Hits Record-High Participation, SANDAG region Newsletter, October 2011. http://www.sandag.org/enewsletter/archives/october2011/feature_2.html. Accessed April 27, 2012.
District 11 Annual Summary of HOV and HOT Lane Operations 2010, Caltrans, August 2012.
U.S. Department of Transportation Press Release, September 10, 2007. http://www.fhwa.dot.gov/pressroom/dot0795.htm. Accessed April 27, 2012.
SANDAG/Caltrans Series 12 Model, November 2011.
As detailed in Chapter 3B, Managed Lanes (now called Express Lanes) are HOV lanes that, in addition to providing uncongested travel for carpools, vanpools and transit vehicles, allow for excess capacity to be allocated to SOVs through variable pricing. The pricing for SOVs adjusts in real time in response to traffic conditions to maintain free-flow speeds for HOVs at all times. Express Lanes are highly efficient for managing highway operations since they prioritize HOV travel while allowing unused lane space (which would otherwise be wasted) to be occupied.
California State Park System Statistical Report, 2009/10 Fiscal Year, California Department of Parks and Recreation, 2010.
Completing the California Coastal Trail, California State Coastal Conservancy, January 2003.
I-5 NCC Project Final EIR/EIS (Section 3.1), October 2013.
Ibid.
Ibid.
Ibid.
SANDAG 2050 Regional Growth Forecast, February 2010.
SANDAG 2050 RTP (Chapter 2), October 2011.
SANDAG 2050 RTP (Chapter 3), October 2011.
Ibid., Technical Appendix 7.
SANDAG 2050 RTP (Technical Appendix 7), October 2011.
U.S. Census American Community Survey, 2009.
SANDAG 2050 RTP (Chapter 6), October 2011.
Ibid., Technical Appendix 7.
SANDAG, October 2011.
SANDAG Coordinated Plan 2012-2016 (Appendix C), July 2012.
Smart Growth Areas by Place Type, SANDAG, January 27, 2012. http://www.sandag.org/uploads/projectid/projectid_296_14006.pdf. Accessed May 2012.
The CARB-mandated GHG reduction targets apply only to cars and light trucks during weekday travel, using 2005 as the base year. While reductions are desired for all vehicle classes, only this single class is included in the performance measure.
SANDAG Climate Action Strategy (Chapter 6), March 2010.
SANDAG Regional Energy Strategy, December 2009.
North Coast Corridor Transportation Demand Management Implementation Plan Report, September 2013, SANDAG/Caltrans
SANDAG, January 2013. Figures include approximately $9 million (adjusted to 2012 dollars) already expended.