
Appendix I – North Coast Corridor Economic Impact Analysis
Executive Summary
This report examines the economic benefits that are expected to accrue to the San Diego regional economy as a result of the North Coast Corridor (NCC) project, focusing on economic impacts from improved freight mobility, improved conditions within the tourism market, and broader regionwide economic benefits typical of large-scale transportation corridor enhancements. The findings from this analysis are that economic benefits from this project would be significant, both in terms of quantifiable metrics related to freight-dependent industries and the tourism sector, and in terms of broader, regional economic benefits as a result of improved mobility.
Economic benefits from the NCC project include:
- Economic impacts of improved freight mobility. Regional economic benefits from freight mobility improvements in the NCC stem in large measure from transportation cost savings to firms that ship goods via truck, resulting from travel time improvements on I-5. Additional benefits will also be derived from capacity improvements to the Los Angeles-San Diego-San Luis Obispo (LOSSAN) freight rail corridor, which will permit increased rail freight throughput and help preserve rail market share. Utilizing truck travel data in the NCC derived from the SANDAG travel demand model, combined with expected reductions in trip times for trucks in the corridor (comparing the 2040 Build conditions with 2040 No-Build conditions), it was determined that total in-region truck transport cost savings resulting from implementing the NCC project will equal $118 million (2012 dollars) annually in 2040; inventory savings will add another $18 million to the annual benefit, for a total of $136 million in direct shipper cost savings annually. These direct cost savings will result in total economic impacts in 2040 (including multiplier effects derived from a customized input-output model) of close to 2,000 permanent jobs, corresponding household wages of $111 million, and Gross Regional Product (GRP) of $194 million in today's dollars. Total annual economic activity, as measured by output, would equal about $281 million in 2040.
- Economic impacts of increased tourist visitation and expenditures. Improved accessibility and reduced travel times along the NCC will have a direct positive impact on the tourism economy. The tourism impact analysis assumes that the primary quantifiable tourism-related impacts derived from the project include: an increase in total visitation to attractions within the project area, from both tourists and residents; an increase in lodging-based revenues and expenditures within the project area, as a result of increasing occupancy rates and average daily rates; and an increase in day trip visitation (from those living outside the region) due to improved pass-through travel times along the I5 corridor. Collectively, the total direct economic benefit of these impacts would be $110.8 million annually in additional spending, of which $61.2 million would be derived from increased attraction visitation, $9.9 million would be derived from the improved hotel market, and $39.7 million would be derived from increased day trip visitation to the region. These direct tourism expenditures will result in total economic impacts in 2040 (including multiplier effects derived from a customized input-output model) of about 1,650 permanent jobs, corresponding household wages of $70 million and GRP of $114 million in today's dollars. Total annual economic activity, as measured by output, would equal about $181 million in 2040.
- Regionwide economic Impacts from improved mobility. Large-scale transportation investments that reduce congestion and improve regionwide accessibility, such as the NCC project, can have wider regional economic impacts that go beyond the direct benefits to a specific industry or group of users, or specific local areas. Individual case studies and supplementary literature provide empirical evidence of this relationship. Based on empirical study and the accessibility improvements anticipated from the NCC project, an increase in regional employment and GDP (over and above baseline trend) of between 0.5% and 1.0% might be achievable, which would constitute a range of 8,000 to 16,000 jobs.
- Cumulative economic benefits. In addition to the annual benefits, a broader perspective can be gained by estimating cumulative economic impacts over a 30-year project investment period extending into the 2040 decade. Cumulative impacts provide a more comparable yardstick relative to total project investment costs, which occur in phases over the 30 years. The cumulative differences in economic outcomes compared with the No-Build Scenario are very substantial: Total Output, the most comprehensive indicator, is expected to increase in the range of $4.8 billion to $9.7 billion above No-Build levels. Total GRP is expected to expand a range of $3.2 billion to $6.4 billion above the No-Build, with correspondingly large increases in Total Wage Earnings, a major subset of GRP.
1.0 Study Overview
This report presents the results of an analysis of the potential beneficial economic impacts of the NCC project. Following detailed scoping discussions with SANDAG and Caltrans, it was determined that the economic impact analysis would not include a formal benefit/cost analysis nor formal economic modeling. SANDAG and Caltrans will conduct a comprehensive benefit/cost analysis that will provide the ability to compare discounted project costs over an extended period with discounted benefits over the same period. As with the economic analysis conducted in this report, benefit/cost analyses have limitations, particularly in their ability to focus on wider, long-term economic impacts on a region resulting from improved accessibility. Benefit/cost analysis as currently practiced is conservative and, as defined by the US Department of Transportation through its TIGER guidance, does not generally incorporate wider economic impacts. Formal economic modeling (e.g., general equilibrium modeling utilizing complex economic models or econometric/statistical tools) was also not undertaken, as this would require extremely data-intensive analyses and would not necessarily provide results that can be readily communicated or understood.
Instead, more intuitive "ground up" approaches were selected. Following the scoping discussions mentioned above, three distinct analyses were identified for inclusion in this study. These included:
- Economic impacts of improved freight mobility. About 90% of the surface freight moving in and through the NCC corridor is by truck. The remainder is by freight rail through the LOSSAN rail corridor. (The study does not consider air cargo.) The primary methodology for analyzing freight impacts is to estimate in-region shipper cost savings and to project forward the overall economic impacts from these savings as shippers variously increase economic output, retain profits, pass some savings on to consumers, hire more workers, and as workers and shippers spend more in the region. Extensive truck data were obtained from the SANDAG regional travel demand model, and truck time savings through the corridor were then estimated based on improved travel times made possible by the NCC improvements. These savings were then monetized, and research-based assumptions applied to estimate how such cost savings would translate into increased output, employment, and earnings in the region.
- Economic impacts from improved access to tourist destinations. Improving mobility in the NCC corridor would reduce congestion leading to major tourist destinations and coastal beaches and communities within the corridor, as well as regionally. This analysis utilized available detailed information on tourism visits in the region and corridor, and utilizing research derived impact factors, estimates potential increases in tourism visitation rates. Based on this, economic impacts are estimated reflecting rates of visitor spending for different types of tourists (e.g., local, day-trippers, out of town overnight visitors, etc.) and the overall addition to economic activity arising from this.
- An overall assessment of the range of potential regionwide economic impacts of improved mobility. This assessment is comprised of a benchmarking review of case studies of other regions that have made similar large scale corridor transportation investments, supplemented by other recent research regarding the relationship between accessibility, congestion, and regional economic outcomes. The applicability of these studies to the San Diego region is considered, and a range of overall regionwide impacts on employment provided. The results of this assessment are best viewed as illustrative of the range of potential impacts of the NCC project, based on comparisons of mobility effects in the other areas to that resulting from the NCC project, and on the relative size of the San Diego economy. The results provide an extremely high-level analysis.
2.0 NCC Transportation Impacts Summary
2.1 The North Coast Corridor in the Regional Economy
Larger in area than both Rhode Island and Delaware combined, and home to more people than 20 of the 50 states, San Diego County–also known as the San Diego region–contributes significantly to the economic, political, social, recreational and environmental well-being of California and the US. The region's location in the southwest corner of the US makes it the front door to the state and nation from the land ports of entry at the Mexican border as well as the seaport in San Diego Bay. People and goods depend on the county's rail and highway transportation network to access local, regional, state and interstate destinations.
The 27-mile NCC plays a key role in the San Diego region's economic and transportation vitality. Housing 16% of the region's population (525,000 people) and 20% of its employment (278,000 jobs), the NCC is a thriving sub-region that contributes significantly to the San Diego economy. It is home to the majority of the region's beaches and other coastal resources, attracting an estimated 15 million annual visitors to its beaches and millions more to destinations like the Del Mar Racetrack, Legoland and the annual San Diego County Fair.
In addition, the NCC is home to two of the region's most vital transportation resources: the I-5 highway and the LOSSAN rail corridor. These facilities are key links in the regional, state and national transportation networks: I-5 acts as the primary access route for people and goods to reach the Los Angeles region, and LOSSAN is the nation's second-busiest intercity passenger rail corridor. Congestion, delays, and disruptions in either of these transportation corridors result in economic losses that can affect the regional, state and even national economies. These factors combine to make the NCC vital to the economy, infrastructure and quality of life in San Diego and beyond.
2.2 Access Benefits of NCC Transportation Improvements
The proposed transportation improvements in the NCC represent long-overdue capacity enhancements that attempt to keep pace with the precipitous growth that the corridor and region have experienced in the past and will continue to experience in the future. The improvements not only will increase the efficiency of the transportation system and provide relief for current congestion, but also will prevent the further degradation of traffic conditions that are projected to occur in the absence of improvements.
2.2.1 Keeping Up with Growth
Between 1970 and 2010, while the San Diego region more than doubled in population, the population of the NCC grew by approximately 400%, from 105,000 to over 525,000 residents.1 Travel demand has swelled accordingly, as all of those new residents need to reach jobs, schools, and recreational activities on a daily basis. An additional 123,000 people are anticipated to move to the NCC by the year 2040, which will further compound travel demand.
Despite this explosion of growth in the last several decades, the capacity of the NCC transportation system has remained largely unchanged. I-5 was originally built in the NCC as an eight-lane freeway in the late 1960s and 1970s and has not had any major capacity improvements to keep pace with the significant corridor growth over the last 40 years. Similarly, the LOSSAN rail corridor was originally built as a single-track railway, a condition that creates chokepoints for trains traveling in opposite directions, requiring one train to stop to allow the other to pass. Forty-six percent of the LOSSAN corridor in the San Diego region remains single-tracked, which severely constrains the region's ability to add more service. The resulting heavy congestion in both the highway and rail systems negatively affects commuters, tourists and businesses throughout the corridor and region.
In the absence of any transportation improvements, the continuing growth of the NCC will further exacerbate the severe congestion that already exists on both the highway and rail corridors. For example, in off-peak periods when I-5 is uncongested, it takes approximately 23-25 minutes to traverse the 27-mile NCC in either direction (between La Jolla Village Drive in San Diego and Harbor Drive in Oceanside). In 2010, this trip in the northbound direction averaged 34 minutes during the afternoon peak period and is projected to take a congestion-ridden 70 minutes by 2030 without any improvements to the highway (Table 2-1). Similarly, the LOSSAN rail corridor will be unable to accommodate more trains–and will continue to experience delays in its current train services–until it is double-tracked. Given the persistence of growth and the levels of congestion that already exist, failing to improve the capacity of the NCC's highway and rail facilities will have serious consequences on the local economy as well as the quality of life of all residents.
2.2.2 Primary Access Improvements
The planned transportation improvements in the NCC will ensure that reliable access to, and through, the corridor is maintained and enhanced for residents, visitors and businesses, including the movement of vital freight. The corridor's multimodal transportation vision is aimed not just at increasing regional mobility, but doing so in ways that respect both the environmental and fiscal implications of transportation projects. Each element of the strategy–I-5 Express Lanes, LOSSAN double-tracking and station improvements, 27 miles of bicycle and pedestrian improvements, and significant environmental enhancements–will contribute to the maintenance of an effective and balanced transportation system that promotes multimodal access to the corridor's unique natural resources, coastal communities and activity centers.
As demand for the NCC's many attractions continues to rise, the planned corridor improvements will reduce access impediments for all users and increase the efficient movement of people and goods. The NCC program recognizes that constructing new transportation corridors or new general-purpose lanes to meet travel demand would not solve the highway-capacity deficiency without affecting adjacent communities, lagoons and habitat areas. Therefore, to address capacity deficiencies in ways that will provide the most benefit to coastal access and natural resources while meeting regional travel demand, facility improvements are planned to move people and goods more efficiently, and with minimal facility expansion (footprint) when compared to other transportation alternatives.
The Coastal Commission Public Access Action Plan recognizes roadway congestion as one of the greatest impediments to public access in coastal areas and specifically notes that, among other things, traffic congestion and poor traffic circulation are significant problems in which residents, visitors, and businesses compete to use the same transportation system. It is for this reason that the San Diego region's continuing efforts to reduce traffic congestion and maintain acceptable transportation services on I-5 and local transportation arterials are critical elements to protecting public access to recreational opportunities along the NCC coastline and maintaining regional mobility.
Effects on Highway Traffic
As travel demand in the I-5 highway corridor continues to increase, so does the existing impediment of traffic congestion. The proposed Express Lanes will accommodate future demand on I-5 by getting the most capacity out of the least amount of highway footprint expansion, giving priority to public transit and other high-occupancy vehicles (HOVs) while reducing overall congestion and improving public access to NCC destinations. As shown in Table 2-1, the highway improvements will reduce travel times substantially even in the general-purpose lanes when compared to the No-Build scenario, resulting in faster, more reliable travel for all vehicles in the corridor. By prioritizing and ensuring reliable travel for buses and other transit vehicles, the Express Lanes also will enable new opportunities for public transportation in the corridor. In addition, the new lanes will ensure that the corridor's large base of HOV travelers–who comprise as much as 60% of I-5 weekend traffic2 and are often seeking access to coastal communities and recreational resources–would be provided with uncongested, reliable travel times.
Table 2-1: Mean Weekday Peak Travel Times (Minutes), I-5 From La Jolla Village Drive to Harbor Drive
Sources: Caltrans Performance Measurement System (PeMS); SANDAG/Caltrans Series 11 Micro-Simulation Model, August 2010.
| Time/ Direction | 2010 Peak | 2030 Peak No-Build | 2030 Peak General- Purpose Lanes | % Change, 2030 No-Build to 2030 Build | 2030 Peak Express Lanes |
|---|---|---|---|---|---|
| Northbound AM Peak Period | 23 | 37 | 26 | -30% | 24 |
| Southbound AM Peak Period | 36 | 54 | 36 | -33% | 24-26 |
| Northbound PM Peak Period | 34 | 70 | 45 | -36% | 28 |
| Southbound PM Peak Period | 34 | 40 | 30 | -25% | 24-25 |
Analysis of the proposed improvements found the following benefits to travel on I-5 when compared to the 2030 No-Build alternative:
- A 25–35% reduction in peak-period travel times in the general-purpose lanes (Table 2-1).
- A 47% reduction in vehicle hours of delay (defined as 35 miles per hour or less).3
- A decrease in the duration of daily peak-period congestion, from 12–13 hours per day to 5–6 hours per day.4
- A 4% reduction in vehicle hours traveled.5
Effects on Local Traffic
The transportation improvements are also projected to help relieve traffic congestion on the NCC's local streets and roads. While highway capacity improvements in other corridors sometimes can induce more travel on local roads, the majority of the NCC is projected to experience the opposite effect: demands for local roads would diminish in many places as a result of the project. As noted in PWP/TREP Chapter 3A, the corridor's topographic constraints and circuitous street network make I-5 the most direct north-south route for many trips, but frequent congestion on the highway leads many travelers to attempt their trips on local roads instead. With additional capacity available on I-5, this "spillover traffic" in local communities would be reduced. A series of studies on local traffic projected the following differences between the No-Build and Build scenarios in 2030:
- Coast Highway and El Camino Real, the two primary north-south alternatives to I-5, were projected to experience reductions in vehicle miles traveled of 17% and 10%, respectively, between the 2030 NoBuild and 2030 Build scenarios.6
- Coast Highway and El Camino Real were projected to experience overall reductions in Average Daily Traffic (ADT) of 12% and 3%, respectively, between the 2035 No-Build and 2035 Build scenarios.7
- In an analysis of 131 roadway segments–including key arterials and intersections selected jointly by Caltrans and corridor cities–the proposed highway improvements were shown to have negligible impacts on local traffic, with 68 of the 131 segments (52%) experiencing either decreases or no change in 2030 ADT between the No-Build and Build scenarios. An additional 51 segments (39%) were projected to experience ADT increases of less than 10%. Only 12 (9%) of the local NCC roadways would experience increases in ADT of over 10%.8
- Even with increases in ADT on some roadways, only 3 segments (2%) that were under capacity in the 2030 No-Build scenario were projected to exceed capacity in the 2030 Build scenario. Eighty-five segments that were under capacity in the 2030 No-Build scenario remained under capacity in the 2030 Build scenario and five segments that were overcapacity in the 2030 No-Build scenario are projected to be under capacity in the 2030 Build scenario.9
- A study of traffic level of service at 75 key intersections near freeway access points showed either improvement or no change at 73 intersections (97%) in the morning peak period and 68 intersections (91%) in the evening peak period when comparing the 2030 No-Build and 2030 Build scenarios.10
Taken together, these data indicate that the capacity improvements on I-5–by providing a better option for north-south travel than local roads–actually will help to relieve traffic congestion in the NCC's communities.
2.2.3 Additional Benefits to Corridor Access
While I-5 is the primary transportation facility in the NCC, the benefits of the NCC program extend beyond the highway and local roads. The NCC program is a broad package of improvements that also include benefits to the corridor's rail, transit, active transportation, and recreational facilities. The PWP/TREP envisions a multimodal transportation system that provides numerous mobility options for residents, visitors and businesses to reach the corridor as well as travel through it.
As the populations of both the region and the corridor continue to grow–respective increases of 29% and 23% are projected by 204011 –travel demand to, from and within the NCC is expected to rise accordingly. The planned transportation improvements will provide much-needed capacity increases, but the reality of continuing growth has prompted Caltrans and SANDAG to plan for additional measures to help preserve and enhance access to corridor resources.
Parking
The presence of adequate parking facilities in coastal areas to serve residents, commercial uses and visitors who travel by car is an important variable that influences public access and recreation
2.0 – NCC Transportation Impacts Summary
opportunities in the Coastal Zone. Transit services must be supported by ample parking, walking, and bicycle facilities in order to ensure maximum accessibility of the NCC's coastal resources via alternative modes of travel. In addition, as the majority of rail stations in the NCC are located just blocks from the beach, constrained parking resources could result in overflow parking by train passengers onto adjacent streets, which could displace parking resources used by people to access the coast by automobile. However, where adequate parking supply does occur, these parking resources support access to nearby beaches and recreation areas.
Planned PWP/TREP improvements include expanding parking areas at the corridor's transit stations, which would not only support passenger rail service but also reduce the possibility of conflicts between rail passenger and coastal access parking resources on adjacent streets. Furthermore, the PWP/TREP calls for the construction of new and enhanced staging areas for bike and trail facilities throughout the corridor, including trailheads and park-and-ride lots. These improvements would increase access to and use of the NCC's recreational facilities.
Local Transit
In conjunction with the PWP/TREP improvements, the SANDAG 2050 Regional Transportation Plan (2050 RTP) also includes enhancements to existing local bus transit in the corridor, including increases in operating funding for future, more frequent service to rail stations and coastal destinations. While the PWP/TREP does not directly include local bus service, the 2050 RTP includes an increased commitment of operating funds for local buses both within the NCC and across the region. While many transit dollars are earmarked for the region's higher-density communities, North County Transit District (NCTD) would receive a share of the region's operating funds to sustain and enhance its bus transit services in the NCC. Access to LOSSAN rail services remains a priority for both SANDAG and NCTD, and travelers can expect various enhancements to the 17 local bus routes that serve the NCC's 6 rail stations. Future enhancements could include higher frequencies, extended operating hours, and other improvements. The 2050 RTP also includes specific funding to increase service frequencies to 15 minutes or better in key bus corridors, but at this stage, it has not been determined how NCC routes may benefit from this augmentation.
The 2050 RTP also includes improvements to existing local bus service along Coast Highway. The Coast Highway bus transit improvements would be integrated and coordinated with multimodal improvements planned for Coast Highway by the cities along the corridor, creating vibrant coastal communities that are accessible by transit, bicycle, foot, and auto. The envisioned transit enhancements along Coast Highway include increased service frequencies and a menu of potential roadway features to facilitate transit operations such as fewer stops, dedicated transit lanes, traffic signal priority, and intersection queue jumps (short dedicated lanes approaching intersections that would allow buses to advance to the intersection ahead of other vehicles stopped at traffic signals). The multimodal components of Coast Highway improvements would facilitate access to transit through the implementation of sidewalk improvements, bicycle lanes, and traffic calming techniques, and would promote the attractiveness of transit through landscaping, urban design, and amenities at bus stops such as embellished shelters and real-time next vehicle arrival signs. Coast Highway bus transit improvements could include overlay rapid service with fewer stops than the parallel local service to decrease the total trip time for longer distance passenger trips. Ongoing coordination among SANDAG, NCTD and the coastal cities will define the optimum transit service and infrastructure enhancements within the Coast Highway multimodal corridor context.
3.0 Economic Benefits Of Enhanced Freight Mobility
3.1 Overview
The efficient movement of freight in all major U.S. metropolitan areas is essential to a competitive and growing regional economy; it follows that significant decline in freight mobility, including congestion-related delay and lack of capacity, over time will pose a threat to the San Diego economy. In addition to serving the region's manufacturers, retailers, distribution services, and indeed most economic sectors, San Diego is California's primary overland gateway to U.S.-Mexico cross-border trade and the Port of San Diego. While small relative to other North American container ports (ranking 40th in container volumes), the Port of San Diego (Port) moves a wide mix of bulk, break-bulk, and particularly automotive cargoes. The Port also serves as one of 17 "strategic ports" across the country, designated by the Maritime Administration of the U.S. Department of Transportation, meaning the port plays a role in the military's logistics and must coordinate and work with the military when needed.12
Basic facts related to goods movement in the NCC are highlighted below and placed within the context of regional freight flows and the regional economy.
3.1.1 Regional Freight Flows
San Diego is a major north-south freight gateway connecting the region and points south to the Los Angeles basin and the rest of California and the west coast. High-level analysis of freight flows indicates that regional freight movements are dominated by within-region shippers.13 In all, 92% of freight by volume moves either inbound, outbound, or transits entirely within San Diego County; only about 8% of regional freight passes through the region without stopping. In percentage terms, San Diego's international trade (including the cross border with Mexico, Canada trade overland, and goods moving through the Port) represents a small share–about 4%–of total San Diego goods flows, but additional trade volumes move across the border and in and out of the Port through the region, connecting to other U.S. locations.
3.1.2 NCC Freight Flows
The NCC–primarily the I-5 highway for trucking but also freight rail on the LOSSAN rail corridor– represents a major north-south conduit for goods movement within and through the region. The other major truck freight corridors are Interstate 15 (I-15); State Route 125 with a connection to the Otay Mesa Port of Entry via State Route 905; and State Routes 94/188 connecting to the Tecate Port of Entry. I-5 carries about one-third of the approximately 23,000 trucks each day using these three primary north-south routes.14
Slightly more recent NCC truck travel data, obtained for this study from the SANDAG Series 12 travel demand model, indicates that truck volumes averaged about 9,000 trucks per day in each direction at the peak loading point along I-5 in 2010 (near State Route 56), or about 5.2 million truck trips per year in both directions. Given an industry average truck payload of 10 tons, this translates to about 50 million tons hauled by truck in both directions.15 SANDAG travel demand forecasts project growth in I-5 truck traffic of about 90% between now and 2040.
LOSSAN corridor rail volumes, while strategically important–especially for the import of automobiles made in Mexico and for Port automotive imports and other commerce–are significantly smaller; less than 10% of the total north-south freight (measured by ton-miles) moves by rail through the LOSSAN corridor.
3.1.3 Freight Value
The value of freight currently moving through the NCC, another measure of the importance of the NCC for goods movement, is difficult to estimate precisely since (at least on the trucking side) trucks are not tracked and may use the entire corridor from north to south, or they may only traverse part of the corridor. In addition, detailed information on the exact mix of cargoes is not reliably reported. However, an approximate estimate can be made of this in total and as a share of regional freight, based on truck vehicle and cargo ton-miles in the corridor and region, as well as average cargo values per truck for the region.16 Truck vehicle miles for the corridor and region have been obtained from the SANDAG travel demand model as part of this study.17
Rail freight value has been estimated previously for the LOSSAN corridor for the year 2007 and this can be added to the truck total.
Based on the NCC corridor and total regional truck VMT obtained for this study from the SANDAG travel demand, the value of freight hauled by truck in the NCC in 2010 was approximately $43 billion, which represents about a 13% share of the similarly estimated regional total.18 LOSSAN Rail freight adds approximately $1.5 billion more to the NCC total.19
3.1.4 Regional Economic Structure and the Economic Importance of Freight
In addition to the freight flow volumes and value data, analysis of economic data and the structural characteristics of the regional economy highlight the importance of goods movement to the San Diego economy from a different perspective. Major salient points that highlight the importance of goods movement to the region's economy include the following:
- The Transportation and Warehousing sector supports 20,000 jobs in the San Diego region.20
- While overall manufacturing jobs in San Diego are a smaller proportion of total employment than for the U.S. as a whole, selected industries are highly present and critical to the region's economy. In particular, the Computer and Electronics manufacturing sector employs 25,000 workers and has a location quotient of 2.38, indicating a much higher concentration of jobs in this sector in San Diego than for the U.S. as a whole.21 Jobs in this sector tend to have higher wages, compared with traditional manufacturing of heavy machinery and equipment, metals, and so forth.
- The San Diego region has 13 traded industry clusters (as identified by in the SANDAG Traded Industry Cluster report). These employ over 330,000 persons (2010), or about 27% of total regional employment. While not all involve goods production or significant goods movement (the largest sector is Entertainment and Hospitality), many do, including:
- Aerospace, Navigation and Maritime Tech (32,000 jobs)
- Biotechnology and Pharmaceuticals (22,000)
- Biomedical Devices and Products (12,000)
- Cleantech (8,000)
- Horticulture (6,000)
- Advanced Precision Manufacturing (4,400)
- Fruits and Vegetables (4,200)
- Apparel and Actions Sports Manufacturing (2,800)
- Specialty Foods and Microbreweries (1,700)
- The military, although a major contributor to the regional economy, is not included in traded industry clusters.
- There is a significant overseas export base in San Diego. According to data compiled by the University of California, San Diego, export industries employ about 113,000 workers in the region, ranking San Diego 18th in this category among the top 100 U.S. metro areas.22 Major tech overseas export industries include Computers and Electronics, Aerospace,23 Transportation Equipment, and Chemicals. However, the region lags in export intensity (export share of GDP), and significant transport and other bottlenecks constrain export activity.
- Cross border flows have an important role in San Diego's economy. Key economic sector growth in Mexico, including considerable automotive manufacturing in Baja California as well as maquiladora production and assembly activities along the border, require significant cross-border freight movement. This production provides a market for the manufacture of more specialized, higher-tech components such as electronics by San Diego-based producers.
- According to recent surveys, close to 20% of export-oriented firms in the San Diego region believe that road capacity is a significant bottleneck to their activity (exporters indicated even greater concerns about port and airport capacity, at 25% and 35%, respectively).24
3.2 Methodology
Regional economic benefits from improved freight mobility improvements in the NCC stem in large measure from transportation cost savings to firms that ship goods via truck, resulting from travel time improvements on I-5. Additional benefits are also derived from capacity improvements to the LOSSAN freight rail corridor, which provides operational improvements and preserves rail market share. This analysis, as described directly below, focuses on those savings.
The first step–analysis of freight travel time and cost savings–is straightforward: Using the truck travel demand estimates from the SANDAG Series 12 travel demand model, combined with modeled estimates of per-trip time savings with I-5 improvements in the NCC versus the No-Build scenario, truck hours saved were estimated and monetized (in 2012 dollars). Truck vehicle hours saved have been monetized to arrive at cost savings using a researched per-truck vehicle hour cost estimate;25 that estimate includes both the incremental operations and maintenance cost of large over-the-road trucks as well as the economic cost of freight delay, which includes higher inventory costs plus the hourly time penalty associated with delays in delivering goods and services to end-user markets.
The next step utilized the freight transport and inventory cost savings to derive regional economic impacts including economic output,26 employment, wage earnings, and Gross Regional Product (GRP).27 Freight transport and inventory cost savings (freight benefits) represent real, tangible monetary savings that accrue directly to service providers (e.g., trucking and other supply chain service providers) and to shippers (i.e., the "beneficial owners" of cargo who ship and receive goods, such as manufacturers, retailers, and even some service industries). To assess the regional economic benefits of these initial savings, Parsons Brinckerhoff's proprietary economic impact model PRISMTM (PRIoritization Scenario Model) was used.28 PRISM, which utilizes the IMPLAN input-output modeling system,29 relates freight transport cost savings to industry output and earnings and also to household income and consumption. (See Appendix A for more detail on PRISM.) For this analysis, the freight transport and inventory cost savings are initially distributed within PRISM, as first-order effects, to industries based on those industries' shares of employment in the San Diego region. The effects of these savings are then weighted based on the transportation share of production costs for each industry. The latter is estimated using the most recently available Bureau of Economic Analysis Benchmark Input-Output make-use tables, supplemented by the Federal Highway Administration's Transportation Satellite Accounts database.
As a final step, based on a broad survey of research, PRISM assumes that a share of the freight savings will be retained by each of the directly impacted industries as profits, and some will be reinvested or spent to expand output/production, as market reach expands and production costs fall. Another portion will be retained by transportation providers, such as trucking companies and logistics and distribution service providers, and a remaining portion will benefit households in the form of consumer price reductions. To the extent that these freight transportation cost savings are assumed to increase the final production or output of an industry, input-output multipliers are applied to obtain the total economic impact in the area.
As noted, LOSSAN freight rail capacity improvements will also generate freight economic benefits. Those benefits are considerably smaller relative to trucking, adding about 2% to the total freight-related economic benefit of the NCC program of improvements. The smaller share of benefits reflects the fact that rail freight is less than 10% of the corridor total, and also because the benefits estimated for rail were derived from market share preservation and avoided trucking costs, but did not consider speed or operational improvements, as they could not be quantified for this study.
3.3 Methodology Limitations/Caveats
As noted, the benefits estimated in this analysis are linked to direct transportation cost savings resulting from truck travel time improvements on I-5 and capacity improvements to the LOSSAN freight rail corridor. Other regional economic consequences, including potential impacts on business firms' location decisions–i.e., whether outside firms would move to the region because of improved freight accessibility, or existing firms would choose to leave the region as transport conditions in the corridor deteriorate– have not been modeled as it is beyond the scope of this study. However, impacts of this type can also occur, depending on the relative importance of freight transportation to business location decisions, and the extent to which future bottlenecks would hinder existing firms' supply chain operations, increase business costs, and lower rates of return within a competitive framework. As a result of these limitations, the results reported here may understate overall economic benefits from improved goods movement. The wider economic impacts are addressed later in this report through a benchmarking analysis that researches and reviews the broader economic impacts of major corridor investments in other regions and applies those lessons to the NCC and the San Diego region.
In addition, no specific provision is made in this analysis for the impacts of corridor transportation improvements on business owners' access to workers or consumers–it focuses strictly on the movement of goods. In this sense, the analysis of freight is a partial analysis of economic impacts, and considerable other economic benefits will almost certainly occur in addition to freight-related benefits. A much broader but very high-level analysis of the overall economic impacts of the NCC mobility projects is addressed, to the maximum extent possible, in a subsequent section of the report, which benchmarks the potential long-term NCC economic impacts to studied economic outcomes observed in other regions that have undertaken similar major corridor transportation improvements.
Given the partial nature of the freight economic analysis, the benefits reported below should not be compared with project costs, as the overall NCC program of projects delivers a much wider range of benefits, to automobile users in particular (commuters, non-commuters, tourist visitors, etc.) and residents as a whole in the form of enhanced highway safety, reduced vehicle emissions, other environmental benefits to the region as a whole and the coastal resources and communities in the NCC, and others. A full range of these benefits is documented in the NCC PWP/TREP.
3.4 Results
The analysis described above indicated that the NCC highway improvements, by reducing congestion and increasing truck travel speeds on I-5, result in transportation cost savings in the movement of freight and that this, in turn, will generate direct benefits to the region's shippers (including transportation service providers and businesses that transport goods) and to consumers and households. The results show significant positive impacts on regional economic activity, including output, GRP, employment, and wage earnings relative to the No-Build scenario.
The initial, or direct transport and inventory, cost savings (for truck freight) for 2040 are summarized in Table 3-1. In-region shipper cost savings are estimated based on the SANDAG travel demand model, which was used to identify future truck trips according to whether they originate or terminate (or both) in the San Diego region, or simply pass through the region without benefiting regional shippers. The table breaks out the truck cost savings by AM peak, PM peak, and other non-peak times. These distinctions matter in the analysis as projected travel time savings in the corridor vary to some extent among the periods.
Table 3-1: 2040 Transport And Inventory Cost Savings: Total And Within Region
Source: Parsons Brinckerhoff.
| Segment Trips | Total Truck Operations / Transport Cost Savings (Annual) | Total In- Region Truck Operations / Transport Cost Savings (Annual) | Total In-Region Inventory Cost Savings (Annual) | Total In-Region Cost Savings (Annual) | |
|---|---|---|---|---|---|
| Northbound AM Peak Period | 8,349 | $ 32,423,753 | $ 2,732,034 | ||
| Southbound AM Peak Period | 8,145 | $ 51,802,207 | $ 4,364,868 | ||
| Total AM peak | $ 84,225,960 | $ 46,284,140 | $ 7,096,901 | $ 53,381,041 | |
| Northbound PM Peak Period | 8,061 | $ 72,874,044 | $ 5,824,748 | ||
| Southbound PM Peak Period | 7,798 | $ 28,194,269 | $ 2,253,539 | ||
| Total PM peak | $ 101,068,313 | $ 52,684,481 | $ 8,078,287 | $ 60,762,768 | |
| Northbound Other Times (Off-Peak) | 31,971 | $ 16,697,460 | $1,461,797 | ||
| Southbound Other Times (Off-Peak) | 30,290 | $ 15,819,644 | $1,384,948 | ||
| Total Off-Peak | $ 32,517,104 | $ 18,565,725 | $ 2,846,744 | $ 21,412,469 | |
| Total Corridor | $ 217,811,377 | $ 117,534,345 | $ 18,021,933 | $ 135,556,278 |
Travel time savings per trip for each period (AM peak, PM peak, and weekday off-peak) were obtained from travel demand modeling undertaken as part of the larger NCC PWP/TREP. On average, peak-period travel time reductions along I-5 (comparing general travel lane No-Build vs. Build trip times) are expected to average approximately 13 minutes to as much as a half-hour (northbound during the PM peak) by 2040.30 It is assumed that because freight movements are time-sensitive and schedule-adherent, not much shifting of trucks between peak and off-peak periods is expected.
As seen in Table 3-1, total in-region truck transport cost savings resulting from implementing the NCC project are estimated to equal $118 million (in 2012 dollars) annually in 2040; inventory savings add another $18 million to the annual benefit, for a total of $136 million in direct shipper cost savings.
To aid in interpreting the relative significance of this result, it is useful to consider direct transport cost savings as a percentage of corridor freight value. The $136 million in 2040 shipper savings compares with a total in-region value of freight currently moving through the corridor (in 2010) of about $32 billion.31 Accordingly, and estimating additional freight growth to 2040 of about 1.9% per year based on SANDAG forecasts, the direct transport, and inventory cost savings comprise about 0.2% of the total 2040 (real) market value of regional truck freight moving along the NCC/I-5. Furthermore, assuming profit margins of around 10% for regional NCC shipper industries, the impact on net earnings of these firms before interest, taxes, and depreciation would be around 2%.32 Many producers and shippers operate on margins of just a few percentage points, meaning that a 2% increase in net earnings (or a similar decrease in costs), estimated to result under the No-Build condition, can have significant impacts on the profitability–and therefore the viability–of many local industries. This should be viewed as an order-of-magnitude estimate with a substantially wide margin of error given the likely imprecision in the estimate of the value of truck freight in the NCC.
The overall economic benefits reported in Table 3-2 may best be viewed as regional economic losses that would be avoided by implementing the NCC program of improvements. These direct economic benefits would spur a series of subsequent indirect and induced activities as a result of interconnected economic relationships, also known as multiplier effects. Indirect impacts result from industry-to-industry transactions and represent a measure of the change in the output of suppliers linked to the industry that is directly affected. Induced impacts consist of impacts of employee spending in the regional economy. For this analysis, impacts are expressed in terms of three variables: Output, Employment, GRP (or Value Added) and Wages. The output represents the change in regional sales or revenue. Employment represents the change in the number of jobs in the regional economy resulting from a change in regional output. GRP is the value of output less the value of intermediate consumption and is a measure of the contribution to GDP made by an industry or sector. Wages represent the change in gross employee wages and salaries in the regional economy resulting from a change in regional output.33
Table 3-2: Summary Of Annual Economic Impacts From Enhanced Freight Mobility (In 2012 $)
Source: Parsons Brinckerhoff.
| Employment | Wages (in millions) | GRP (in millions) | Output (in millions) | |
|---|---|---|---|---|
| Direct Impacts | 1,118 | $67.2 | $85.9 | $135.6 |
| Indirect Impacts | 219 | $13.3 | $20.5 | $31.1 |
| Induced Impacts | 614 | $30.4 | $86.9 | $114.0 |
| Total Economic Impacts | 1,951 | $110.9 | $193.3 | $280.7 |
These direct cost savings result in total economic impacts (including multiplier effects derived from the input-output model)34 of close to 2,000 permanent jobs, household wages of $111 million per year, and GRP of $194 million. GRP is a subset of total output increase, which reflects total sales for all industries including intermediate purchases; the total output gain would be about $281 million annually.35
Not shown in these results are the benefits resulting from freight rail capacity improvements. Those benefits, which result from increased LOSSAN throughput capacity, result in another $6 million in regional output benefits annually due primarily to avoided costs, which would otherwise arise from rail-to-truck diversions occurring absent the LOSSAN freight rail capacity improvements.
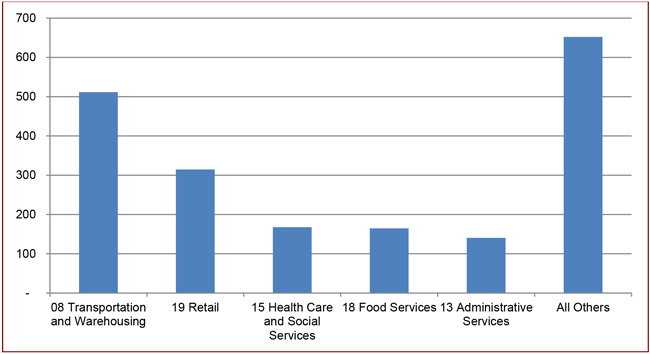
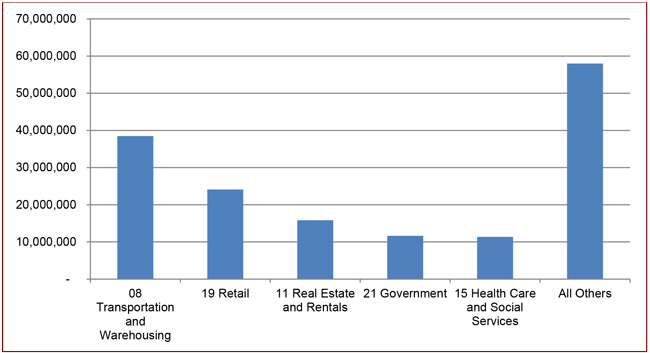
Employment and GRP impacts (from truck benefits only) are further highlighted in Figures 3-1 and 3-2 below. These figures disaggregate the summary information in Table 3-2, showing employment and GRP impacts by major industry grouping, with the top five industries shown, and all other industries grouped to complete the totals. Because a substantial share of the transport savings are retained by trucking and other service providers, the freight transport, warehousing, and distribution sector benefits most, with retail a major beneficiary as well. Surprisingly, services also garner a large share of total benefits, given their major presence in the region as a share of all economic activity, and also because of the surprisingly high dependence on freight by these industries, particularly through package delivery services.
4.0 Economic Benefits of Improved Accessibility to Tourism
4.1 Overview
As one of the top tourist destinations in both the state and country, the tourism sector is a critical component of the San Diego economy. As such, there is interest in understanding how the proposed NCC project will impact and enhance this valuable industry. This section examines the tourism impacts of the project, including corridor-based sites and attractions, the accommodation and lodging market within the project area, and wider regional impacts due to improved pass-through travel times along I-5. It outlines:
- The overall value of the tourism economy to the region.
- The direct economic impacts of the proposed project improvements on specific components of the tourism sector.
- The total economic impacts, including indirect and induced impacts.
4.1.1 San Diego's Tourism Economy
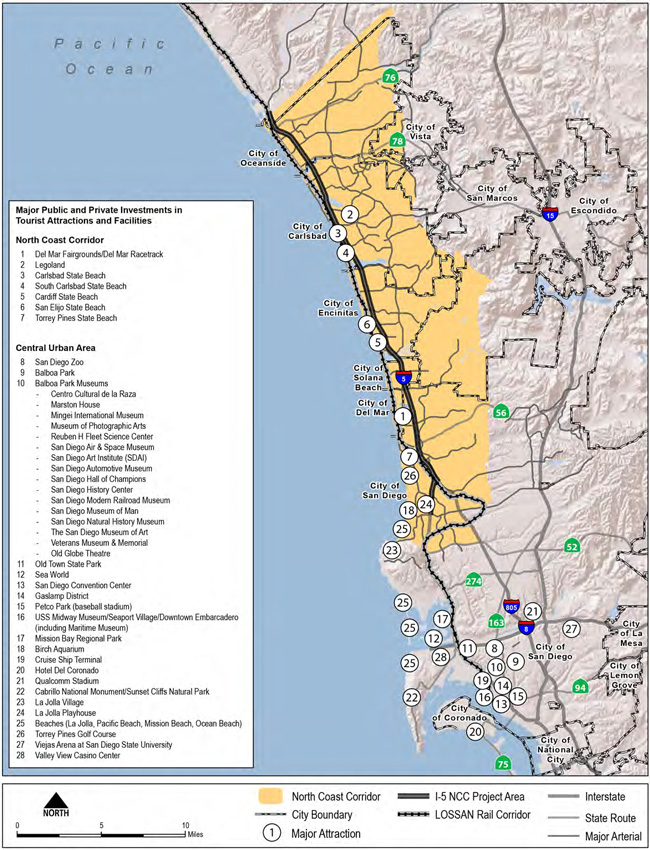
As the second-largest traded sector in San Diego, the travel and tourism industry plays a vital role in the regional economy, contributing $8 billion in direct visitor spending and $18.3 in total economic impact annually in 2012.36 With approximately 32 million annual visitors, San Diego ranks in the top ten cities in the United States in terms of total annual visitation.37 Leisure travelers are attracted to the region as it provides an appealing climate year-round, major attractions, natural resources, a wide range of recreational opportunities, special events, and a cruise ship terminal. San Diego also attracts significant business travel, as the region is a hub of the defense, trade, cleantech and research industry sectors, and is also home to a 615,000 square-foot convention center. The region has made significant public and private investment in developing and operating tourist and visitor facilities, attractions and infrastructure to grow and support the local tourism industry. As shown in Figure 4-1, a number of the region's major attractions and activity centers are located in the NCC and many more are located in the urbanized areas of central San Diego. I-5 acts not only as of the gateway to the NCC's attractions but also as the conduit to the region's central-area tourist attractions from the heavily populated areas of Los Angeles and Orange County to the north. The economic influence of the tourism industry in the San Diego region, as well as the preponderance of major attractions within its boundaries, demonstrate the importance of ensuring and maintaining efficient access to these sites for both visitors and residents.
Visitor spending is considered an economic injection, since it is derived from sources outside the local economy, and thus, the $8 billion in direct visitor spending in 2012 is a net new activity to the San Diego economy. This spending has a significant fiscal impact on the region, with transient occupancy taxes (a lodging tax of 10.5%) contributing $150 million to the region's finances in 2012.38 The tourism industry impacts a number of downstream industries in the region, such as retail, food services, arts and entertainment, and transportation, resulting in high multiplier effects. From an employment perspective, the industry is an inherently local sector, requiring jobs to be physically based within San Diego, and it currently employs 160,000 people in the region, constituting 13% of the total San Diego workforce.39
Regional accessibility and ease of movement are closely tied to the success and growth of the tourism market. Strategic transportation investment helps to increase tourist visitation, lengths of stay, and visitor expenditures. Inversely, traffic congestion, poor road conditions, and accessibility problems decrease the attractiveness of an area or region. The transportation network has particular relevance for the San Diego tourism market, as major sites and attractions are geographically dispersed across the region, and the visitation market is heavily dependent on day-trip visitors, thus bringing the issue of accessibility to the forefront. Since the tourism industry is such a critical component of the regional economy, it is valuable to analyze the NCC project through the perspective of the sector and to estimate the potential economic impacts of the project on the industry.
4.1.2 Tourism in the North Coast Corridor
The NCC is a critical component of the tourism-related transportation network within the region. The corridor provides access to major attractions and recreational resources including Legoland, the San Diego County Fair, the Del Mar Racetrack, and nearly 30 miles of coastal amenities along the Pacific Ocean such as beaches, trails, marinas, and recreational facilities related to sport fishing, boating, and natural resource and education centers. Nineteen interchanges along the project area provide direct access to the corridor's beaches and harbors, and more than an estimated 15.4 million people visit the NCC's beaches each year.40 The NCC includes a strong hotel market, with 82 lodging properties in the project area, covering a wide range of accommodation types, from large, major chain hotels to smaller, beach-adjacent properties. It also acts as the primary link between the Los Angeles metropolitan area (including Los Angeles and Orange counties) and the San Diego region, and as such, its importance extends beyond sites directly along the corridor. Increased congestion and travel times along the NCC would inhibit coastal access, decrease the appeal of local hotels and recreational amenities, and negatively impact the regional tourism economy.
Table 4-1 provides an overview of the tourism market in the NCC and the overall value of the corridor to the regional tourism economy. There are over 9,100 hotel rooms in the project area, constituting 16% of the total hotel room stock in the San Diego region. More than 19 million people visited one of the major sites or attractions within the NCC in 2012,41 representing 55% of the total possible market.42 It is estimated that approximately 9.8 million day-trip visitors used the I-5 corridor as a means to access the regional tourist market in 2012, representing more than 30% of total visitation to San Diego.43
Table 4-1: Tourism Snapshot Of The North Coast Corridor, 2012
Sources: San Diego Tourism Authority, Smith Travel Research, US Census, North Coast Corridor PWP/TREP.
| Total Hotel Rooms in Corridor | 9,119 |
|---|---|
| As a Proportion of Total Regional Room Inventory | 16% |
| Total Visitation of Major Attractions in Corridor | 19,360,000 |
| As a Proportion of Total Possible Market (Visitors + Residents) | 55% |
| Total Daytrip Visitors utilizing the I-5 Corridor | 9,775,200 |
| As a Proportion of Total Regional Tourist Visitation | 30% |
4.1.3 Tourist Impact Analysis Approach
Improved accessibility and reduced travel times along the NCC will have a direct positive impact on the tourism economy compared to No-Build Scenario, and this analysis quantifies the estimated benefits as a result of the proposed NCC project. The tourism impact analysis assumes that the primary quantifiable tourism-related impacts derived from the project include:
- The prevention of losses in visitation to NCC attractions, from both tourists and residents, that would have resulted from unfavorable transportation conditions along I-5.
- The prevention of losses in lodging-based revenues and expenditures in the NCC, as measured by occupancy rates and average daily rates.
- The prevention of losses in day-trip visitation to the entire region that would have resulted from degraded pass-through travel times along I-5 in the NCC.
The specific methodological approach for each of these impact types is covered in their respective sections of this chapter.
4.2 Assumptions
This section outlines the initial assumptions drafted and utilized to conduct tourism impact analysis. Assumptions pertaining to the specific impacts are covered in their respective sections of this chapter.
4.2.1 Travel Time Savings
To determine how the NCC project will impact attraction visitation and regional visitation, a methodology was drafted to:
- Derive the appropriate travel time savings assumptions to apply to the analysis.
- Translate the travel time savings into visitation impacts.
The following will outline the approach used to derive the necessary assumptions pertaining to travel time savings and visitation elasticities, specifically as it pertains to the attraction visitation impacts and day-trip visitation impacts calculated for this analysis.
Table 4-2 shows travel times for the project area (along I-5 from La Jolla Village Drive in San Diego to Harbor Drive in Oceanside) as extracted from the SANDAG/Caltrans Series 11 Micro-Simulation Model and highlighted in the PWP/TREP. Weekday AM and PM peak-period data from the model was utilized as it provides the most established, and thus defensible, data points from the model. Weekend and off-peak data, while more applicable to the tourism analysis, does not exist in the same thorough and robust manner. For similar reasons, potential travel time savings for the express lanes were not applied in this analysis. Since potential express lane time savings were not incorporated into this analysis, the results likely underestimate potential impacts, thereby contributing to a more conservative approach.
Due to the nature of the available data, adjustments were necessary for the tourism analysis. As the data are represented as straightforward travel-time differentials for the entire corridor between the Build and No-Build scenarios, they were adjusted accordingly to determine Build Scenario travel time savings across a wide range of travel scenarios relevant for this analysis (for example, travel times savings between downtown San Diego and Carlsbad State Beach, or between Los Angeles and Legoland, or between Orange and Downtown San Diego, etc.).
Table 4-2: Travel Times And Savings For NCC, Build Vs. No-Build
Source: SANDAG/Caltrans Series 11 Micro-Simulation Model, August 2010; North Coast Corridor PWP/TREP.
| Time/ Direction | I-5 Series 11/MicroSimulation 2040 No-Build | I-5 Series 11/MicroSimulation 2040 Build | I-5 % Difference |
|---|---|---|---|
| Northbound AM Peak Period | 37 | 26 | 30% |
| Southbound AM Peak Period | 54 | 36 | 33% |
| Northbound PM Peak Period | 70 | 45 | 36% |
| Southbound PM Peak Period | 40 | 30 | 25% |
| Northbound Differential Average | 33% | ||
| Southbound Differential Average | 29% |
To accomplish this, the first step in the process involves converting the data from Table 4-2 into proportional reductions. The average of the directional proportional differentials was used since, unlike commuters and business travel, tourist travel is assumed to be tied less strictly to directional or time-of-day travel periods. As a result, the travel time savings assumptions used are:
- Northbound travel time along any stretch of the I-5 corridor will decrease by 33% under a Build Scenario (relative to the No-Build Scenario).
- Southbound travel time along any stretch of the I-5 corridor will decrease by 29% under a Build Scenario (relative to the No-Build Scenario).
As tourist attractions are dispersed throughout the NCC, and visitors originate from a variety of locations, the micro-simulation numbers were further refined for this tourism impact analysis. As explained in greater detail in the 'Attraction Visitation' section, travel time savings were calculated for three categories of visitors – Overnight Visitors, Day-trip Visitors44, and Local Residents45 – to and from a limited range of 'origins'. Due to the wide variety of possible 'origins,' this analysis simplifies the process by assuming Overnight Visitors and Local Residents originate in Downtown San Diego since downtown acts as both the hub of the regional tourist market, as well as the population-based and geographical tourist center of the region. Day-trip Visitor travel time estimates are an average of the four major sources of day-trip visitation to the region: Los Angeles, Orange County, Tijuana, and Downtown San Diego. Table 4-3 and Table 4-4 outline these calculations. Since using the No-Build Weekday AM and PM peak-period figures would overestimate the travel times faced by tourists, this analysis uses the current average travel times to/from the various attractions along the corridor as the No-Build scenario, and then applies the estimated northbound and southbound proportional reductions from Table 4-2 (33% and 29%, respectively) to estimate the Build Scenario travel times.
Overnight Visitors and Local Residents would experience a reduction of 9 to 22% in their travel times to the various attractions along the NCC with the proposed corridor project versus the No-Build scenario, while Day-trip Visitors would see their travel times reduced by approximately 7 to 9% on average. These assumptions are applied under 'Attraction Visitation' to estimate the impacts of the NCC proposed project improvements on visitation to attractions along the corridor.
Table 4-3: Travel Time Reductions and Visitation Loss Preventions for Overnight Visitors and Local Residents Resulting from the NCC Project
No-Build Scenario Travel Time from Downtown San Diego (in minutes)
No-Build Scenario Travel Time Reduction Torrey Pines SB 25 21 16% San Elijo SB 33 27 18% Cardiff SB 30 25 16% Carlsbad SB 37 29 20% South Carlsbad SB 37 30 19% Open Beaches Oceanside 42 33 22% Carlsbad 37 29 20% Encinitas 34 27 19% Del Mar/Solana 30 25 17% San Diego/La Jolla 19 17 9% San Diego County Fair 25 22 12% Del Mar Racetrack 25 22 12% Legoland 37 30 19%
Table 4-4: Travel Time Reductions and Visitation Loss Preventions for Day-trip Visitors
Source: Parsons Brinckerhoff.
| < /th> | From Los Angeles No-Build |
From Los Angeles Build |
From Orange No-Build |
From Orange Build |
From Tijuana No-Build |
From Tijuana Build |
From Downtown No-Build |
From Downtown Build |
Average No-Build |
Average Build |
Travel Time Reduction |
|---|---|---|---|---|---|---|---|---|---|---|---|
| State Beaches | |||||||||||
| Torrey Pines SB | 102 | 96 | 74 | 68 | 45 | 41 | 25 | 21 | 62 | 56 | 8% |
| San Elijo SB | 96 | 91 | 67 | 62 | 52 | 46 | 33 | 27 | 62 | 57 | 9% |
| Cardiff SB | 95 | 90 | 67 | 62 | 49 | 44 | 30 | 25 | 60 | 55 | 8% |
| Carlsbad SB | 87 | 84 | 58 | 55 | 56 | 48 | 37 | 29 | 60 | 54 | 9% |
| South Carlsbad SB | 87 | 84 | 58 | 55 | 56 | 49 | 37 | 30 | 60 | 55 | 8% |
| Open Beaches | |||||||||||
| Oceanside | 84 | 82 | 56 | 54 | 68 | 59 | 42 | 33 | 63 | 57 | 9% |
| Carlsbad | 86 | 83 | 58 | 55 | 63 | 55 | 37 | 29 | 61 | 56 | 8% |
| Encinitas | 94 | 89 | 66 | 61 | 60 | 53 | 34 | 27 | 64 | 58 | 9% |
| Del Mar/Solana | 99 | 93 | 71 | 65 | 56 | 51 | 30 | 25 | 64 | 58 | 9% |
| San Diego/La Jolla | 104 | 96 | 76 | 68 | 45 | 43 | 19 | 17 | 61 | 56 | 8% |
| San Diego County Fair | 97 | 92 | 68 | 63 | 44 | 41 | 25 | 22 | 59 | 54 | 7% |
| Del Mar Racetrack | 97 | 92 | 68 | 63 | 44 | 41 | 25 | 22 | 59 | 54 | 7% |
| Legoland | 90 | 87 | 61 | 58 | 56 | 49 | 37 | 30 | 61 | 56 | 8% |
4.2.2 Travel Time Elasticity
Once the travel time savings assumptions are established, the analysis estimates how these travel time reductions would impact tourist visitation and movements. To do this, an assumption in terms of tourist-based travel time elasticities needs to be applied. Elasticity refers to the measurement of how changing one economic variable, in this case, travel times, affects another dependent variable, in this case, tourist visitation. While travel time elasticities for commuter and business travel have been solidly researched, tourist-related travel has been less analyzed. One of the primary reasons for this is that there is a stronger interest in the policy and decision-making level on the relationship between transportation investment and business-related travel than transportation investment and tourist travel. Furthermore, tourism elasticities are highly geographically-specific and more susceptible to local variability. Representative travel time elasticities for local-area tourists would require a detailed surveying exercise to better understand local tourist visitation and behavioral patterns.
Without directly related research available, this analysis uses commute-based elasticity research as a proxy for tourist-based elasticity. Existing research has demonstrated that, for day-to-day commuters, long-term travel time elasticity is approximately 1.0, meaning that a 10% increase in travel times results in a 10% decrease in traffic volumes.46 While tourist-based travel patterns differ from that of commuters, there are a number of reasons why using the same elasticity could be appropriate for this separate category of users. Tourist travel is more 'flexible' than commute travel (i.e. less tied to specific times of day) making it less sensitive to potential travel time increases since tourist can more readily shift their trips to avoid congested peak periods. However, in the NCC, the significant increase in the duration of daily congested periods on I-5–as projected under the No-Build Scenario (Section 2.2.2)–would greatly narrow the windows of time in which tourists could choose to travel in uncongested conditions. By contrast, tourist travel also is less 'essential' than commute travel (i.e. less tied to economic activity) making it more sensitive to potential travel time savings. Due to these counter-balancing factors of tourist travel when compared to commute travel, this analysis conservatively assumes a travel time elasticity of 1.0 for tourism-related travel, both for sites and attractions within the NCC and for visitors using the NCC to access the wider tourist market. To address the potential variability in travel time elasticities, the addendum to this chapter provides a sensitivity analysis as it relates to travel time elasticities, showing the total economic impacts for a range of elasticities between 0.75 and 1.25.
4.2.3 Visitor Expenditures
Since the major source of economic value from the tourism sector is visitor expenditures, this analysis uses average daily visitor expenditures by various categories for the San Diego region as a means to measure the direct economic impact for a number of the potential impacts analyzed. Table 4-5 outlines the average daily visitor expenditures by various retail categories for two categories of travelers as defined by the San Diego Tourism Authority (SDTA): leisure visitors and overnight visitors. For this analysis, impacts related to attractions along the corridor or regional day-trip visitors apply 'leisure visitor' expenditure patterns, while impacts related to increased lodging-based visitation along the corridor apply 'overnight visitor' expenditure patterns. The SDTA estimates that the average leisure traveler spends approximately $95 per day visiting the region, while average overnight visitors spend approximately $124 a day while visiting the region. Half of the total expenditures fall under lodging and dining, while the remaining half is dispersed across a range of categories, including shopping, attractions, transportation, etc.
Table 4-5: Average Daily Expenditures By Category for San Diego Visitors
Source: San Diego County Visitors Profile Study, San Diego Tourism Authority; CIC Research.
| Expenditures Breakdown | Leisure Visitors | Overnight Visitors | |
|---|---|---|---|
| Lodging | 30% | $29 | $37 |
| F&B, Dining | 20% | $19 | $25 |
| Shopping | 15% | $14 | $19 |
| Attractions, Entertainment | 10% | $10 | $12 |
| Airport Expenditures | 9% | $9 | $11 |
| Exhibitor & Association Spending | 6% | $6 | $7 |
| Transportation (Car Rental, Taxis, Gasoline) | 5% | $5 | $6 |
| Other | 5% | $5 | $6 |
| Average Spending Per Visitor | $95 | $124 |
4.3 Impacts
This section outlines the methodological approach and monetized impacts by the specific sector categories analyzed in the tourism impact study.
4.3.1 Attraction Visitation
As congestion worsens along the NCC under a No-Build Scenario, major attractions along the corridor would see a decrease in visitation. Inversely, under a Build Scenario, these attractions could avoid potential losses in visitation that would occur without the NCC project. This section estimates the direct economic benefits associated with that loss prevention.
There are a number of major regional attractions along the NCC, as outlined in Table 4-6.47 The corridor contains many of the region's major beach destinations, with the area's beaches (state and open) attracting an estimated 15.5 million visitors a year. Attendance figures show that Legoland attracts approximately 1.7 million visitors annually, while the Del Mar Racetrack and the annual San Diego County Fair (held at the Del Mar Fairgrounds) attract more than 2 million visitors a year. While the attraction market in the area is currently strong, increased congestion and travel times will deter visitation from both visitors and residents, thereby reducing the overall economic activity within the corridor's tourism sector.
As travel time savings, and thus visitation impacts, would vary across different categories of tourists depending on origin, the attraction visitation has been further broken down across three categories: day-trip visitors, overnight visitors, and residents. The breakdown across these tourist categories was estimated by Parsons Brinckerhoff based on discussions with the San Diego Tourism Authority, review of existing San Diego tourism research, and general knowledge of the tourism market in California.
Table 4-6: Attraction Visitation
Sources: North Coast Corridor PWP/TREP; Parsons Brinckerhoff; California State Park System Statistical Report, 2011-12 Fiscal Year, California Department of Parks and Recreation, 2012.
Note: Open beach attendance estimated by applying NCC state beach attendance per coastal mile (7.62 million visitors for 12.2 miles) to the total coastal mileage in the corridor.
| Estimated Annual Attendance | Overnight Visitors % | Overnight Visitors Count | Daytrip Visitors % | Daytrip Visitors Count | County Residents % | County Residents Count | |
|---|---|---|---|---|---|---|---|
| State Beaches | 7,620,000 | ||||||
| Torrey Pines SB | 1,950,000 | 15% | 292,500 | 25% | 487,500 | 60% | 1,170,000 |
| San Elijo SB | 1,210,000 | 15% | 181,500 | 25% | 302,500 | 60% | 726,000 |
| Cardiff SB | 1,850,000 | 15% | 277,500 | 25% | 462,500 | 60% | 1,110,000 |
| Carlsbad SB | 1,420,000 | 15% | 213,000 | 25% | 355,000 | 60% | 852,000 |
| South Carlsbad SB | 1,190,000 | 15% | 178,500 | 25% | 297,500 | 60% | 714,000 |
| Open Beaches | 7,870,000 | ||||||
| Oceanside | 1,574,000 | 15% | 236,100 | 25% | 393,500 | 60% | 944,400 |
| Carlsbad | 1,574,000 | 15% | 236,100 | 25% | 393,500 | 60% | 944,400 |
| Encinitas | 1,574,000 | 15% | 236,100 | 25% | 393,500 | 60% | 944,400 |
| Del Mar/Solana | 1,574,000 | 15% | 236,100 | 25% | 393,500 | 60% | 944,400 |
| San Diego/La Jolla | 1,574,000 | 15% | 236,100 | 25% | 393,500 | 60% | 944,400 |
| San Diego County Fair | 1,520,000 | 5% | 76,000 | 15% | 228,000 | 80% | 1,216,000 |
| Del Mar Racetrack | 650,000 | 5% | 32,500 | 15% | 97,500 | 80% | 520,000 |
| Legoland | 1,700,000 | 30% | 510,000 | 35% | 595,000 | 35% | 595,000 |
| Total | 19,360,000 | 2,942,000 | 4,793,000 | 11,625,000 |
As discussed in the preceding 'Assumptions' section, this analysis applies a travel time-based elasticity of 1.0 in relation to tourism and travel-related trips. This implies that a 10% reduction in travel times results in a 10% differential in tourism-based travel, which in this case, would be a reduction in visitation loss. As outlined in Table 4-3, travel time for Overnight Visitors and Local Residents is calculated assuming an origin of downtown San Diego, since it acts as an appropriate population and tourism center of the region. Travel times for Day-trip Visitors, as shown in Table 4-4, were derived by calculating and averaging travel time differentials from the four major sources of day-trip visitation to the region: Los Angeles, Orange County, Tijuana, and Downtown San Diego.
Table 4-7 shows the estimated average travel time reductions for the various tourist categories and the corresponding attraction visitation loss prevention. At a travel time elasticity of 1.0, visitation loss prevention levels are identical to travel time reduction levels, and as such, most attractions will avoid a visitation reduction in the range of 9 to 22% as a result of the NCC improvements under the NCC Build Scenario.
Table 4-7: Travel Time Savings and Visitation Loss Prevention by Tourist Category
Source: Parsons Brinckerhoff.
| Overnight Visitors Travel Time Reduction | Overnight Visitors Visitation Loss Prevention | Daytrip Visitors Travel Time Reduction | Daytrip Visitors Visitation Loss Prevention | Local Residents Travel Time Reduction | Local Residents Visitation Loss Prevention | |
|---|---|---|---|---|---|---|
| State Beaches | ||||||
| Torrey Pines SB | 16% | 16% | 8% | 8% | 16% | 16% |
| San Elijo SB | 18% | 18% | 9% | 9% | 18% | 18% |
| Cardiff SB | 16% | 16% | 8% | 8% | 16% | 16% |
| Carlsbad SB | 20% | 20% | 9% | 9% | 20% | 20% |
| South Carlsbad SB | 19% | 19% | 8% | 8% | 19% | 19% |
| Open Beaches | ||||||
| Oceanside | 22% | 22% | 9% | 9% | 22% | 22% |
| Carlsbad | 20% | 20% | 8% | 8% | 20% | 20% |
| Encinitas | 19% | 19% | 9% | 9% | 19% | 19% |
| Del Mar/Solana | 17% | 17% | 9% | 9% | 17% | 17% |
| San Diego/La Jolla | 9% | 9% | 8% | 8% | 9% | 9% |
| San Diego County Fair | 12% | 12% | 7% | 7% | 12% | 12% |
| Del Mar Racetrack | 12% | 12% | 7% | 7% | 12% | 12% |
| Legoland | 19% | 19% | 8% | 8% | 19% | 19% |
Table 4-8 applies these visitation loss prevention estimates to total visitation numbers to calculate the total number of visitors by category that would be lost under a No-Build scenario. The NCC would lose an estimated 2.87 million visitors annually under a scenario where no improvements occur in the corridor. Of this, the coastal beaches would lose approximately 2.37 million visitors, while the remaining 494,000 loss of visits would occur at the corridor's site-based attractions.
Table 4-8: Total Visitation Loss Prevention
Source: Parsons Brinckerhoff.
| Total Visitation Loss Prevention | Overnight Visitors Current Visitation |
Overnight Visitors Loss Prevention |
Daytrip Visitors Current Visitation |
Daytrip Visitors Loss Prevention |
Local Residents Current Visitation |
Local Residents Loss Prevention |
|
|---|---|---|---|---|---|---|---|
| State Beaches | 1,169,139 | ||||||
| Torrey Pines SB | 270,703 | 292,500 | 45,942 | 487,500 | 40,995 | 1,170,000 | 183,767 |
| San Elijo SB | 188,439 | 181,500 | 32,395 | 302,500 | 26,465 | 726,000 | 129,579 |
| Cardiff SB | 264,879 | 277,500 | 45,402 | 462,500 | 37,870 | 1,110,000 | 181,607 |
| Carlsbad SB | 246,911 | 213,000 | 43,326 | 355,000 | 30,283 | 852,000 | 173,303 |
| South Carlsbad SB | 198,207 | 178,500 | 34,730 | 297,500 | 24,560 | 714,000 | 138,918 |
| Open Beaches | 1,202,691 | ||||||
| Oceanside | 292,792 | 236,100 | 51,504 | 393,500 | 35,270 | 944,400 | 206,018 |
| Carlsbad | 272,863 | 236,100 | 48,024 | 393,500 | 32,741 | 944,400 | 192,098 |
| Encinitas | 262,866 | 236,100 | 45,445 | 393,500 | 35,640 | 944,400 | 181,780 |
| Del Mar/Solana | 241,839 | 236,100 | 41,204 | 393,500 | 35,821 | 944,400 | 164,814 |
| San Diego/La Jolla | 132,331 | 236,100 | 20,331 | 393,500 | 30,677 | 944,400 | 81,323 |
| San Diego County Fair | 168,166 | 76,000 | 8,953 | 228,000 | 15,970 | 1,216,000 | 143,244 |
| Del Mar Racetrack | 71,913 | 32,500 | 3,828 | 97,500 | 6,829 | 520,000 | 61,256 |
| Legoland | 254,380 | 510,000 | 94,717 | 595,000 | 49,160 | 595,000 | 110,503 |
| Total | 2,866,290 | 515,800 | 402,281 | 1,948,209 |
Table 4-9 monetizes these visitation losses by estimating the total tourist expenditures that would be lost under a No-Build scenario, both for beach-based and site-based visits. The value of a beach day for the region is estimated to be approximately $22 a day,48 which results in a total of $52.6 million in beach-related expenditures saved annually. For site-based expenditures, relevant categories49 from average daily expenditures for leisure travelers (see Table 4-5) were applied and totals $52 per travel day per visitor to the region. Based on the nature of the site-based attractions, it is assumed an average of 4 hours would be spent by visitors at these attractions and the surrounding area, constituting a third of a travel day spent in the NCC. This would equal approximately $17 per-visitor expenditures at the attraction and surrounding area, which results in a total of $8.6 million in site-based expenditures saved. In total, visitor expenditures saved as a result of visitation loss prevention from the NCC project would total approximately $61.2 million annually.
Table 4-9: Total Annual Visitor Expenditures Retained Under A Build Scenario
Sources: The Fiscal Impact of Beaches in California, Philip King, San Francisco State University, September 1999; San Diego Tourism Authority; Parsons Brinckerhoff.
| Beach-Related Expenditures Saved | |
|---|---|
| Value of a Beach Day | $22.17 |
| Beach Visitation Loss Prevention | 2,371,830 |
| Total Beach-Related Expenditures Saved | $52,583,471 |
| Site-Based Expenditures Saved Average Per-Day Expenditures for Leisure Visitors by Relevant Category |
|
| F&B, Dining | $19 |
| Shopping | $14 |
| Attractions, Entertainment | $10 |
| Transportation (Car Rental, Taxis, Gasoline) | $5 |
| Other | $5 |
| Daily Per-Visitor Expenditures | $52.25 |
| Average Hours in Travel Day | 12 |
| Average Hours Spent at Attraction in NCC | 4 |
| Daily Per-Visitor Expenditures at Attraction in NCC | $17.42 |
| Site-Based Visitation Loss Prevention | 494,460 |
| Site-Based Expenditures Saved | $8,611,845 |
| Total Visitor Expenditures Retained | $61,195,316 |
4.3.2 Hotel Market
NCC plays an important role in the overall regional hotel market. Lodging in the NCC attracts tourists wanting to be near coastal beaches and amenities, as well as visitors who have specific trip purposes in the corridor cities (either business or personal). With improved accessibility under a Build Scenario, the hotel market in the project area would appeal to a broader range of regional tourists who may plan on visiting a variety of locations across the region. This section estimates the additional revenues that would occur with project implementation.
The existing hotel market in the area is strong as compared to the wider market area, as indicated in Table 4-10. There are currently approximately 9,120 rooms in the NCC, constituting approximately 16% of all available rooms in the region. In 2012, average occupancy rates of 66% were slightly less than the regionwide average of 71%. However, as a result of coastal proximity, average daily rates (ADR) in the area in 2012 were approximately 10% higher than the region as a whole. As a result of these higher ADRs, the RevPAR50 for the area, at $94.38, was approximately 3% higher than the wider region, which was $91.91.
Table 4-10: Hotel Market, San Diego County (Region) vs. North Coast Corridor (2012)
Sources: Smith Travel Research; San Diego Tourism Authority; Parsons Brinckerhoff.
| Geography | Room Supply | Available Room Nights | Average Occupancy | Average Daily Rate (ADR) | RevPAR |
|---|---|---|---|---|---|
| San Diego County | 58,027 | 21,179,917 | 70.7% | $130.02 | $91.92 |
| North Coast Corridor | 9,119 | 3,328,435 | 66.1% | $142.78 | $94.38 |
With access improvements to and from the coastal areas adjacent to I-5 resulting from the NCC project, the overnight lodging and hotel establishments in the NCC would see an increase in interest from both tourist and business travelers visiting the NCC and other regional attractions. This would result in an associated increase in both the average daily rates that NCC hotels would charge and the occupancy rates for these hotels.
For this analysis, a conservative estimate of a 1% increase in occupancy rates and average daily rates (over and above natural growth) is applied to estimate the post-project hotel-related impacts. While minimal research exists related to the direct hotel market impacts of an area that experiences accessibility improvements, the 1% increase are applied due to its conservative nature and the fact that it is at a similar level of the other impacts estimated in the rest of this analysis. To account for potential variabilities, the addendum of this chapter includes a sensitivity analysis with impact ranges from a low of 0.5% to a high of 1.5%. Applying a 2% natural growth rate through to 2040, the No-Build Scenario RevPAR in 2040 would be $163.79. Applying the estimated occupancy and rate range increases over and above natural growth, as shown in Table 4-11, it is assumed that the Build Scenario RevPAR in 2040 would be $167.08. The 0.7 percentage point increase in absolute occupancy rates would constitute a net increase of approximately 22,000 room nights in the area. Based on the RevPAR differentials between a Build and No-Build Scenario, the post-project impact would be approximately $11 million in 2040 dollars or approximately $6.5 million in 2012 dollars.
Table 4-11: North Coast Corridor Hotel Market Impacts
Sources: Smith Travel Research; San Diego Tourism Authority; Parsons Brinckerhoff. *ADR long-term growth rate based on regional hotel market growth from 2012 to 2018 (2%).
| 2012 NCC Current Occupancy | 66.1% |
|---|---|
| 2012 NCC Current ADR | $142.78 |
| 2012 NCC Current RevPAR | $94.38 |
| 2012 ADR Natural Growth Rate* | 2.0% |
| 2040 NCC No-Build Occupancy Rate | 66.1% |
| 2040 NCC No-Build ADR | $247.79 |
| 2040 NCC No-Build RevPAR | $163.79 |
| 2040 Impact Level (above natural growth) | 1.0% |
| NCC 2040 Build Occupancy Rate | 66.8% |
| NCC 2040 Build ADR | $250.26 |
| NCC 2040 Build RevPAR | $167.08 |
| Available Room Nights | 3,328,435 |
| Annual Corridor Room Nights Increase | 22,001 |
| Annual Hotel Revenue Increase (in 2040 $) | $10,957,616 |
| Annual Hotel Revenue Increase (in 2012 $) | $6,469,026 |
While the increase in occupancy rates in the NCC would directly benefit hotels in increased revenues, it would also benefit businesses and retailers in the project area as the additional visitors staying overnight would spend tourist dollars within the NCC. Table 4-12 calculates the estimated increase in visitor expenditures in the NCC as a result of additional overnight travelers, using the relevant categories for average daily visitor expenditures outlined in Table 4-5. Average per-day non-hotel expenditures from overnight visitors within relevant expenditure categories51 total $68. These expenditures would occur throughout the region, both within and outside the NCC, and for this analysis, it is assumed that 30% of these expenditures would occur directly within the NCC while the remaining 70% would occur in the rest of the region (e.g. downtown San Diego). Due to the proximity to coastal recreational activities, it is assumed that approximately 80% of these visitors would be leisure travelers (tourists), while the remaining 20% would be business travelers (compared to a 71% leisure/29% business split within the region overall). Applying the average party size for the different traveler types yields the total increased visitation to the area, which would be approximately 48,000 visitors annually, with an associated visitation expenditure of approximately $3.4 million.
Table 4-12: North Coast Corridor Visitation Revenue Impacts
Sources: Smith Travel Research; San Diego Tourism Authority; Parsons Brinckerhoff.
| Average Per-Day Expenditures for Overnight Visitors | |
|---|---|
| F&B, Dining | $25 |
| Shopping | $19 |
| Transportation (Car Rental, Taxis, Gasoline) | $11 |
| Exhibitor and Association Spending | $7 |
| Other | $6 |
| Proportion of Expenditures in Project Area | 30% |
| Daily Per-Visitor Expenditures in Project Area | $20 |
| Characteristics by Traveler Type | |
| Average Length of Stay (in days) | |
| Leisure | 3.5 |
| Business | 3.0 |
| Purpose of Stay Proportion | |
| Leisure | 80% |
| Business | 20% |
| Average Party Size | |
| Leisure | 2.4 |
| Business | 1.4 |
| Total Increased Visitation to Project Area | |
| Leisure | 42,242 |
| Business | 6,160 |
| Annual Corridor Visitation Increase | 48,402 |
| Annual Visitation Expenditures Increase | $3,403,055 |
4.3.3 Wider Regional Visitation
While the proposed project improvements would provide direct tourism-related benefits to the NCC, there would also be economic benefits at a broader, regional level due to the role of I-5 as a vital link and connector within Southern California. As travel conditions improve in the NCC, there would be an associated increase in visitation to the entire San Diego region due to improved pass-through travel times. This section estimates the direct economic benefits as a result of this increased regional visitation.
While the preceding "Attraction Visitation" section outlined the direct impacts for sites and attractions within the corridor, this section estimates what the direct impacts for the wider region would be as a result of congestion reduction and travel time savings in the NCC. Overnight visitors spend an average of three days in the region,52 and because travel time comprises a small proportion of their entire trip time compared to day-trip visitors, overnight visitors are less sensitive to travel time improvements than day-trip visitors. Therefore, it is assumed that pass-through related visitation impacts would affect only day-trip visitation and no overnight visitation. As such, this section focuses on day-trip visitation impacts as a result of the project.
Table 4-13 calculates pass-through travel time savings to Downtown San Diego from the two largest sources of day-trip visitation utilizing the I-5 stretch of the NCC, Los Angeles and Orange Counties (using the cities of Los Angeles and Orange as representative geographical points within the Counties). The analysis then uses an average of these two travel time reductions to estimate approximate visitation impacts. Day-trip visitors from Los Angeles would see a 7% reduction in their roundtrip travel times, while day-trip visitors from Orange would see a 9% reduction in their roundtrip travel times under a No-Build scenario, for an average of 8%. Using a tourist-based travel time elasticity of 1.0, as outlined earlier, day-trip visitation is estimated to be impacted by approximately 8%.
Table 4-13: Travel Time Savings and Visitation Impacts for Day-trip Tourists
Sources: Caltrans; SANDAG; Parsons Brinckerhoff.
| NCC Length (in miles) | 26 | miles |
|---|---|---|
| To/From Los Angeles | ||
| One-Way Length | 120 | miles |
| Current One-Way Travel Time | 116 | minutes |
| Current Roundtrip Travel Time | 232 | minutes |
| Proportion of trip along NCC | 22% | |
| Average Reduction in NCC Travel Time | 31% | |
| Travel Time Reduction | 8 | minutes |
| Build One-Way Travel Time | 108 | minutes |
| Build Roundtrip Travel Time | 216 | minutes |
| Proportional Reduction in Travel Time | 7% | |
| To/From Orange | ||
| One-Way Length | 91 | miles |
| Current One-Way Travel Time | 87 | minutes |
| Current Roundtrip Travel Time | 174 | minutes |
| Proportion of trip along NCC | 29% | |
| Average Reduction in NCC Travel Time | 31% | |
| Travel Time Reduction | 8 | minutes |
| Build One-Way Travel Time | 79 | minutes |
| Build Roundtrip Travel Time | 159 | minutes |
| Proportional Reduction in Travel Time | 9% | |
| Average Reduction in Travel Time | 8% | |
| Travel Time Elasticity for Tourists | 1 | |
| Visitation Impact | 8% |
Table 4-14 applies the estimated day-trip visitation impacts from Table 4-13 to day-trip visitors using I-5 to calculate net economic impacts. In 2012, day visitors totaled approximately 16.1 million, 3.9 million of which were from Mexico. Due to the geographical layout of the surrounding population base, with heavy population densities along the coast to the north of San Diego County, it is assumed that the vast majority of the remaining 12.2 million day-trip visitors originate in the Los Angeles Metropolitan Statistical Area (which includes Orange County) to the north of the NCC. As such, the analysis applies an assumption that 80% of the remaining day-trip visitors would be from the LA MSA and would use the NCC to visit San Diego. This equals approximately 9.8 million day-trip visitors utilizing the NCC. Applying the visitation impact of 0.8% means that day-trip visitation loss prevention equals almost 52,000 visits. Applying the per day visitor expenditures for relevant categories from Table 4-5 results in a $52 daily per-visitor expenditure and an annual regional visitation value of approximately $39.7 million (in prevention loss) as a result of the NCC project improvements.
Table 4-14: Regional Visitation Impacts
Sources: San Diego Tourism Authority; Parsons Brinckerhoff.
| Total Day Visitors | 16,129,000 |
|---|---|
| Mexican Day Visitors | 3,910,000 |
| Remaining Visitors | 12,219,000 |
| Proportion arriving from LA MSA via I-5 | 80% |
| Total LA MSA Visitors | 9,775,200 |
| Visitation Impact | 8% |
| Daytrip Visitation Increase | 759,819 |
| Average Per-Day Expenditures for Leisure Visitors | |
| F&B, Dining | $19 |
| Shopping | $14 |
| Attractions, Entertainment | $10 |
| Transportation (Car Rental, Taxis, Gasoline) | $5 |
| Other | $5 |
| Daily Per-Visitor Expenditures in Project Area | $52 |
| Annual Visitation Expenditures Increase | $39,700,530 |
4.4 Economic Benefits
The preceding section outlining the various tourism-related impacts of the proposed project improvements to the NCC under Build Scenarios indicates that:
- In terms of attraction visitation, the net economic benefit would total approximately $61.2 million.
- In terms of hotel and accommodations, the net economic benefit would total approximately $9.9 million.
- In terms of increased regional visitation from day-trip travelers, the net economic benefit would total approximately $39.7 million.
Collectively, the total economic benefits of these impacts would be $110.8 million. Table 4-15 outlines the associated multiplier impacts (both indirect and induced). A total of 1,145 direct jobs, and 504 indirect and induced jobs, would be created as a result of the tourism benefits of the proposed project. These jobs would result in approximately $70.4 million in total wages annually. GRP would total $113.5 million. The $110.8 in direct economic impact would yield an additional $70.6 million in indirect and induced impacts, for a net economic impact of $181.4 million.
Table 4-15: Summary Of Annual Economic Impacts From Improved Accessibility To Tourism (In 2012 $)
Source: IMPLAN, Parsons Brinckerhoff.
| Direct Impacts | 1,145 | $42.4 | $67.7 | $110.8 |
|---|---|---|---|---|
| Indirect Impacts | 242 | $14.6 | $22.4 | $34.9 |
| Induced Impacts | 262 | $13.4 | $23.4 | $35.7 |
| Total Economic Impacts | 1,648 | $70.4 | $113.5 | $181.4 |
4.4.1 Addendum: Sensitivity Analysis
In order to account for the potential variability in long-term regional economic dynamics, this addendum provides a sensitivity test as it relates to key assumptions within this tourism impact analysis, including travel time elasticities and hotel impact levels, and its associated impact on the total economic benefits of the project.53
Travel Time Elasticity
The preceding baseline analysis assumes a travel time elasticity of 1.0, meaning that a 10% reduction in travel times results in a 10% increase in traffic volumes. Table 4-16 shows total economic impacts for a +/- 25% variation in this assumption: with economic benefits shown under scenarios of 0.75 and 1.25. Applying a travel time elasticity of 0.75, whereby a 10% reduction in travel times results in a 7.5% increase in traffic volumes, total economic impacts would be $140 million. Applying a travel time elasticity of 1.25, whereby a 10% reduction in travel times results in a 12.5% increase in traffic volumes, total economic impacts would be $222.6 million.
Hotel Impacts
The preceding baseline analysis assumes a hotel impact level of 1.0% as a result of the project on both occupancy rates and average daily rates, over and beyond natural growth levels. Table 4-16 shows total economic impacts for a +/- 50 basis points variation in this assumption; with economic benefits shown under scenarios of 0.5% and 1.5%. Applying a 0.5% impact, whereby occupancy rates and average daily rates would be positively impacted by 0.5% (above natural growth), total economic impacts would be $173.2 million. Applying a 1.5% impact, whereby occupancy rates and average daily rates would be positively impacted by 1.5% (above natural growth), total economic impacts would be $189.4 million.
Table 4-16: Sensitivity Analysis – Economic Impacts (In 2012 $)
Source: Parsons Brinckerhoff.
| Jobs | Wages (in millions) | GRP (in millions) | Output (in millions) | |
|---|---|---|---|---|
| Travel Time Elasticity | ||||
| 0.75 | ||||
| Direct Impacts | 884 | $32.8 | $52.3 | $85.5 |
| Indirect Impacts | 187 | $11.3 | $17.3 | $26.9 |
| Induced Impacts | 203 | $10.3 | $18 | $27.6 |
| Total Economic Impacts | 1,274 | $54.4 | $87.7 | $140.0 |
| 1.25 | ||||
| Direct Impacts | 1,405 | $52.1 | $83.1 | $136.0 |
| Indirect Impacts | 297 | $17.9 | $27.5 | $42.8 |
| Induced Impacts | 322 | $16.4 | $28.7 | $43.8 |
| Total Economic Impacts | 2,024 | $86.4 | $139.4 | $222.6 |
| Hotel Impacts | ||||
| 0.50% | ||||
| Direct Impacts | 1,094 | $40.5 | $64.7 | $105.8 |
| Indirect Impacts | 231 | $13.9 | $21.4 | $33.3 |
| Induced Impacts | 251 | $12.8 | $22.3 | $34.1 |
| Total Economic Impacts | 1,576 | $67.2 | $108.4 | $173.2 |
| 1.50% | ||||
| Direct Impacts | 1,196 | $44.3 | $70.7 | $115.7 |
| Indirect Impacts | 252 | $15.2 | $23.4 | $36.4 |
| Induced Impacts | 274 | $14.0 | $24.4 | $37.3 |
| Total Economic Impacts | 1,722 | $73.5 | $118.6 | $189.4 |
5.0 Wider Regional Economic Impact Case Studies: Applicability to NCC
5.1 Purpose and Approach
Large-scale transportation investments that reduce congestion and improve regionwide accessibility, such as the NCC project, can have wider regional economic impacts that go beyond the direct benefits to a specific industry or group of users, or specific local areas. To complement the preceding sections that focused on freight and tourism-related impacts of the NCC project, this section acts as a benchmarking exercise by first reviewing case studies from the transportation literature of similar transportation projects elsewhere and second, inferring, at a high level, what the overall economic impacts of the improvements could be on San Diego's regional competitiveness and economic development. This comparative approach draws on studies of economic changes that have occurred in other similar regions and corridors following the implementation of a major highway corridor improvement. Other studies from economic literature are also reviewed to supplement and strengthen the findings from the case studies.
Impacts on overall employment, population, income, development, and several other economic metrics are scanned across the case studies, and NCC economic impacts are postulated based on assumptions that observed impacts in other areas could apply to future outcomes in the SANDAG region with the I-5 improvements in place and with the corresponding mobility benefits realized. Average case study outcomes, expressed in broad ranges, are proposed in the sections below and a range of possible wider economic effects in the San Diego region from the NCC project are hypothesized. To apply findings from the literature to the San Diego region, average impacts from the case studies will be scaled up or down based on comparisons of the size of the case study projects relative to the NCC project, their transportation effects relative to regional transportation measures, and regional socioeconomic differences.
The conclusions from the process outlined above may be regarded as illustrative within a wide range of possible outcomes, but much more intensive research and economic modeling would be needed to arrive at more precise and robust estimates. A critical caveat in presenting the case study examples and their associated post-project impacts relates to methodological limitations found in these and most post-project case studies–i.e., that the observed economic impacts do not fully "weed out" (i.e., control for) the myriad of other factors in addition to transportation improvements that correlate with economic growth in a region. Indeed, it cannot be assumed that observed post-project regional economic growth was necessarily a direct, or completely a result of, the transportation investment. Instead, it is more realistic to assume that corridor transportation projects played an instrumental role in helping to guide growth and expansion, and removed barriers to growth that typically arise when congestion and inaccessibility are present. For the NCC, the observed impacts in these examples provide support to the argument that there are broad transformative benefits that could occur with the proposed improvements when the estimated accessibility benefits are realized. Other caveats are also highlighted at the conclusion of this chapter when the findings are discussed.
5.2 Case Studies
In selecting case studies, the focus was on similar project types with similar stated improvement goals and in cities of a similar size and a diversified economic base. As such, the I-15 Reconstruction Project in Salt Lake City and the I-394 Upgrading Project in Minneapolis were selected for further study. While many other areas have seen large scale transportation corridor investment programs, these two cases were the only ones identified in which regions were comparable to San Diego, and (equally important) where actual empirical pre and post-investment economic outcomes were examined and compared.
5.2.1 Interstate 15 (I-15) Reconstruction Project in Salt Lake City
The I-15 Reconstruction Project in the metropolitan Salt Lake City region was selected as a case study as it demonstrates a number of similarities to the NCC project context. It involved a highway project within a large and growing metropolitan area of a similar size to San Diego, the region showed the same diversified economy as San Diego including significant tourist and recreation sectors. In addition, the project–like the NCC projected–focused on congestion and accessibility issues, and the corridor had a larger regional significance than the local project area. The corridor is also a significant freight route.
Project Context and Scope
The I-15 Reconstruction Project was the rebuilding and widening project of a deteriorating and congested 17-mile urban stretch of I-15 that runs through Salt Lake County, from Salt Lake City to the city of Sandy (as shown in Figure 5-1), to improve physical conditions, reduce congestion, and increasing travel speeds. Traversing north-south across Utah, I-15 is a major corridor for North American commerce, since it is officially chartered as a NAFTA long-haul route, linking Mexico's Baja Peninsula to the Canadian Prairies through the Western region of the United States. It is also a major corridor for the state's business and personal travel. Seventy-five percent of Utah's population lives in counties where the I-15 is the primary Interstate Highway. I-15 provides key connectivity to the region's highway network, intersecting with I-80 and I-215, as well as Salt Lake City International Airport and railroad lines providing both freight and passenger services.
While major renovations and repairs were not expected until years later, the rapid population growth both from in-migration and high birth rates had led to significant highway usage, which expedited the physical deterioration and the useful life of this 17-mile highway stretch and created congestion and bottlenecks along the corridor. At a strategic level, the local political and business community recognized that transportation was a key economic-related issue for the region and that congestion and accessibility issues on this corridor could be a major barrier to regional economic development. Due to its regional significance and myriad of benefits, the project had been a part of the regional long-range transportation plan for a number of years but was fast-tracked once the city was selected to host the 2002 Winter Olympics, with the goal of project completion prior to the event, with the anticipated visitation influx and the associated increase in highway usage making the project a priority.
The scope of the construction project along the highway stretch included widening capacity from three to five lanes, the addition of an HOV lane, and rebuilding bridges, interchanges, over-crossings, and under-crossings. The construction, with its accelerated schedule, occurred between 1996 and 2001 and came to a total cost of just under $2 billion.
In the end, the improvements resulted in an increase in peak-hour freeway speeds of 20% and a decrease in freeway delays, traffic signal stops, and intersection delays of 36%, 15%, and 27%, respectively. Based on the SANDAG/Caltrans Series 11 Micro-Simulation Model for the NCC project, these outcomes are a roughly similar level to the anticipated shifts under a Build Scenario for the NCC improvement project.
The re-construction of I-15 significantly reduced congestion, increased capacity, and improved safety, which is believed to have had a strong impact on the economic development and growth of Salt Lake County, particularly areas adjacent to the project corridor.
From a land-use perspective, the project led to shifts in commercial real estate development patterns. Subsequent to project completion, the distribution, manufacturing, and warehousing industry sectors expanded rapidly along the corridor and the west side of Salt Lake City, adding more than 58 million square feet of industrial and warehouse space and 12 million square feet of office space. Approximately half the firms in the industrial and warehousing sector currently along the corridor moved in subsequent to project completion. The City of Sandy benefited considerably from the project, with a number of firms in the city has indicated that I-15 accessibility played a factor in the site selection process. Business support of the I-15 corridor is high, with a local sales tax proposition dedicated to additional transit and road renovations along the corridor passing with significant support. In terms of user benefits, travel time savings associated with the project improvements have been estimated to be valued at $100 million annually.
At the county level, the project provided critical infrastructure-based support to broad economic growth throughout the region. In comparing conditions pre- and post-project (1995 vs. 2006), the county saw a 10% increase in tax revenue, an 18% increase in population, a 29% increase in jobs, a 41% increase in property values, and an 80% increase in business sales. Key regional industry sectors, such as construction, warehousing, pharmaceutical, life sciences, software, and recreation, continuously grew after project completion. As a result, the county has shown consistently lower unemployment rates than the state and national average.
Using the increase in business sales, the 10-year growth rate over the observed period was about 6% per year.54 That is about 1% higher than the national growth rate over that period. While these economic changes cannot be fully attributed to the project, the transportation investment did remove infrastructure-based barriers to growth and was one factor in a period of economic growth and expansion in the region.
Table 5-1: Post-Project Economic Indicator Changes, Salt Lake County
Source: US Strategic Highway Research Program (SHRP) T-PICS database.
| Metric | Pre-Project | Post-Project | % Change |
|---|---|---|---|
| Personal Income | $29,088 | $37,326 | 28% |
| Jobs | 562,008 | 726,438 | 29% |
| Population | 836,008 | 990,505 | 18% |
| Property Value | $191,654 | $270,689 | 41% |
| Business Sales (in millions) | $58,374 | $105,470 | 81% |
| Tax Revenue (in millions) | $193 | $213 | 10% |
A more focused modeling analysis by the same research team engaged by SHRP sought to isolate only the marginal effects of the transportation project. That assessment concluded that from an employment perspective, the project resulted in a significant direct increase in jobs. The analysis estimated total net new jobs as a direct result of the reconstruction project to be 7,500.
5.2.2 Interstate 394 (I-394) Upgrading Project in Minneapolis
The I-394 Reconstruction Project in the metropolitan Minneapolis region was selected as a case study as it demonstrates a number of similarities to the NCC project background. It involved a highway project within a large and growing metropolitan area of a similar size to San Diego, the region showed a similarly diversified economy as San Diego, the project focused on congestion and accessibility issues, and the corridor connected high-income, high-growth suburbs to the city core.
Project Context and Scope
The I-394 project was the upgrading of an eight-mile section of US Highway 12, from downtown Minneapolis to its junction with I-494 in Minnetonka, to interstate standards. This route traversed through the western suburbs of the Minneapolis-Saint Paul metropolitan area and was later designated as Interstate 394 after project completion.

The regional significance of the project was that it connected downtown Minneapolis with the established older suburban communities of St. Louis Park and Golden Valley, along with growing outer suburbs, including Minnetoka, a fast-growing, high-income community. The route serves as the most direct link between the Minneapolis Central Business District and the west side of the region. These suburban communities accounted for approximately a tenth of the county population, and their median household incomes were considerably higher than local and state medians. The corridor also served as the site of a number of economically-significant corporations, including General Mills, Honeywell, Pentair, Cargill, and United Healthcare. As travel demand models projected considerable growth in these suburbs, MnDOT prioritized the project in order to accommodate this growth. Although project approval was received in the late 1960s, funding constraints pushed initial construction to 1985 and was concluded by 1993, at a total cost of approximately $300 million.
The project aimed to increase travel speeds and reduce congestion by reducing Highway 12's 31 access points–inclusive of 18 intersections, 6 interchanges, and 7 slip ramps–to just 10 interchanges with existing north-south routes. The project also included HOV lanes, which were later converted to HOT lanes. In the end, highway capacity significantly increased, which absorbed much of the projected traffic growth; land use along the corridor intensified, as older low-density residential and retail uses were redeveloped for more intensive service and office uses; and safety conditions improved considerably.
Post-Project Impacts
As a result of the project, additional traffic volume was accommodated, peak period travel speeds increased and safety improved. Between 1980 and 2000, the highway was able to absorb a significant increase in daily traffic volumes, from 50,000 to 133,000, without any impacts on congestion levels. The significant traffic growth was a result of a number of factors, including the considerable growth of the western suburbs due to rapid residential and commercial development (supported by the I-394 project), and the shifting of traffic from parallel roadways. The diversion of traffic from city streets into I-394 enhanced the surrounding communities from a quality-of-life perspective due to decreased road traffic. In terms of travel speeds, by 2000 average speed levels were between 2 and 25 miles per hour higher than in 1980. For the entire project corridor, travel time savings were approximately 3.3 minutes per trip eastbound in the AM peak and 2.1 minutes per trip westbound in the PM peak. From a safety perspective, the highway enhancements have decreased accidents along the I-394 by 40% as compared to pre-project Hwy-12, despite the nearly tripling in traffic volumes. With improved Interstate-type standards, the freeway was able to handle the increase in traffic volume and speeds without any impact on the Level of Service.55
From a regional perspective (see table below), very significant growth occurred following the project. Over an approximately 10-year period following the project's opening (1993), employment increased by nearly 50%. As in the I-15 case study, major post-project regional economic growth was observed, with employment growing by about 4% per year.
Table 5-2: Post-Project Economic Indicator Changes, Hennepin County
Source: US Strategic Highway Research Program.
| Metric | Pre-Project | Post-Project | % Change |
|---|---|---|---|
| Personal Income | $34,263 | $53,822 | 57% |
| Jobs | 726,794 | 1,057,730 | 46% |
| Population | 944,339 | 1,118,380 | 18% |
| Business Sales (in millions) | $16,609 | $19,606 | 18% |
At the corridor level, I-394 was able to spur real estate investment and alter development patterns. Prior to the project, the corridor was marked by vacant parcels, intersection congestion, and sprawling, low-density developments. Vacant parcels made up more than a quarter of the corridor area, and low-density, single-family residential made up a fifth of the corridor. Retail uses generally focused on the strip or big-box format, automobile dealerships, and gas stations. By 2000, seven years after project completion, land use patterns had changed dramatically. Vacant land was down to 11% of the corridor, and denser residential typologies were developed. Commercial uses expanded along the corridor, making up 40% of the corridor, and shifted from drive-by retail to more service and production-oriented uses, including destination retail, industrial and office development. As a result of these more employment-dense uses, the number of jobs along the corridor increased by approximately 9,400 jobs, a 30% increase over pre-project levels, far higher than the employment growth rate at the wider county level. According to a MnDOT economic impact study, it is estimated that 1,900 of these jobs were directly attributable to the construction of I-394. Multi-tenant commercial properties increased, and both business turnover and space vacancies decreased. Land values along the corridor also increased - by approximately 50% between 1980 and 2000 (in real, inflation-adjusted dollars).
5.3 Other Relevant Literature
The general literature relating transportation investment, congestion reduction and regional accessibility improvement to wider regional economic outcomes are voluminous, and a comprehensive review of this literature is well beyond the scope of this study. A number of general surveys of the literature are available, including sizeable bibliographies provided by the FHWA on its web site, various TRB research, and studies by other organizations active in transportation research.
For purposes of this overview, recent research undertaken on behalf of the Reason Foundation by Dr. David Hartgen and several others, entitled "Gridlock and Growth: The Effect of Traffic Congestion on Regional Economic Performance" provides recent supporting evidence of wider economic impacts of congestion reduction, drawing on case studies of eight major US metropolitan regions. The eight regions selected for this study were Charlotte, Salt Lake City, Seattle, Denver, San Francisco, Detroit, Dallas, and Atlanta.
This research, which focuses on variations in economic productivity as a function of differences in accessibility for smaller areas within a region, may be viewed as well within the mainstream of research relating to wider economic impacts of transportation. Studies conducted several decades ago by Professors M. Ishaq Nadiri and Theofanis Manuneas are probably the best known and best regarded of the early studies in terms of methodological soundness and robustness of results.56 Nadiri and Manuneas traced over time the economic impacts of transportation investment at a national level, concluding a significant positive relationship between transportation investment and economic productivity and rates of return; this effect was found to have been greatest–well above returns to other investments–in the immediate Post-World War II period when highway infrastructure was relatively undeveloped; over time, as the highway network filled in, impacts on productivity and economic output declined to more normal rates of return comparable to other investments both public and private.
More recently, research by Daniel Graham and others working in the United Kingdom has focused on the impacts of agglomeration of economic activity (i.e., "effective density") on economic productivity within a region.57 Effective density is defined based on the concentration of economic activity (employees, workers, and firms), where concentration ("agglomeration") reflects access time rather than simple distance. Transportation improvements reduce travel times for some areas and thus result in increased economic interactions, resulting in higher economic productivity. The agglomeration technique for modeling economic benefits of major transportation investments is now widely in use in the U.K. and fact is specifically incorporated in national guidelines for the evaluation of transportation projects.58
"Gridlock and Growth" similarly addresses four key questions:
- How accessible are various points in urban regions?
- How will the accessibility of these points change in the future with increased congestion?
- What effect will removing congestion have on accessibility?
- How would improving accessibility affect the economic performance of the region?
To answer the last central question, the analysis statistically models the economic impacts of effective density as a function of accessibility improvements. The researchers defined accessibility as the number of jobs or residents within a given drive time from a point, measuring drive time via the available highway networks of the regions. Major destinations or "key points" considered were the central business district (CBD), major malls, large suburbs, universities, and airports. The analysis correlated the accessibility to these points with regional productivity, defined as gross regional product per worker. The researchers quantified how much current and future traffic congestion and total congestion relief would affect the economic productivity of each region.
The study found that the CBD is generally the most accessible place in each region, with typically 30 to 60% of jobs and 25 to 50% of residents within 25 minutes of downtown under observed congested conditions. Other key points have typically one-third to one-half the percentage of CBD jobs or residents within 25 minutes. It was determined that in the future, rising traffic congestion and rapid suburban growth together mean that key points in most regions will become relatively less accessible than they are now. The reduction in access is typically 1 to 10%. Removal of congestion was found to increase access to key points by 2 to 30%, allowing most regions to reverse the expected decline in access and making these key points relatively more accessible as the region grows.
Importantly, the study concluded that a 10% decrease in CBD accessibility would decrease regional productivity by about 1%, about the same, the authors note, as observed in Europe and Korea in previous studies. Solving congestion would, according to the quantitative analysis, boost gross regional economic performance by 6 to 30% if targeted at suburbs, malls, and universities, and about 4 to 10% if targeted at CBDs.
5.4 Application to NCC: Wider Regional Economic Impacts
The individual case studies and the supplementary meta-analysis by Hartgen described above provide empirical evidence that regional economic growth and higher economic productivity can accompany major accessibility improvements, realized as a result of large corridor transportation investments. Based on these studies, it is reasonable to offer the following generalizations:
- At a regional scale, economic growth can be rapid following major investment, particularly when a metropolitan region is experiencing strong background growth. Under such conditions, regional economic outcomes may be one to two percentage points higher than trend growth for the US and surrounding multi-state regions (e.g., Rocky Mountain, Upper Midwest, West, etc.) when a major transportation corridor investment with significant mobility benefits is made.
- Based on the Hartgen study, for a 10% reduction in accessibility due to congestion, regional productivity and other economic outcomes may be reduced by about 1% in the case of CDB accessibility, and more for key employment areas outside the CBD.
- At a smaller corridor scale, the economic impacts (measured by jobs or other standard economic measures) can be significant, although substantially less in absolute terms than overall regional growth possibilities. The two case studies found job growth of as much as 10,000 within a corridor attributable largely or mainly to the transportation investment. In the I-394 corridor, that growth represented about a 30% increase over pre-project levels within the corridor.
- At a smaller corridor scale, real estate development impacts can be sizeable, and for some corridors, specific sector growth can occur, particularly in warehousing and distribution where major freight corridors and distribution opportunities on a very large area scale are involved.
- To infer potential long term wider economic impacts for the San Diego region, two questions arise:
- How do the case study transportation and accessibility impacts compare to expectations for the NCC?
- In light of the first question, and based on the general conclusions from the case studies and research, how much additional employment and GDP growth might seem reasonable?
Transportation/Accessibility comparisons: Measuring accessibility is complex, and there are a number of ways that researchers have defined and measured it. The best comparisons, given the data, between the case studies and the NCC can be made based on travel speeds and vehicle hours of travel (VHT).
Considering VHT, the NCC project would increase overall corridor accessibility during peak periods of about 7%, as measured by vehicle hours of travel in 2040. This is based on a comparison of Build and No-Build scenarios VHT, utilizing data provided by SANDAG's Series11/MicroSimulation model, made available specifically for this study. Full north-to-south trip times in the corridor are expected to improve (decrease) by more–during peak periods by about 30%. Conservatively, taking these data points together, it is reasonable to assume an overall regional accessibility improvement of 5 to 10% in the NCC in 2040.
The potential range of economic growth impacts: Based on the case studies and meta-analysis, and the range of accessibility improvements anticipated from the NCC project, an increase in regional employment and GDP (over and above baseline trend) of between 0.5% and 1.0% might be achievable. This assumes that the Hartgen study findings–that a 10% improvement in regional accessibility will yield about a 1% increase in regional economic productivity and thus output–are valid. The individual case study findings suggest the potential for somewhat larger economic impacts, but because those studies do not effectively control for other economic growth factors, the lower figure of 10% is considered reasonable and conservative. Assuming this one to ten relationships between economic activity and accessibility, combined with the estimated range of 5% to 10% improvement in regional accessibility, provides the basis for the economic impact range of 0.5% to 1.0% over and above baseline (without project) regional employment.
Given the total San Diego region employment as of Aril 2013 of about 1.3 million59 and anticipating growth to 2040 of about 0.75% per year60 additional NCC project employment may be in the range of 8,000 to 16,000 jobs. This figure is comparable to the corridor level findings from the I-5 and I-394 case studies. This regional total is about 5 times the total employment estimated just from freight and tourism-related improvements.
5.5 Caveats
- Impact results are based on a small sample of case studies. A much larger sample would be needed to obtain more robust results. Presently, a large sample of research findings is not available in the literature, as there have been relatively few economic studies involving comparisons of actual pre and post-project outcomes.
- The case studies considered did not provide adequate controls for other factors influencing economic changes in metropolitan areas.
- The estimates of impact in the preceding section are illustrative; they are not the result of modeling or surveys, but rather are inferred based on comparable outcomes in other areas. No adjustments have been made to reflect structural differences between regional economies elsewhere and San Diego.
- Accessibility measures used, which reflect total corridor VHT and trip times, are at best partial measures of aggregate regional accessibility changes. A far more detailed and data-intensive process is needed to measure accessibility changes or agglomeration effects on a regional or even large corridor scale. Such analysis would require extensive data analysis and manipulation utilizing zonal level travel time and cost changes extracted from the regional travel demand model.
6.0 Conclusions
This preceding analysis presented results of an analysis estimating the total economic benefits to accrue to the San Diego region as a result of the NCC project by 2040 when the full effects of the project will be realized. Three distinct analyses were identified for inclusion in this study: benefits from improved freight mobility benefits from increased tourism visitation and expenditures, and broader regionwide economic benefits typical of large-scale transportation enhancements. This analysis demonstrated that economic benefits from this project would be significant, both in quantifiable terms with specific benefits to freight dependent industries and the tourism sector, and in terms of broader, regional economic benefits as a result of improved mobility. A breakdown of these total benefits, both annually and cumulatively over the 30-year life of the program, is summarized in Sections 6.1 and 6.2. Highlights of the compelling conclusions from this economic analysis are presented in Section 6.3.
6.1 Summary of Annual Economic Benefits
As shown in Table 6-1, the annual economic impacts to the region from the NCC transportation improvements would be substantial. They include both direct and indirect benefits resulting from multiple factors including travel time savings, inventory savings, prevention of visitation loss, and an overall boost in economic activity in the NCC and region.
Table 6-1: Summary of Annual Economic Impacts (In 2012 $)
Source: Parsons Brinckerhoff.
Note: Wage Earnings, GRP, and Output for the Regional Economy category are estimated based on the average ratio of each variable to employment in the freight and tourism sectors.
| Industry / Sector | Total Employment | Total Wage Earnings (millions) | Total GRP (millions) | Total Output (millions) |
|---|---|---|---|---|
| Freight | 1,951 | $110.9 | $193.3 | $280.7 |
| Tourism | 1,648 | $70.4 | $113.6 | $181.4 |
| Regional Economy | 8,000 – 16,000 | $403.0 – $806.0 | $682.2 – $1,364.4 | $1,027.2 – $2,054.3 |
These broad classes of benefits can be summarized as follows:
- Economic impacts of improved freight mobility. Regional economic benefits from freight mobility improvements in the NCC stem in large measure from transportation cost savings to firms that ship goods via truck, resulting from travel time improvements on I-5. Additional benefits will also be derived from capacity improvements to the LOSSAN rail corridor, which will permit increased rail freight throughput and help preserve rail market share. Utilizing truck travel data in the Corridor derived from the SANDAG travel demand model, combined with expected reductions in trip times for trucks in the Corridor (comparing the 2040 Build conditions with 2040 No-Build conditions), it was determined that total in-region truck transport cost savings resulting from implementing the NCC project will equal $118 million (2012 dollars) annually in 2040; inventory savings will add another $18 million to the annual benefit, for a total of $136 million in direct shipper cost savings annually. These direct cost savings will result in total economic impacts in 2040 (including multiplier effects derived from a customized input-output model) of close to 2,000 permanent jobs, corresponding household wages of $111 million, and GRP of $194 million in today's dollars. Total annual economic activity, as measured by output, would equal about $281 million in 2040.
- Economic impacts of increased tourist visitation and expenditures. Improved accessibility and reduced travel times along the NCC will have a direct positive impact on the tourism economy. The tourism impact analysis assumes that the primary quantifiable tourism-related impacts derived from the project include: an increase in total visitation to attractions within the project area, from both tourists and residents; an increase in lodging-based revenues and expenditures within the project area, as a result of increasing occupancy rates and average daily rates; and an increase in day-trip visitation (from those living outside the region) due to improved pass-through travel times along the I5 corridor. Collectively, the total direct economic benefit of these impacts would be $110.8 million annually in additional spending, of which $61.2 million would be derived from increased attraction visitation, $9.9 million would be derived from the improved hotel market, and $39.7 million would be derived from increased day-trip visitation to the region. These direct tourism expenditures will result in total economic impacts in 2040 (including multiplier effects derived from a customized input-output model) of about 1650 permanent jobs, corresponding household wages of $70 million, and GRP of $114 million in today's dollars. Total annual economic activity, as measured by output, would equal about $181 million in 2040.
- Regionwide Economic Impacts from improved mobility. Large-scale transportation investments that reduce congestion and improve regionwide accessibility, such as the NCC project, can have wider regional economic impacts that go beyond the direct benefits to a specific industry or group of users, or specific local areas. Examining individual case studies and available supplementary literature provides empirical evidence of this relationship. Based on the empirical study, and the accessibility improvements anticipated from the NCC project, an increase in regional employment and GDP (over and above baseline trend) of between 0.5% and 1.0% might be achievable, which would constitute a range of 8,000 to 16,000 jobs.61
6.2 Summary of Cumulative Economic Benefits
In addition to the annual benefits, a broader perspective can be gained by estimating cumulative economic impacts over a 30-year project investment period extending into the 2040 decade. Cumulative impacts provide a more comparable yardstick relative to total project investment costs, which occur in phases over the 30 years. Those impact estimates are shown in Table 6-2. Annual impacts were interpolated by year to reflect project phasing–that is, annual impacts in decades prior to 2040 are substantially less than the full 2040 benefit, but they increase gradually over time as NCC improvements gradually become operational.
Cumulative impacts have been discounted to present value based on a 7% real discount rate, the rate prescribed by USDOT as part of its TIGER grant guidelines for Benefit-Cost Analysis.62 (The USDOT also permits the use of a much lower 3% real discount rate for public benefits as an alternative to the 7% rate. The use of a 3% discount rate is less conservative and would yield much higher impact amounts than shown in the table.) As shown below, the cumulative differences in economic outcomes compared with the No-Build Scenario are very substantial: Total Output, the most comprehensive indicator, is expected to increase in the range of $4.8 billion to $9.7 billion above No-Build levels. Total GRP is expected to expand a range of $3.2 billion to $6.4 billion above the No-Build, with correspondingly large increases in Total Wage Earnings, a major subset of GRP.
Table 6-2: Summary Of Cumulative 30-Year Economic Impacts (Present Worth, In 2012 $)
Source: Parsons Brinckerhoff.
| Industry / Sector | Total Person-Years of Employment | Total Wage Earnings (millions) | Total GRP (millions) | Total Output (millions) |
|---|---|---|---|---|
| Freight | 1,951 | $522.0 | $909.9 | $1,321.3 |
| Tourism | 1,648 | $331.4 | $534.7 | $853.9 |
| Regional Economy | 8,000 – 16,000 | $1,897 – $3,794.1 | $3,211.3 – $6,422.6 | $4,835.3 – $9,670.6 |
6.3 Compelling Conclusions
Brief summary of compelling conclusions from this analysis.
North Coast Corridor Economic Analysis Compelling Conclusions
Implementing the planned North Coast Corridor (NCC) highway, rail and transit improvements will improve mobility and access to, through and within the corridor by:
- Decreasing travel times
- Eliminating rail bottlenecks
- Increasing trip reliability in the corridor
- Reducing highway congestion
- Increasing travel choices
- Increasing transportation capacity
Improved mobility and access in the NCC will result in substantial economic benefits to the freight and tourism industries, and the regional economy:
The NCC is a Key Corridor for the Movement of Goods within and through the Region
- 50 million tons of goods were moved through the NCC in 2010.
- These goods were valued at $44 billion.
- Over 90% of the goods moved through the NCC traveled by truck (with 10% transported by rail).
NCC Transportation Improvements will Result in Significant Cost Savings for Goods Movement
- In-region direct shipper truck cost savings are estimated to equal $136 million annually in 2040.
- Total regional economic benefit would be over $280 million a year, including direct shipper cost savings and associated multiplier effects.
The NCC is a Major Tourist Destination for Both Residents and Visitors
- Over 19 million locals and tourists visited one of the attractions in the NCC in 2012.
- The beaches were the most popular attraction in the NCC, with 15.4 million annual visitors in 2012.
- The NCC contains over 9,000 hotel rooms.
Tourism is an Economic Driver in the Region and the NCC is a Critical Link to Regional Tourist Destinations
- San Diego's regional tourism market includes a number of major, nationally significant attractions, such as the San Diego Zoo, Sea World, Midway Museum, Old Town State Park, Gaslamp District, and many more.
- Regional tourist destinations attract 32 million visitors annually who inject $8 billion of spending into the local economy, including $150 million in hotel taxes.
- Nearly 10 million visitors travel through the NCC to reach regional visitor destinations.
- The NCC transportation improvements make possible $181 million in increased visitor spending and associated multiplier effects for the region annually.
Mobility in the NCC is Important for Retaining and Growing Regional Jobs
- The San Diego tourism industry employs 160,000 workers – over 13 percent of the regional workforce.
- The freight industry (transportation and warehousing) directly employs 20,000 workers, constituting about 2 percent of the regional workforce; many more manufacturing and export businesses, employing well over 100,000 workers, rely on efficient freight transport to deliver goods to the market.
- Based on experience in other regions, the mobility and accessibility improvements resulting from the NCC project can result in 8,000 – 16,000 more jobs in the region, for all sectors of the economy.
- This employment growth constitutes 2% – 4% of the region's projected job growth through 2040.
Over the next 30 years, the Cumulative Economic Benefit Resulting from the NCC Transportation Improvements is Vital to the Region
- The cumulative economic benefit in the region due to improved freight mobility is projected to be over $1.3 billion through 2040.
- The cumulative economic benefit in the region from enhanced tourism access is projected to be over $950 million through 2040.
- The total economic benefits to all sectors of the regional economy resulting from improved accessibility and reduced congestion are projected to be between $4.8 and $9.6 billion cumulatively over the 30 years.
Notes: All dollars are in 2012 dollars unless otherwise noted. 30-year cumulative benefits are discounted to present value. Unless otherwise noted, the economic benefit is defined in all cases above as economic output, a broad measure of overall economic activity.
Appendix A – Overview of PRISM Economic Impact Model
PRISM is designed as an easy-to-use, flexible, and transparent model that can allow agents in both the public and private sectors to:
- Prioritize projects in a capital plan based on specific criteria, i.e. number of jobs created, environmental benefits, economic growth.
- Determine the feasibility and impacts of potential transportation projects or policies at local, regional, state, or national levels.
- Advance large essential infrastructure projects to the legislature and the public.
- Assist with factoring in sustainability metrics into the decision-making process.Support business planning for major project developments.
PRISM, which relies upon IMPLAN's input-output tables as its "engine," determines the effects of specified infrastructure projects on key economic indicators including employment, earnings, economic output, and value-added in a given traffic analysis zone, county, region, or state.
Regional economic models like PRISM use empirically established relationships between economic and travel-related factors to generate estimates of economic impact. They consider how changes in accessibility–measured as changes in travel time and other transport costs–affect cost efficiency and production (output) for existing industries in a region, and also capture potential improvements in worker productivity and overall labor market activity resulting from personal travel time savings. In addition, these models utilize customized input-output models to estimate how these initial increases in industry activity and income cycle through the economy in the form of more household and business spending, producing total impacts that can be several times greater than the initial cost savings.
The focus is on the long-term, permanent changes to a regional economy, as a region's producers and workers become more cost-efficient and productive due to better transportation access, and as expanded business sales and personal income recycle throughout the area's economy.
Key data inputs that would feed into PRISM include:
- Project capital, operations and maintenance, and rehabilitation costs (from capital planning).
- Changes in travel time (i.e., vehicle hours).
- Changes in vehicle miles traveled (VMT).
There are a number of other data inputs that may be required based on individual project characteristics. Key performance metrics that would be developed using PRISM include:
- Changes in short (i.e., during construction) and long term (i.e., post-construction) employment by industry.
- Short and long term changes in gross county product (or output, which is similar to gross regional product).
- Short and long term changes in value-added.
- Short and long term changes in household income.
- Short and long terms of fiscal impacts (i.e., changes in tax base).
Notes:
- SANDAG/Caltrans Series 12 Model, November 2011. See PWP/TREP Table 3A-6.
- Vehicle Occupancy Study, I-5 North Coast Special Traffic Studies, Wilson & Company, July 2008.
- I-5 NCC Corridor System Management Plan (Chapter 8), August 2010.
- Ibid.
- Ibid.
- I-5 NCC Corridor System Management Plan (Chapter 8), August 2010.
- Caltrans/SANDAG Series 12 Model, November 2011.
- I-5 NCC Technical Report #5: Traffic Demand Forecasting Report (Section 3.3), August 2007. Conducted in support of I-5 NCC Project Draft EIR/EIS.
- I-5 NCC Technical Report #6: Freeway Interchange Operations Report (Section 3.6), August 2007. Conducted in support of I-5 NCC Project Draft EIR/EIS.
- Ibid, Section 3.4.
- Caltrans/SANDAG Series 12 Model, November 2011. See PWP/TREP Table 3A-6.
- The Working Waterfront, Unified Port of San Diego.
- San Diego and Imperial Valley Gateway Study, SANDAG, March 2010.
- Ibid., p. 36.
- This assumes a truck annualization factor of 288.
- Average cargo payload value based on Commodity Flow Survey data.
- These data are consistent with the truck trip counts cited above in the freight flows section.
- In order to estimate freight value, it is necessary to convert truck VMT into an average number of truck trips, as value hauled is conceptually related to trips regardless of trip length. To accomplish this, the analysis assumed an average truck trip distance in the corridor of about 28 miles (equal to the corridor-wide distance along I-5 from north to south).
- SANDAG, San Diego Freight Rail Strategy, Proposition 1B, Trade Corridor Improvement Fund Applications.
- Quarterly Census of Employment and Wages, U.S. Bureau of Labor Statistics, 2012.
- Ibid. The measure of the relative concentration of an industry within a region is called a location quotient. Location quotients greater than 1.0 indicate that the industry is more present in the region than the U.S. as a whole. Computer and Electronics Manufacturing has a LQ of 2.38.
- Market Assessment/Fast Facts, San Diego Metropolitan Export Initiative, May 2013.
- Economic Snapshot, San Diego Regional Economic Development Corporation, July 2013.
- San Diego Metropolitan Export Initiative Market Assessment, San Diego Regional Economic Development Corporation, May 2013.
- NCHRP Report 732: Methodologies to Estimate the Economic Impacts of Disruptions to the Goods Movement System, Transportation Research Board, 2012.
- The market value of all goods and services sold in the region.
- GRP is measured in various ways, but essentially is the sum of before-tax household wage earnings and net business earnings after wage disbursements. Business earnings are distributed in various forms, like taxes, investment, retained profits, shareholder disbursements, etc.
- For information, refer to http://prism.pbworld.net.
- The IMPLAN model and associated data for the San Diego region were obtained by the consultants for this study from IMPLAN.
- Caltrans/SANDAG Series 11 Micro-Simulation Model, August 2010.
- Estimated based on $43 billion in truck cargo, reported in an earlier section, and approximately 25% of cargo by value moving through the region as "overhead" traffic, i.e., out-of-region cargo.
- Profit margins by industry vary considerably. For example, profit margins for the retail sector are around 6–7%; margins for industrials are around 8–9%. See S&P 500 Sectors and Industries Profit Margins, Yardeni Research, Inc., August 2013.
- Wages constitute a single component of total output.
- Multipliers derived within PRISM from the IMPLAN model customized for San Diego. Multipliers are applied only to increases in industrial output and to household spending; increases in business profits are assumed to have no multiplier impacts in the region but are assumed to be retained by firms for future investment or investor/shareholder returns. Multipliers include indirect effects, which reflect backward linkages to supplier businesses, and induced impacts are forward, resulting from increased household spending.
- GRP increase is measured as the increase in value-added, which is estimated by the IMPLAN model. Value added is one of several ways in which GDP/GRP can be measured.
- San Diego 2012 Fast Facts, San Diego Convention & Visitor's Bureau, 2012.
- America's Most Visited Cities, Forbes, April 28, 2010
- San Diego Tourism Authority, Planning, and Research Department.
- California Employment Development Department, 2012.
- Beach visitation counts estimated by applying NCC state beach attendance per coastal mile to the total coastal mileage in the corridor. See Table 4-6.
- This focuses on major sites and attractions where data or estimations are easily available and precludes smaller attractions or attractions in which visitation is hard to quantify (e.g. downtown areas of coastal towns). As such, this study is likely a conservative underestimate of total corridor visitation.
- Defined as the combined total annual regional visitation (32.3 million) and total regional population (3.2 million).
- Total visitation is a combination of overnight visitors (16.1 million) and day-trip visitors (16.1 million) in 2012.
- Defined as visitors traveling to San Diego from outside the region.
- Defined as residents of San Diego County.
- Mokhtarian and Chen, 2004; SACTRA, 1994; TRACE, 1999. As this project aims to maintain existing conditions by addressing projected congestion increases along the corridor, this analysis assumes that monetized impacts result from loss prevention rather than net new visitation.
- Attractions include major sites and beaches along the corridor, and exclude a number of other tourist sites with smaller visitation counts, or visitation counts that are harder to quantify (e.g. historic downtowns, retail strips, live theaters, etc.). As such, this analysis conservatively estimates the total potential impact.
- The Fiscal Impact of Beaches in California, Philip King, San Francisco State University, September 1999.
- Relevant categories include the appropriate retail categories for attraction-based visitors.
- A metric of utilization in the hotel industry, representing the average daily room revenue a hotel can generate per available room, is calculated by multiplying a hotel's average daily room rate by its occupancy rate.
- The analysis avoids double-counting spending across attraction visitation impacts and hotel visitation impacts by excluding the lodging expenditure from the attraction-based calculations, and conversely by excluding the attraction expenditure from the lodging-based calculations. The number of visitors that, under a Build Scenario, would be part of the increased hotel visitation and would be retained visitors to attractions along the corridor are assumed to spend in the relevant expenditure categories shown (F&B, shopping, etc.) for each of these economic activities (i.e. both as a hotel guest and as an attraction visitor).
- San Diego County Visitors Profile Study, San Diego Tourism Authority.
- A sensitivity test is a technique used to determine how a range of values of an assumption will impact the output of the analysis.
- Employment growth was not as rapid, reflecting a general economic trend in the U.S. in which jobs do not increase as rapidly as overall business output and GDP.
- Level of service (LOS) is a measure used by traffic engineers to determine the effectiveness of elements of transportation infrastructure. LOS is most commonly used to analyze highways by categorizing traffic flow with corresponding safe driving conditions.
- Contributions of Highway Capital to Industry and National Productivity Growth, Nadiri and Manuneas, 1996; Contribution of Highway Capital to Output and Productivity Growth in the U.S. Economy and Industries, Nadiri and Manuneas, 1998.
- Agglomeration Economies and Transport Investment, Daniel Graham, Imperial College London, Discussion Paper No. 2007-11, December 2007.
- Transport, Wider Economic Benefits, and Impacts on GDP, Department for Transport, United Kingdom, July 2005.
- Economic Snapshot, San Diego Regional Economic Development Corporation, July 2013.
- SANDAG 2050 Regional Growth Forecast.
- Impacts on the other economic metrics have not been estimated due to the lack of detailed information about which sectors would experience growth, but would be roughly proportional to the impacts observed in tourism and freight.
- The USDOT also permits the use of a much lower 3% real discount rate for public benefits as an alternative to the 7% rate. The use of a 3% discount rate is less conservative and would yield much higher impact amounts than shown in the table.