Appendix G – Transportation White Paper: The Need for a Multimodal NCC Program
Prepared for:
Caltrans
SANDAG
Prepared by:
Parsons Brinckerhoff
Dudek
January 5, 2012, Final Draft
1.0 Purpose and Summary
This white paper demonstrates the need for a multi-modal approach to address existing and projected transportation and related coastal access deficiencies in the I-5/LOSSAN North Coast Corridor (NCC) over the next 40 years. It presents a vision for the corridor in 2050, outlining the numerous enhancements planned for both transportation and coastal resources, and demonstrating that the transportation vision is consistent with the public access and recreation policies of the Coastal Act. However, this paper does not address the interim phasing of individual projects to achieve the 40-year vision, which will be presented separately.
Over the past four decades, the NCC has grown dramatically. By 2006, nearly half a million people lived in the corridor and that number is expected to grow by 23% by 2030. There will be approximately 400,000 jobs in the corridor by 2030.1 In addition, the NCC contains some of the most heavily used beaches in California and offers a wide range of coastline activities that are enjoyed by the public year-round. As a result of residential, commute, recreational, and commercial use, traffic congestion and impediments to access in the NCC are significant and growing problems for residents, visitors, and businesses alike.
SANDAG and Caltrans have prepared a draft Transportation and Resource Enhancement Program and Highway Public Works Plan (TREP/PWP) that presents a vision for the corridor that addresses the mobility and coastal access needs of those who live, work, play and do business in the NCC through an integrated, multi-modal approach. The vision balances these mobility needs with protection and enhancement of coastal resources, and it does so within the context of a larger planning framework that attempts to maximize the returns on transportation investments across the entire San Diego region.
To accommodate the growth in population and travel demand that will occur in the corridor, mobility improvements planned for the NCC rely on projects that move people–not just cars. Planned projects include rail and bus facilities and service enhancements to increase the capacity of transit, as well as the expansion of the I-5 highway to incorporate Managed Lanes for carpools, vanpools, and transit. Bike and pedestrian improvements are also planned to provide an alternative, non-vehicular modes of transportation in the corridor, which will also provide new coastal recreation opportunities and eliminate or improve existing public access barriers to the corridor's significant coastal resource areas. The result is a balanced mix of investments that recognize the importance of transit to future growth while acknowledging the many constraints that hinder its viability in the NCC.
By focusing on a high-occupancy, multi-modal program in the corridor, this essential transportation lifeline in the region will continue to serve the disparate needs of the area's travelers well into the future, ensuring ongoing access to, through and within the corridor. The incorporation of bike and pedestrian facilities and coastal resource enhancements creates a truly coordinated approach for improving mobility and access in the NCC while preserving coastal resources to the greatest extent possible.
2.0 Current and Future Travel Demand In The North Coast Corridor
2.1 Existing Transportation Facilities and Services
People travel for a variety of reasons and their trips have an even greater variety of start points (origins) and endpoints (destinations). How travelers make their trips depends on the range of transportation facilities and options. The NCC offers travelers an array of multi-modal options:
Rail
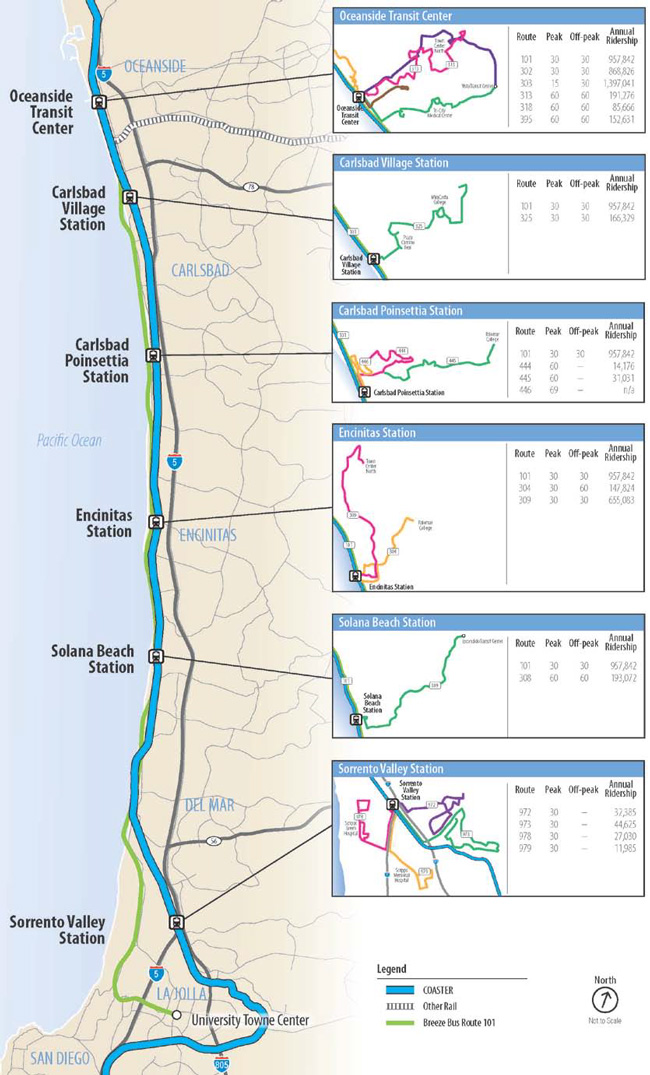
The LOSSAN rail corridor extends from San Diego on the south to San Luis Obispo on the north. It runs through six counties (San Luis Obispo, Santa Barbara, Ventura, Los Angeles, Orange, and San Diego), connecting the major metropolitan areas of Southern California, and serving some of the most populous areas of the state. The LOSSAN corridor is the second busiest intercity rail corridor in the nation. Amtrak's Pacific Surfliner service; Metrolink and COASTER commuter rail services; and Burlington Northern Santa Fe (BNSF) freight services all operate along the LOSSAN rail tracks in the NCC. The east/west SPRINTER light rail service connects with the LOSSAN corridor at the Oceanside Transit Center.
COASTER service between downtown San Diego and Oceanside is operated in both directions every 30 to 45 minutes during peak periods and less frequently during the off-peak, for a total of 22 one-way trips per day. Stations within the NCC are located at Oceanside Transit Center, Carlsbad Village, Carlsbad Poinsettia, Encinitas, Solana Beach, and Sorrento Valley. Amtrak Pacific Surfliner service between downtown San Diego and San Luis Obispo is operated with approximately 12 trips per day in each direction, with stops in Oceanside and Solana Beach in the NCC. Metrolink service connects the Oceanside Transit Center to locations in Orange, Los Angeles, and San Bernardino counties with 16 trips on weekdays. Four to eight BNSF freight trains use the corridor each day (See Appendix A: NCC Bus and Rail Service Maps).
Bus
Local bus service is provided by the North County Transit District (NCTD) in the northern and central areas of the NCC (branded "Breeze"), and by the San Diego Metropolitan Transit System (MTS) in the southern portion of the NCC. Existing all-day bus service in the corridor is local, with the NCTD
Route 101 providing service along the length of the North Coast Corridor via Coast Highway and NCTD Route 309 linking Oceanside to Encinitas via El Camino Real. As many as fifteen other local bus routes and intercity buses provide feeder service to COASTER and Amtrak stations within the corridor (See Appendix A: NCC Bus and Rail Service Maps).
Freeway
I-5 is the principal north-south auto and truck transportation corridor in the western US, extending from the US/Mexico international border to the US/Canada international border. It has been named by the U.S. Department of Transportation as one of six "Corridors of the Future" based on its essential role in interstate and international commerce.2 In Southern California, I-5 connects San Diego County with Orange County, the Los Angeles metropolitan area, and Mexico. In the NCC, I-5 currently consists of four general-purpose lanes in each direction and is used for interregional, regional and local trip making.
Local Roads
Regional arterials and state highways provide access to and within the corridor. Coast Highway and El Camino Real, the two main north-south arterials, supplement some of the local circulation provided by I5. In addition to these north-south arterials, three east-west state highways intersect I-5 and provide access to the corridor: SR-76; SR-78; and SR-56. Numerous east-west arterials also provide access to and from I-5 to the residential areas, places of employment, retail, and other destinations in the corridor. Many of these arterials, especially those parallel to I-5, have gaps due to environmental and topographic constraints resulting in a discontinuous local street network within the corridor. Capacity expansion, extensions, and gap closures are generally infeasible as a result of these constraints and existing development.
2.2 Users of the NCC Transportation Facilities
The NCC is used by a wide variety of travelers, with a range of needs that require an array of transportation solutions. A traveler's trip purpose, trip length, and origin and destination influence and often dictate the choice of travel mode. Because trip characteristics vary so widely, a multi-modal corridor provides travelers with the ability to choose the mode that best meets their travel and access needs for each trip.
Table 1 identifies the key types of travelers who use the NCC and the primary types of trips they make. The classification of trip types depends upon the distance traveled as well as the locations of each trip's origins and destinations relative to the NCC. Taking consideration of where the "ends" of the trip fall, Table 1 and Table 2 utilize the following definitions for travel that utilizes NCC facilities:
Internal Trip: Both ends of the trip in NCC (regardless of distance) o Example: An Oceanside resident taking a day trip to Carlsbad State Beach
Regional Trip: One or both ends of the trip outside NCC but within San Diego region o Example: A commuter traveling from her Encinitas home to Downtown San Diego; a Fallbrook resident using I-5 to visit relatives in Coronado
Interregional Trip: One end of the trip within San Diego region, another end outside San Diego region o Example: A family from Los Angeles visiting Legoland; a Mission Valley resident attending a business meeting in Orange County
Interregional-Through Trip: Both ends of the trip outside San Diego region o Example: Freight movement from Mexico to Los Angeles
Table 1: Typical Characteristics of NCC Travelers and Trips
Residents
Commuters
Visitors
Businesses
Interregional & Through Travelers
General Trip Purpose
Shop
School
Errands
Recreation
Work
Recreation
Tourism
Goods Movement
Multiple
General Trip Length
Short (< 5 miles)
Medium (5-30 miles)
Short (< 5 miles)
Medium (5-30 miles)
Long (> 30 miles)
Medium (5-30 miles)
Long (> 30 miles)
Medium (5-30 miles)
Long (> 30 miles)
Long (> 30 miles)
Trip Type
Internal
Regional
Interregional
Regional
Interregional
Regional
Interregional
Interregional-Through
Internal
Regional
Interregional
Interregional-Through
Interregional
Interregional-Through
Table 2 provides a breakdown of the existing and projected travel patterns of I-5 travelers in the NCC. As travel grows in the corridor, all types of trips are expected to increase in absolute terms, indicating a definite need for the NCC transportation system to accommodate new demand. In relative terms, the projections show an increasing proportion of regional and interregional trips using I-5 and a concurrent decrease in the proportion of internal trips. This reflects the growing importance of I-5 to non-local travelers; as the region grows, the corridor will serve as an increasingly vital link in the regional and interregional transportation system. In addition, the increasing prevalence of longer-distance travelers also indicates a strong opportunity for the success of Managed Lanes, which serve these longer trips best by separating them from the slower, "on-and-off" patterns of local and internal traffic.
Source: SANDAG/Caltrans Series 12 Model. Note: Not all columns add perfectly to 100% due to rounding.
2010
2035
2040
2050
Internal
38.3%
30.1%
30.7%
28.9%
Regional
41.1%
46.8%
47.0%
47.8%
Interregional
19.4%
21.2%
21.1%
22.0%
Interregional-Through
1.2%
1.2%
1.2%
1.3%
Residents
Residents in the NCC make a variety of essential and discretionary trips to shopping, run errands, go to school, and enjoy their communities' recreational opportunities. Many of their trips are short in distance and often include family members or other companions. Like most trips in the corridor, these are dominated overwhelmingly by the automobile; only 2-3 percent of all trips in the NCC are currently made by bus or rail transit.3 While local automobile trips would ideally be made on the local street network, geographic constraints significantly limit arterial routes in much of the area, meaning that many local trips often use the highway. Indeed, nearly 40 percent of the trips on I-5 have both their origin and destination within the NCC.4
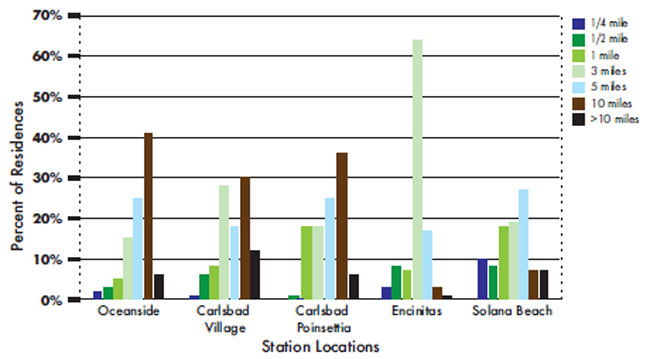
Local trip use of I-5 contributes to highway congestion and subjects both local and regional travelers to substantial delays. The planned expansion of rail service in the corridor will provide benefits to commuters and longer-distance travelers but will be unlikely to attract many new local trips since, as shown in Figure 1, more than half the residents in the corridor live farther than five miles from rail stations (and many live closer to I-5 than the rail corridor). In addition, rail service on the LOSSAN corridor is geared to the long-distance commute and interregional market, with widely spaced stations (4-5 miles apart) for faster travel to a few key employment and community destinations. Local bus service may be appropriate for some local trips, but the short length of these trips often means that driving has substantial time and access advantages over fixed-route buses–so most travelers will still choose the automobile for their local purposes.
Figure 1
- Distance of Residences from COASTER Stations. Source: I-5 North Coast Corridor System Management Plan (CSMP), Chapter 3, July 2010.
Commuters
Commuters generally travel during peak periods and frequently leave the NCC to access employment sites throughout the region. Commute trips within the corridor tend to be southbound in the morning and northbound in the evening, reflecting the employment draw to the central and southern parts of the region. As shown in Table 3, just 3% of NCC commuters use rail and bus transit services for their work trips. A much larger percentage of car/vanpool (10%) and drive alone (76%).
Table 3: Commute Trip (Home to Work) Mode Share
Source: I-5 North Coast Corridor System Management Plan (CSMP), Chapter 4, July 2010.
Area
Drive Alone
Carpool/ Vanpool
Public Transit
Other Modes
Worked at Home
North Coast Corridor
76%
10%
3%
2%
7%
California
72%
15%
5%
5%
4%
United States
76%
12%
5%
4%
3%
Key factors that lead to the high auto (and carpool) commute trip mode shares are the dispersed nature of trip origins (homes) and destinations (jobs) both inside and outside of the corridor. On the origin end of the trip, the established low-density land use pattern in the NCC fails to generate the population concentrations necessary to create a sea-change shift in transit mode share in the corridor. On the destination end of the commute trip, the regional distribution of jobs makes automobile travel more efficient for all but a few areas of concentrated employment (i.e., Sorrento Valley, downtown San Diego, Kearny Mesa, and University City). As discussed in Section 6.1, few single employment centers in the San Diego region are large enough or concentrated enough to support transit connections to all parts of the region, particularly those parts with low population densities such as the NCC.
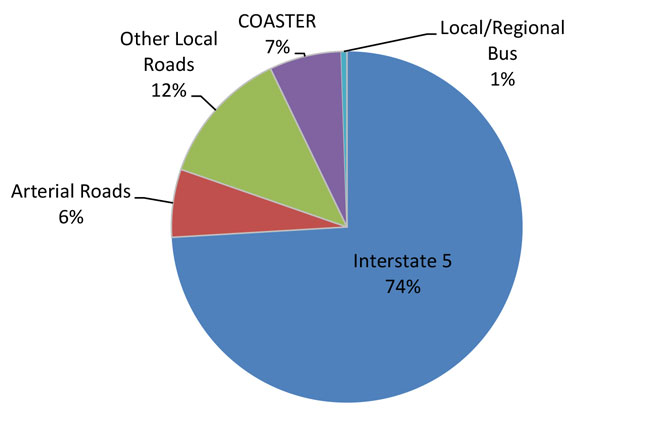
Another way to evaluate commute trip mode share is to count the person-trips on each mode as they cross an identified line during the peak periods. This allows for an analysis of mode share during commute times for trips with similar general travel paths (i.e., north-south). Los Peñasquitos Lagoon offers such an opportunity as I-5, LOSSAN rail and Coast Highway (the major north-south arterial) all cross the lagoon in close proximity. Figure 2 illustrates the transportation mode used as travelers cross Los Peñasquitos Lagoon during the AM peak period. While not all travelers at this time are commuters, a significantly large percentage is. This data indicates that the COASTER rail service carries approximately 7% of all person-trips at this location in the corridor during the morning peak period. Almost three-fourths of the person-trips at this location is on I-5. The higher transit mode share for this narrowly defined (peak period, north-south) trip, as compared to all commute trips in the corridor (shown in Table 3), reflects the fact that predictable work trips to the few large employment centers are generally the easiest to capture via transit. Planned enhancements to the NCC rail corridor are anticipated to increase the transit mode share for these peak period work trips. However, the majority of commuters have other widely dispersed origins and destinations and will continue to depend on the highway and arterial network for their work trips.
Figure 2
- AM Peak Mode Share Crossing Los Peñasquitos Lagoon. Source: I-5 North Coast Corridor System Management Plan (CSMP), Chapter 4, July 2010.
Visitors
Visitors and locals enjoy the NCC for its approximately 30 miles of beaches, quaint coastal communities, parks, open spaces, coastal resorts, and entertainment venues. Beaches in the NCC attract over half the region's beach visits, or over two million people a year.5 Attendance figures also show that 1.7 million people visited Legoland, 1.4 million attended the San Diego County Fair, and over 662,000 people visited the Del Mar racetrack during 2010.6 These Visitors and recreational travelers often have unique needs that are not easily served with transit. For example, a family of four spending a Saturday on the beach would likely load a vehicle with boogie boards, umbrellas and coolers full of food and drinks, which are difficult to transport on public transit. In addition, many recreational users travel from locations east of the corridor that are not directly served by north-south NCC transit services, particularly on weekends. As a result, recreational users are much more likely to make their trips via automobile. While these types of trips do not generally lend themselves to travel by transit, recreational users are more likely to be HOVs, with as many as 50% of weekend traffic on some sections of I-5 being HOVs.7
Businesses
International, inter-regional and regional businesses transport billions of dollars of goods annually using the intermodal freight transportation network in San Diego County. While there is freight service on the LOSSAN rail corridor, trucks carry more than 90 percent of the region's freight volume.8 Aside from locally based shipping, which is mostly by truck, the majority of goods that arrive in San Diego bound for other regions are also transferred to trucks before being shipped to their inland destinations. This stems primarily from the economics of goods movement; businesses typically choose trucks to move freight through the region because it avoids the additional train-truck transfer that would be necessary before goods reach their final destinations, which are predominately within 100 miles. It is expected that this heavy reliance on trucks for goods movement will continue.
As the primary link to the Los Angeles area, I-5 carries about one-third of all the freight in the San Diego region, with an estimated value of up to $88 billion in 2007 and an Annual Average Daily Truck Traffic of about 7,200. In addition, in 2007 approximately 900,000 trucks entered the United States from Mexico through the San Diego region's three land ports of entry, and these international truck volumes are projected to increase to 4.5 million by 2050. In contrast, in 2007 about 9,000 loaded rail cars made this same crossing representing over $900 million in goods. By 2050, these figures are anticipated to 20,000 loaded cars and a value of $2 billion.9 With many of these goods destined for distribution throughout the nation, I-5's role in goods movement alone makes it a vital economic lifeline–and its importance will continue to grow as the international traffic increases.
Interregional and Through Travelers
Interregional and through travelers use NCC facilities at some point in the course of their travels, but generally do so as part of longer-distance trips to or from points outside the NCC. The region is bounded by several major commercial and tourism destinations–including Los Angeles, Orange County, Riverside County, and Tijuana, Mexico–that attract many types of users. While some of these trips begin or end in the NCC, such as a family from Riverside visiting the beach or an Encinitas resident traveling to Los Angeles for a business meeting, other trips use the transportation facilities to pass through the NCC, such as freight from Mexico heading to the Port of Los Angeles or a family from Chula Vista going to Disneyland. Through trips also include shorter journeys that are entirely within the region and cross into the NCC during the trip, such as a Fallbrook resident using I-5 to reach Downtown San Diego.
During peak hours, over 60 percent of NCC travelers are using NCC facilities for these interregional and through trips.10 These trips' shares are anticipated to grow by another 10 percent by 2040.11 As I-5 and the LOSSAN rail corridor provide the only interregional transportation facilities to and through the NCC, they will continue to be essential in facilitating these travel patterns. The addition of Managed Lanes to I-5 will greatly improve the performance of these interregional and through trips, as the new lanes will provide an option for travelers who wish to avoid the congestion caused by local traffic.
2.3 Travel Demand in the Corridor
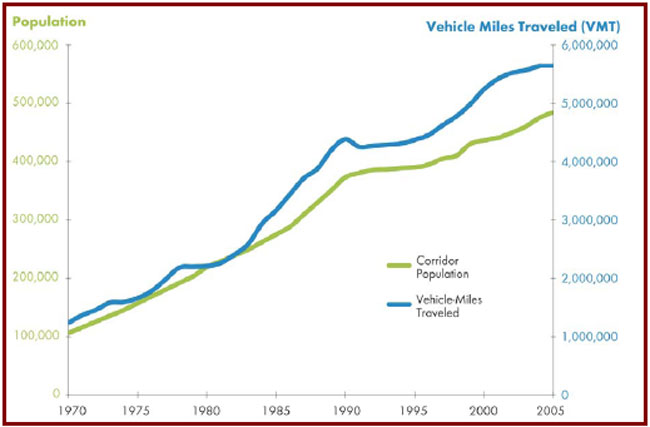
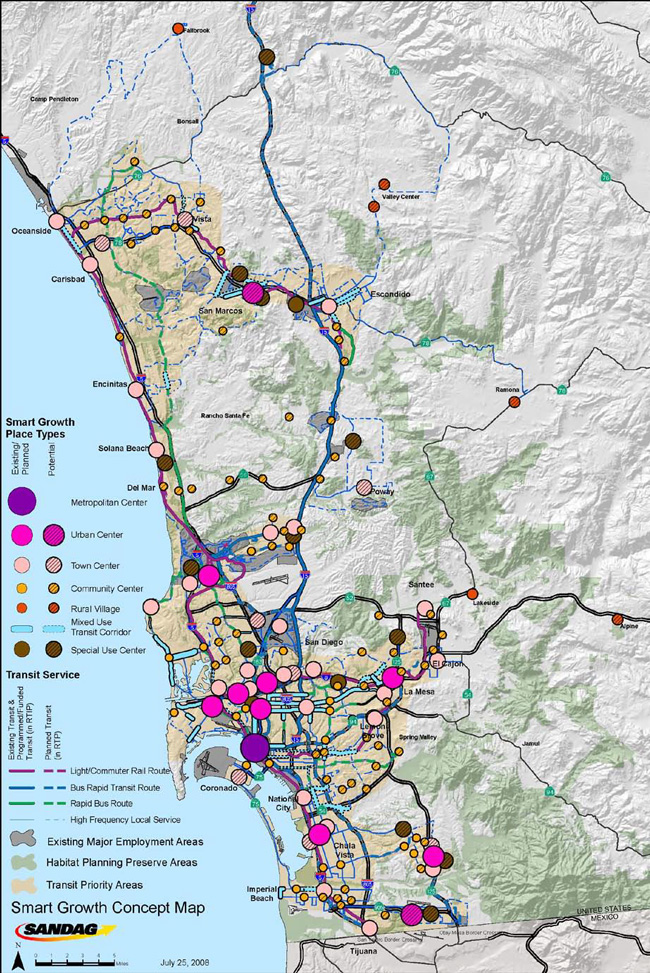
The NCC travelers and trip types described above place a demand on the corridor's transportation facilities and services. Historically across the nation, demand for travel has increased at a faster rate than population growth–that is, people are making more and longer trips today than in the past–and the NCC is no exception. Figure 3 shows how growth in vehicle miles traveled (VMT) has significantly outpaced population growth in the NCC. Table 4 shows historic, existing, and projected daily trips on I-5 in selected segments of the corridor.12 In an effort to slow these increases, SANDAG and the region's local jurisdictions are pursuing innovative "Smart Growth" policies–including the tax-funded Smart Growth Incentive Program–that seek to reduce vehicle-miles traveled (VMT) and greenhouse gas emissions (See Appendix B: Smart Growth Concept Map). However, even with these measures, daily trips on the I-5 segments in Table 4 are still expected to grow by approximately 30% by 2040. In the corridor as a whole (not just on I-5), trips taken on a daily basis by individuals (daily person-trips) are forecast to grow from 2.5 million today to 3.27 million in 2030–an increase of more than 700,000 daily trips, or 30 percent.13 As population and per-capita travel continue to grow in the NCC, greater demand will be placed on all transportation facilities in the corridor.
Figure 3
- North Coast Corridor Population and Travel, 1970-2005.
Table 4: Interstate 5 Historic and Projected Daily Traffic Volumes
Source: I-5 North Coast Corridor System Management Plan (CSMP), July 2010 and Staff Updates.
I-5 Segment
1970
2010
2040 (No-Build)
% Change (1970-2010)
% Change (2010-2040)
I-805 to Carmel Mountain Road
48,000
301,500
399,000
528%
32%
Encinitas Blvd to Leucadia Blvd.
43,000
209,500
280,900
387%
34%
Mission Ave. to SR-76
49,000
159,000
203,300
224%
28%
3.0 Current and Future Transportation Deficiencies in the NCC
The NCC's transportation infrastructure, the majority of which was designed and built decades ago, is becoming increasingly strained as both population and travel demand continue to grow. The deficiencies are spread across all of the corridor's major transportation facilities–not just I-5, but also local roads, bicycle, and pedestrian paths, and the rail and bus transit systems.
3.1 Highway and Road Congestion
As population and corresponding travel has grown in the NCC and the region, corridor traffic conditions have deteriorated. Long corridor travel times inhibit mobility and will continue to worsen without improvements. Congestion will further increase travel times, periods of daily congestion will lengthen, and reliability will continue to be an issue for travelers. While this deficiency may be most visible on I-5, its effects are not limited solely to the highway; I-5 congestion also results in increased congestion on the local arterial street networks, as frustrated travelers exit the highway in search of alternate routes. This "cut-through" traffic creates additional problems in the cities along the NCC, further restricting mobility and access to coastal resources.
Table 5 shows corridor median travel times under current and future conditions during peak periods. When I-5 is uncongested, it takes 23 minutes to traverse the 27-mile route from La Jolla Village Drive in San Diego to Harbor Drive in Oceanside. This same northbound trip currently takes 30 minutes during the PM peak period and is expected to take a congestion-ridden 70 minutes by 2030 without any improvements to the highway.
Table 5: Median Weekday Peak Travel Times (minutes) I-5 from La Jolla Village Drive to Harbor Drive
Source: I-5 North Coast Corridor System Management Plan (CSMP), August 2010 and Staff Updates.
Time/ Direction
2010
2030 No-Build
Northbound A.M. Peak Period
Southbound A.M. Peak Period
Northbound P.M. Peak Period
Southbound P.M. Peak Period
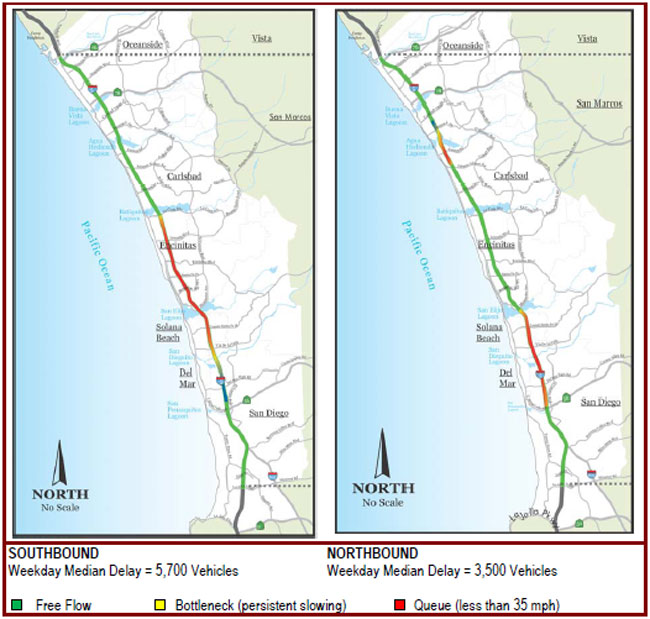
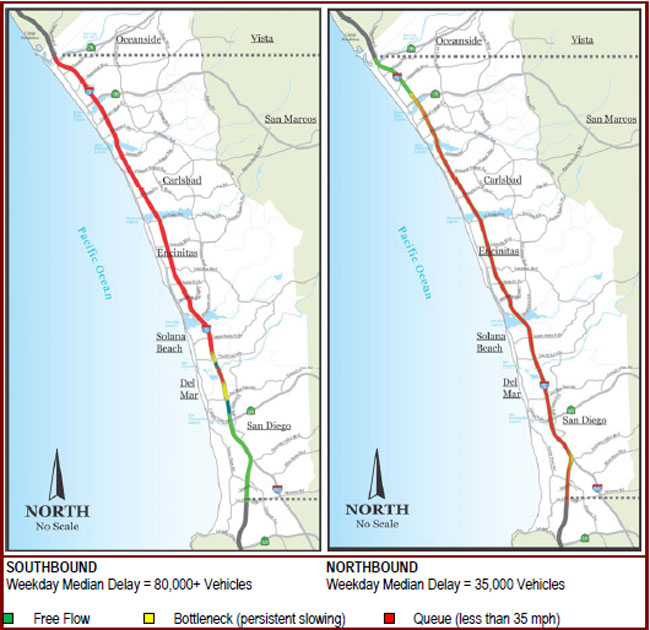
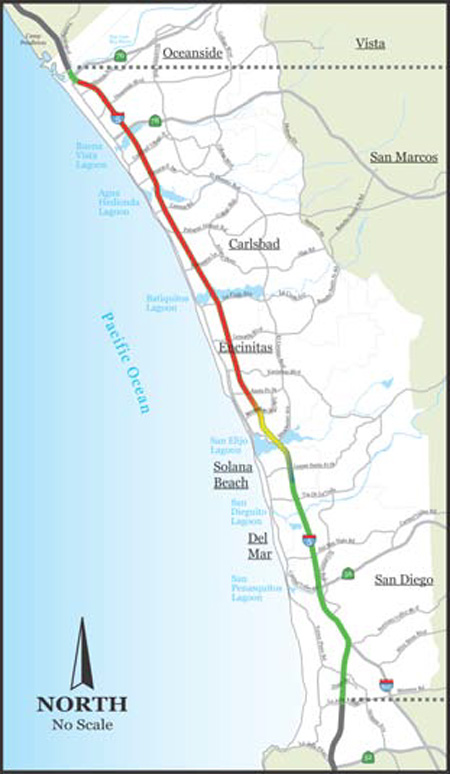
Figure 4 shows the current extent of peak-period congestion in the I-5 corridor. Figure 5 shows the projected extent of peak-period congestion in the NCC in 2030 with no improvements to I-5. Finally, Figure 6 shows that similar or worse conditions are experienced on weekend days, especially during the summer, when recreational travelers are accessing the corridor's coastal resources.
- Summer Weekend Northbound Congestion, 2007. Source: I-5 North Coast Corridor System Management Plan (CSMP), Chapter 5, July 2010.
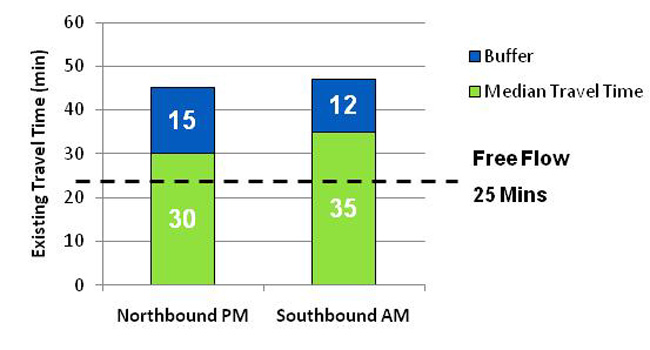
Travel reliability is another way to understand how congestion impacts travel patterns. Reliability focuses on the predictability of the public's travel time and measures the amount of additional time that is needed to guarantee an on-time arrival. Figure 7 presents median travel and buffer times for a person to travel through the I-5 NCC. The bottom green portion of the graphs represents the average weekday (Tuesday through Thursday) travel times, and the top blue portion of the graphs represents the "buffer time"–the extra time that would need to be added to a person's daily commute to ensure on-time arrival 95% of the time. These buffer times only take into account variations in congestion and do not consider the effects of incidents, weather, and special events (such as the San Diego County Fair and horse races at the Del Mar Fairgrounds).
Figure 7
- Median and Buffer Travel Times, 2010.
Both increased travel times and reductions in reliability due to congestion in the freeway general-purpose lanes inhibit travel by HOV and BRT when these modes travel on the congested freeway with all the other vehicles. With congested freeways, these modes become significantly less desirable and, especially with BRT, infeasible.
As a result of increased travel times and reduced reliability, the majority of commuters will continue to experience work trip delays, truck freight movements will be further impacted, and access to coastal resources, activity centers, and facilities for residents and visitors will become increasingly difficult. In addition, regular congestion on I-5 contributes to increased emissions and reduced air quality in the coastal areas, which will only worsen as congestion increases. These conditions have significant impacts on the region's economic viability, environmental health, and quality of life as travelers and businesses suffer from time lost on the freeway.
3.2 Bicycle and Pedestrian Deficiencies
While there are bicycle and pedestrian routes along the coast, east-west access is more limited. The Coastal Rail Trail provides coastal access to the length of the NCC primarily on a bicycle facility. The trail has been developed to different levels, with some segments providing bike lanes on streets while other segments provide completely separate rights-of-way. Access to the trail occurs along primary and secondary bicycle routes, which run from inland areas to the coast. These inland east-west routes are limited and contain gaps due to topographical, transportation facility, and environmental barriers. Additionally, many routes cross overpasses and rail crossings where facilities narrow and the quality degrades. Local roads cross I-5 in the east-west direction 37 times in the corridor, and many of these crossings feature non-standard bicycle and pedestrian facilities. As a result, it is difficult to make local trips using these bicycle and pedestrian routes.
3.3 Transit Deficiencies
Transit services in the NCC are relatively robust for an area of mostly low-density suburban development. However, the NCC still features comparatively low transit ridership, resulting not just from its auto-oriented development patterns and local demographics, but also from the many constraints on the transit system itself.
Land Use Constraints
Transit works best when large numbers of people are traveling from the same point at the same time to the same location (i.e., mass transit). Transit struggles to attract riders in places like the NCC, where the population is sparse and trip origins and destinations are highly dispersed–a modern development pattern that is promoted, and best facilitated, by the automobile. Rail transit is generally designed to serve long-distance and commute trips with origins and destinations that are inside the travel shed of the rail stations (i.e., dense population and employment centers). Short local trips generally are not well served by the longer-distance and fixed spacing of rail stations, interregional trip destinations generally extend beyond the rail station service area, and recreational trips have group travel and baggage needs that make using transit less efficient or convenient.
While the NCC's local bus system covers most arterial roads in the corridor, the area's topographic constraints and circuitous and discontinuous street system make it difficult to route buses close enough to most residences and businesses to provide convenient access. For many trips, bus stops are located just beyond practical walking distance. This access deficiency between the transit and the trip origin or destination is referred to as the "first mile" or "last mile" gap, and is often cited as the reason more people do not ride transit: It can get riders close, but not close enough, for many trips.
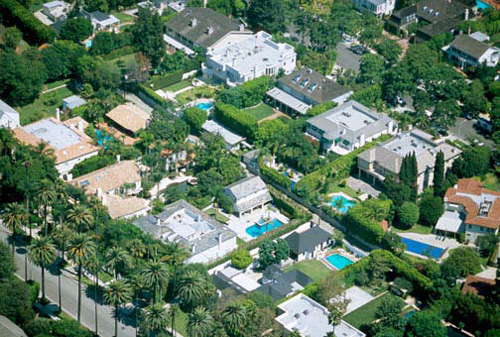
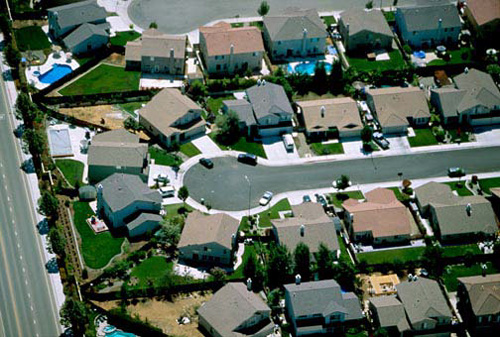
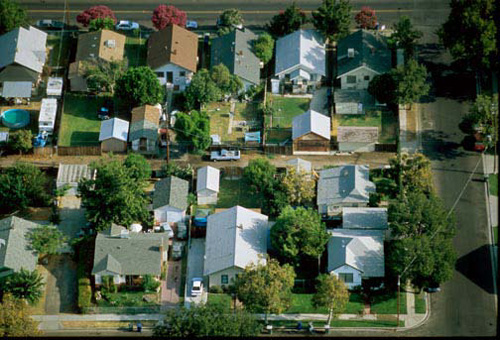
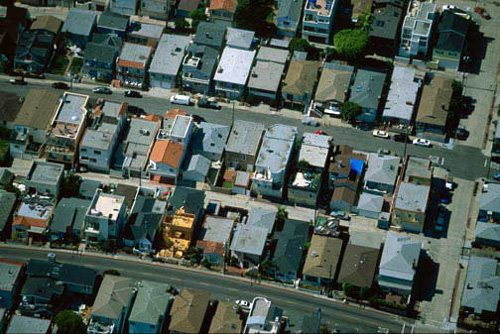
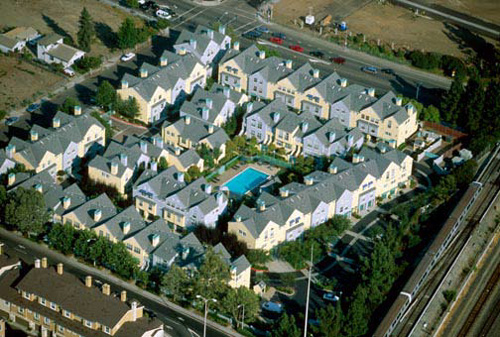
Studies have indicated a range of thresholds for transit-supportive residential densities, but one common reference, based on a review of Transit-Oriented Development (TOD) guidelines across the United States, indicates that thresholds of seven dwelling units per acre are necessary to support basic bus service, fifteen dwelling units per acre for premium bus service, and 20-30 dwelling units per acre for rail services.14 Figure 8 provides examples of these development patterns.
The low-density development pattern in the NCC results in very few concentrated areas of population that could support high-frequency transit service. To create a transit-supportive environment and increase walk access to transit, the land use pattern in the NCC would need to be completely transformed: not only tripling residential densities but also redeveloping communities with more walkable, grid-like, better-connected local street networks. While targeted areas of Smart Growth have been identified in the corridor, most of its built environment stems from a time when local land-use decisions supported low-density, single-use development. As such, suburban, single-family residential homes make up the majority of housing stock in the NCC, with typical densities under seven dwelling units per acre and only a few pockets of higher densities. Given the built-out nature of the corridor and the local cities' adopted land use plans and Local Coastal Programs, large-scale land-use changes are highly unlikely. This pattern, therefore, is projected to remain through 2050, while densities in other areas of the region will continue to intensify (see Appendix D: 2050 RTP Housing Density Maps).
Figure 8: Transit-Supportive Land Use Density Examples
Source: "Visualizing Density," Lincoln Institute of Land Policy, 2007
Employment Constraints
If the jobs of residents in the corridor were all located in downtown San Diego and Sorrento Mesa, a large percentage of commuters might be able to take advantage of rail service. However, this is not the case; in 2008 only 5.2% of all jobs in the region were located in downtown San Diego, and only 5.1% of regional jobs were located in Sorrento Mesa. The share of the region's jobs in both these job centers is expected to decline by 2030, and further by 2050.15 When commuters leave the NCC, they travel to jobs that are scattered throughout the region, often in auto-dependent locations with an abundance of free parking.
As the trend toward dispersed employment continues through 2050, it is exacerbated by several contributing factors (taken from Appendix C):
Downtown San Diego is not the largest employment center in the region
There is no single dominant employment center in the region
No employment center in the region will increase its regional employment share by more than two percent between 2008 and 2050
The four largest employment centers in the region (University City, Kearny Mesa, downtown San Diego, and Sorrento Mesa/Mira Mesa) are all projected to lose regional employment share through 2050
Appendix C reveals the degree of regional dispersal of employment projected through 2050. The land-use patterns in the vast majority of these employment communities are characterized by low-density and/or business park development with large amounts of free parking and limited pedestrian environments. The absence of large, concentrated, and growing employment centers–and the ongoing trend of employment dispersal–highlight the challenge of providing efficient transit service for commute trips in the NCC area.
Trip Characteristic Constraints
As noted in Section 2, a significant portion of trips in the NCC are internal to the corridor, and many of these trips are often only a few miles in length–to include local errands and rides to work or school. These types of trips are difficult to capture with transit in all but the densest areas, since the access and waiting times for buses generally cannot compete with the automobile for such short distances, particularly in the North Coast Corridor where most residents have a car available to make the trip. In addition, the tendency of travelers to "link" several local trips into a single voyage–such as leaving work, buying groceries, and picking up children from school–greatly multiplies the time advantages of driving over transit. Finally, many of these short local trips involve shopping, errands, or other cargo-intensive purposes that are not well suited for transit. Taken together, these factors result in a local population that generally does not choose the bus over driving.
Rail Capacity Constraints
With four rail operators sharing the LOSSAN corridor, passenger rail services along the corridor, including the NCC segments, are constrained by infrastructure that is significantly undersized for the volumes of traffic it accommodates. Fifty-one percent of the existing rail corridor between San Clemente and downtown San Diego consists of the single-track railway. These single-track sections greatly constrain the movement of trains through the corridor as trains must stop and wait at scheduled meets to allow for passing. Not only do these scheduled meets increase trip time for travelers, if one train experiences an unscheduled delay, but it also ripples throughout the corridor, affecting the schedules and on-time performance of other trains on the tracks. The result is relatively poor and unpredictable on-time performance on the LOSSAN rail corridor, particularly for Amtrak services. Poor and unpredictable on-time performance deters people from choosing rail for trips when it would otherwise be an acceptable option.
The single-track sections also limit the number of trains that can use the tracks at any given time, capping passenger capacity in the corridor. COASTER service operates every 30 to 45 minutes in the peak-period peak direction, while Amtrak operates approximately hourly in the peak-period peak direction. With the addition of Metrolink and periodic BNSF freight service, the number of train trips in the corridor is near capacity under current track conditions. The inability to increase service frequency on passenger rail reduces the attractiveness of rail as a viable transportation alternative in the NCC for many trips that require greater flexibility in travel-time choices. It also constrains the economic growth of freight rail service.
SANDAG has projected that the planned capital improvements and more frequent service on the LOSSAN corridor will increase daily person-carrying capacity from approximately 18,000 per day to as high as 47,000 per day.16 This would more than double the current capacity of the line and, assuming equal distribution of rail ridership throughout the day, is equivalent to two freeway lanes of traffic.17 This level of LOSSAN capacity exceeds the current and forecasted 2050 demand on the rail corridor, meaning that everyone who is expected to travel by rail in the NCC will be accommodated with extra capacity to spare. However, due to the unique and varied characteristics of trips and travelers in the corridor (trip purpose, length, origin/destination, etc.), rail service–even with this excess capacity– simply will not be able to address all trip needs. Nearly all of these rail-unsuitable trips must, therefore, be accommodated on the highway and roadway system in the corridor.
Rail Access Constraints
Even if the rail system could capture more trip types in the NCC, these new riders would still need to be able to access the stations. The area's low-density land-use patterns mean that relatively few people are within an efficient walk, bike and transit distance to COASTER stations, which means that most passengers access LOSSAN rail stations in the NCC by private automobile. During the morning peak period, on average 63% of passengers boarding the COASTER at stations within the NCC drive alone and park at one of the stations. Combined with those who carpooled or were dropped off, 80% of NCC COASTER commuters arrive at the stations by car.18 Relatively few passengers walk, bike, or take local transit buses to the stations, even though seventeen local bus routes connect to them. To change this, corridor land uses would need to become much more transit-friendly (concentrated, higher density development, with mixed uses and widespread pedestrian facilities) to achieve a significant shift in the way that users access to rail. However, most of the corridor is already built out–and existing land-use policies in the Local Coastal Program (LCP) support the current development patterns.
Assuming the corridor does not undergo a wholesale redevelopment and most users continue to access rail by driving, a significant increase in ridership would require similar increases in the parking capacities at rail stations. Table 6 shows the current COASTER parking supply, reflecting approximately 2,700 parking spaces at NCC stations. On average, however, all of the COASTER station parking lots except Oceanside are at or exceed, capacity by 8:00 a.m.19 Further gains in ridership will require the construction of new, multi-level parking structures with thousands of parking spaces, rather than the surface parking lots with hundreds of spaces currently seen in the rest of the corridor. This would mean thousands of additional vehicles accessing parking via local streets, with significant implications for coastal communities and access, as well as possible conflicts with LCPs.
Table 6: COASTER Station Parking and Feeder-Bus Service
Sources: TREP/PWP Chapter 3, NCTD and MTS *Operates from Riverside County to the Oceanside Transit Center.
Another way to provide increased access to NCC rail stations could be through enhancement of the existing feeder-bus services. Appendix A shows the existing bus routes that serve NCC COASTER stations. Taken together, these routes cover most of the major arterials and activity centers in the corridor, leaving few viable options for new direct feeder bus routes. However, due to the low-density, suburban development that pervades the NCC, only 51% of households are within one half-mile of a bus stop, compared to 66% of households across the region and 73% in the SANDAG-defined urbanized area.20 This demonstrates the considerable difficulty of providing transit service in suburban areas, where residences are spread out and automobile travel has a considerable advantage.
The existing local bus services currently operate at low to moderate frequencies, reflecting the relatively moderate ridership demand typical of low-density areas (compared to the denser central core areas). While improved frequencies would likely attract more riders, any increases in ridership (and accompanying fares) would not offset the increases in costs associated with providing more service. The result is likely to be that operating subsidies would increase at a faster rate than ridership. These increased subsidies would need to come from somewhere, and given the limited public operating funding available to transit agencies, the likely place would be through the elimination of services elsewhere in the region. Because funding is scarce, regional decision-makers must make prudent decisions on where and how to provide transit service that balances access with cost-effective returns on investment to ensure that the transit system is sustainable over time. Local bus service is planned on a short-term basis in order to remain flexible to changes in funding and ridership, and while improvements in local bus transit services are anticipated in the NCC over the next forty years, there will always be limits on the feasibility of investment.
In evaluating the benefits of enhancing bus service in the NCC, it is also important to consider the likelihood that users will use the enhanced services to make their trips. Even if the region invested extremely heavily in buses to provide high-frequency coverage in every area of the corridor, the decision on whether to use transit ultimately is up to the individual traveler. By definition, a feeder bus requires the passenger to transfer between bus and rail during their trip, adding more time and an extra logistical layer to the transit experience relative to driving. A comprehensive survey of regional residents in 2000 confirmed the long-held belief among transportation experts that this "transfer penalty" is a significant barrier to transit use, especially among those who already have access to cars.21 Therefore it is unlikely that enhanced bus service, even if implemented to the maximum extent, will supplant the automobile as the mode of choice for the majority of NCC travelers.
BRT and Rapid Bus Constraints
The NCC currently does not have any BRT or Rapid Bus service. Implementation of both of these types of transit improvements is planned in the corridor over the next forty years. But like local bus service, extensive investment in BRT and/or Rapid Bus is constrained by the challenging topography and circuitous street network, low land use densities with few areas of concentrated populations, and limited funding. Successful BRT is wholly dependent on the implementation of the I-5 Managed Lanes since, by definition, BRT operates on a congestion-free "guideway" connecting concentrated areas of population and employment. The reverse-commute BRT planned for the I-5 Managed Lanes targets the peak-period commute trip between the high-density Mid City residential area in central San Diego and the Palomar Airport Road business park in the NCC. There are few other opportunities in the NCC to link dense population and employment centers. A BRT route between Oceanside and University City in San Diego (utilizing the I-5 Managed Lanes) that was evaluated during the development of the 2050 RTP failed to generate enough projected ridership from NCC residents to withstand the regional screening process for allocation of scarce resources.
Rapid Bus services operate along major arterials and can take advantage of signal and intersection priority treatments to speed up service. The 2050 RTP includes a Rapid Bus project for Coast Highway through the NCC. While some local bus routes can evolve into Rapid Bus services over time, to justify the capital and operating investment necessary to convert to a Rapid Bus, these routes require consistent activity and population concentrations along their routes, something that many major arterials in the NCC lack.
Funding Constraints
As discussed in Section 4, SANDAG needs to focus a large proportion of its transit investment in areas where transit services are most likely to succeed: the region's higher-density, mixed-use, pedestrian-friendly communities. However, while the NCC lacks many of the transit-supportive characteristics of some of the region's central core communities, the 2050 RTP still includes significant investment in LOSSAN rail, BRT, Rapid Bus, and local bus service in the corridor–a level of investment that, compared to the more urban core areas of the region, is somewhat disproportionate to its relatively lower ridership returns. Through the RTP, SANDAG has opted for a balanced system that provides transit access throughout the urban area, while simultaneously achieving regional and state goals. Tipping this balance to allocate additional regional transit resources to the NCC above what is identified in the RTP would come at the expense of regional transit ridership and other objectives.
In addition, providing one-time capital investment in transit infrastructure is only part of the solution for improving transit in a region or corridor: Transit also requires continuous operating funding to keep services going. Like every other city and region in the United States (and most of the world), transit operations are subsidized heavily by local, regional, and national governments. In the San Diego region, passenger fares cover less than half the cost of providing service (and much less for the COASTER), meaning that public subsidies pay for the majority of transit operations.22 This operating funding is scarce and diminishing, which greatly limits the region's ability to increase transit services; such scarcity requires difficult decisions to be made on how to allocate the region's resources, both to maximize returns on investment and to ensure fiscal sustainability. Through its RTP, SANDAG has adopted a prudent balance between expanding transit access and maintaining an efficient transit system that can be sustained in the future.
3.4 Implications of Deficiencies and Constraints
Deficiencies and constraints in the North Coast Corridor transportation network inhibit coastal access and economic growth by increasing travel times, decreasing reliability, and limiting travel choices. One likely result is that frustrated travelers may choose not to make discretionary trips to coastal resources.
While the vast majority of trips in the NCC will continue to be by auto through 2030 and beyond, transit will also continue to play a vital and growing role in the corridor's transportation network. Indeed, SANDAG's 2050 RTP includes major improvements to rail and bus transit facilities and services in the NCC to address some of the existing deficiencies and make transit more competitive with the automobile. The RTP's planned investments in cost-effective transit improvements, high occupancy highway improvements, and expansion of bicycle and pedestrian facilities in the NCC will address growing travel demand and improve access and mobility along San Diego's North Coast by focusing on moving people, not cars. This multi-modal transportation vision will ensure that ongoing access to coastal resources in the NCC will be preserved and enhanced.
4.0 The Regional Context for the NCC
The travel, access, and quality of life deficiencies in the NCC are addressed by many mobility solutions in SANDAG's 2050 Regional Transportation Plan (RTP). The NCC, however, is only part of San Diego's coastal zone area and the San Diego region as a whole–a region that has a diverse array of transportation needs as well as many regulatory and fiscal constraints. This section outlines the numerous considerations that inform the regional decision-making process for the allocation of finite transportation resources.
4.1 RTP Goals and Objectives
The overarching policies that guide decisions in the region are published in the 2050 RTP and are summarized in Table 7.
Table 7: Goals of the 2050 Regional Transportation Plan
The transportation system should provide the general public and those who move goods with convenient travel options. The system also should operate in a way that maximizes productivity. It should reduce the time it takes to travel and the costs associated with travel.
Reliability
The transportation system should be reliable. Travelers should expect relatively consistent travel times, from day to day, for the same trip and mode of transportation.
System Preservation and Safety
The transportation system should be well maintained, to protect the public's investments in transportation. It also is critical to ensure a safe regional transportation system.
Social Equity
The transportation system should be designed to provide an equitable level of transportation services to all segments of the population.
Healthy Environment
The transportation system should promote environmental sustainability, and foster efficient development patterns that optimize travel, housing, and employment choices. The system should encourage growth away from rural areas and closer to existing and planned development.
Prosperous Economy
The transportation system should play a significant role in raising the region's standard of living.
The RTP associates each broad goal with specific policy objectives to help focus the decision making process. To support the goal of a Prosperous Economy, one such policy objective is to "maximize the economic benefits of transportation investments."23 With financial constraints limiting the number of transportation projects possible, this objective requires planners to select the projects that will yield the greatest benefit to the region as a whole; such balancing entails careful evaluation of the region's varied needs, along with a rational assessment of which projects are most likely to attract users.
4.2 Regional Growth
The population of the San Diego region is projected to grow significantly in the coming decades, which will spur related growth in housing, employment, and travel demand. Between 2008 and 2050, the region is expected to add 1.2 million residents–a 40% increase. Those new residents will drive demand for 388,000 new housing units (a 34% increase) and the creation of 501,000 new jobs (a 33% increase).24 To accommodate this influx, SANDAG and the local governments have implemented a "Smart Growth" land-use strategy that seeks to increase population density, reduce vehicle miles traveled, and curb greenhouse gas emissions (see Section 4.5 below and Appendix B: Smart Growth Concept Map).
Travel demand, meanwhile, is growing at an even faster rate than the population. As discussed in Section 2.3, this trend indicates that people today are making more trips–and covering longer distances–than in the past. This regional trend holds in the NCC as well. By 2040, the number of daily trips in the NCC is expected to increase by approximately 30% (see Table 4).25 This growth greatly outpaces the projected growth in population (20%), and it means that the strain on the transportation system will compound quickly without significant improvements.
4.3 Greenhouse Gas Reduction Targets
The state of California has set ambitious goals for greenhouse gas (GHG) reduction across its 18 metropolitan regions. In 2008 the California Air Resources Board set targets for the San Diego region that call for a 7% per-capita reduction in GHG emissions by 2020, and a 13% reduction by 2035.26 Since a significant portion of GHG emissions come from transportation sources, these targets heavily influenced the composition of transportation projects and the design of the transportation network in the RTP.
To achieve the mandated GHG reductions, the region cannot continue growing with the same transportation and land-use patterns that dominated its past. SANDAG has determined that meeting the goals will require significant changes in travel behavior at the regional level, including both a reduction in vehicle miles traveled (VMT) as well as an increase in the share of trips taken on public transit. As financial constraints limit the number of transportation projects possible, the RTP, therefore, attempts to direct transportation investment to the areas where the greatest changes are possible.
4.4 Transit Mode Share Targets
Achieving SANDAG's GHG and VMT reduction goals will require an increase in the region's transit mode share, which is defined as the proportion of total trips taken on public transportation. The RTP specifies that the performance measure for transit mode share will be a weekday, peak-period commutes between home and work, as this is the type of trip for which behavior shifts to transit are the most likely.
The current transit mode share (again measured only by peak-period commute trips) is 2-3% for the region as a whole and just over 5% in the SANDAG-defined urban area. Two of the region's densest areas boast significantly higher numbers: Downtown San Diego has a 24% transit mode share, while the largely residential central core area (which includes Mid-City neighborhoods as well as parts of eastern San Diego) is just below 12%. All other parts of the region have transit mode shares well below 10%. For comparison, Table 8 lists the transit commute mode shares for selected U.S. cities; despite a handful of transit-heavy places, 17 of the nation's 30 largest cities have mode shares of 5% or less.27
The RTP sets an ambitious goal of achieving a transit peak-period commute mode share of 10-15% in the urban area by 2050 (a 400% increase from current levels). Though it may be difficult to reach, this growth in transit mode share will be crucial to meeting GHG reduction targets. To achieve the urban area transit mode share goals, SANDAG divided the urban area into districts and established district-level mode share goals based largely on the viability of transit in each area. Transit investments were then allocated according to these goals, with the greatest investment going to areas where transit is most likely to succeed. Downtown San Diego and the central core, where density and land use patterns are most conducive to transit, are charged with raising their transit mode shares to 30+% and 20-25%, respectively. The goal for the NCC is 10-15%, which is ambitious given the area's limitations to transit effectiveness (discussed in Section 6) and would be a major improvement from the current share of 23%. Overall, decisions made at the regional level to implement regional goals and address state GHG reduction targets have resulted in a planned allocation of transit resources and projects throughout the region that focuses on investment in the densest urban areas.
Table 8: Transit Commute Mode Shares in Selected U.S. Cities
Source: U.S. Census American Community Survey, 2005-2009 5-Year Estimates.
City
Commute Mode Share
New York City
55%
Washington, DC
37%
San Francisco
32%
Chicago
26%
Seattle
19%
Portland, OR
12%
Los Angeles
11%
Goal for San Diego Urban Area and NCC
10-15%
Denver
8%
Houston
5%
Phoenix
4%
San Diego28
4%
San Antonio
3%
4.5 Land Use
The San Diego region, including the NCC, has historically low-density land-use patterns commonly associated with suburban sprawl. This spread-out style of development, while highly conducive to automobile travel, severely limits the potential viability of public transit. Transit is most effective and efficient in areas that contain a mix of high-density residential, commercial and employment development, concentrated populations, and urban design that promotes and encourages walking (most transit riders are pedestrians for some segment of their trips).
In recent years, SANDAG has shifted toward "Smart Growth" policies that encourage these transit-friendly development patterns. By promoting more trips by foot, bike, and transit, and correspondingly less reliance on the automobile, Smart Growth policy is expected to help make transit a more competitive travel mode. In 2008 the SANDAG Board of Directors adopted the Smart Growth Concept Map (Appendix B), which seeks to implement the goals established in the Regional Comprehensive Plan by identifying specific communities for Smart Growth development and coordinated transit investment. The map identifies 196 existing and future transit-supportive and Smart Growth opportunity areas in the region and is used by the board to prioritize transportation investments in the RTP and determine eligibility for funds from the Smart Growth Incentive Program. The NCC contains over 15 of these Smart Growth opportunity areas, the majority of which are located in community cores near COASTER and SPRINTER transit stations.
Local jurisdictions and SANDAG are working together to introduce Smart Growth development clusters into the NCC to accommodate future growth with higher-density, mixed-use development. However, the majority of the region's Smart Growth is planned to occur in places that have existing transit-supportive land-use patterns–primarily the central core area. Because most of the NCC features a low-density, suburban land use pattern, it is not where the region is focusing the bulk of its Smart Growth efforts and corresponding higher-intensity transit.
4.6 Funding
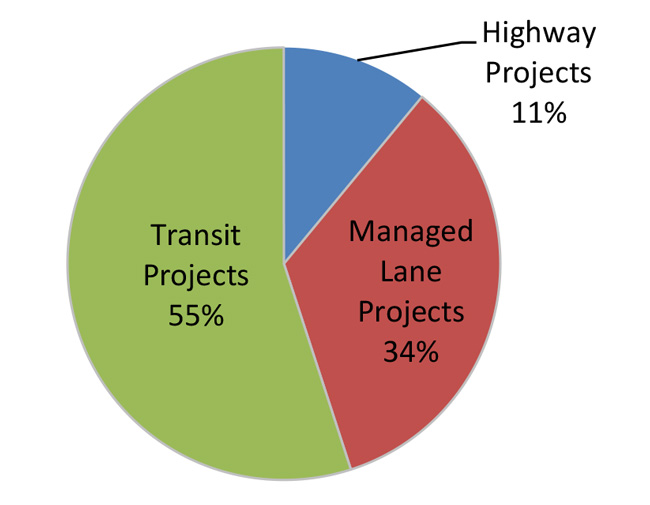
The 2050 RTP allocates over $112 billion to transportation in the next forty years, measured in 2010 dollars.29 Of this sum, 50% is dedicated to transit-related uses, including the capital, operations, and maintenance. Another 41% is allocated to roads and highways. The remainder is earmarked for active transportation projects (bicycle and pedestrian), smart growth incentives, and other initiatives. Subtracting operations, maintenance, and administrative costs, a total of $26.6 billion are allocated for transit capital projects, $16.0 billion for the construction of Managed Lanes and other HOV facilities, and $5.4 billion for general-purpose highway projects.30 These proportions are depicted in Figure 9. Because Managed Lanes support transit service and discourage single-occupancy travel, they represent a more efficient use of capital funds than general-purpose highway expansions; overall, 89% of the RTP's capital budget is allocated to transit or transit-supportive highway projects.
Figure 9
- Capital Investments in 2050 RTP.
Despite the seemingly large size of these expenditures, the RTP represents an abridged list of the region's desired transportation projects. By law, the RTP must conform to a revenue-constrained scenario that makes reasonable assumptions about funding availability in the coming decades. In the planning process, however, SANDAG first devises a revenue constrained scenario: essentially a "wish list" of projects the region would accomplish if given unlimited resources. This unconstrained list is then pared to fit Source: SANDAG Staff, October 2011 available funding according to the ranked priorities of the projects.
To keep fares low enough to attract ridership, most of the world's transit systems require public subsidies to operate. The proportion of costs covered by fare revenue–known as the "farebox recovery ratio"–is currently 35% in the San Diego region, which is consistent with national trends. The remainder of transit funds comes from various public sources, ranging from federal grants to the local TransNet sales tax.
The amount of transit subsidy varies among the region's areas and types of transit services. In the densest areas of San Diego, bus and trolley routes enjoy high ridership and relatively low subsidies: In 2009, MTS buses required $1.43 in subsidy for each passenger boarding, while MTS trolleys' subsidy per passenger boarding was just $0.68.31 By contrast, local bus routes operated by NCTD–the main transit operator in the NCC–required a subsidy of $4.09 for each passenger boarding, reflecting the challenges of providing efficient transit service in large, low-density suburban areas. Subsidy per passenger on the COASTER was $6.32 in 2009, reflecting the higher cost of operating and maintaining commuter rail service compared to bus service in the corridor.
Transit services that require large public subsidies present a cost/benefit dilemma for regional decisionmakers. While there is a social benefit to providing transit access to everyone in the region, fiscal constraints mean that investing in areas with inherently low ridership effectively excludes investment in more cost-effective services in other areas. SANDAG has crafted a careful balance in the RTP that allocates transit throughout the urban area, ensures a fiscally sustainable transit system, and achieves regional transportation goals and state GHG mandates.
5.0 A Multi-Modal Vision for the North Coast Corridor
Today and into the future, the NCC is host to a wide variety of travelers, including residents, commuters, visitors and freight haulers. The number of these travelers has increased historically and is expected to continue to increase due to regional population growth and the continued importance of this corridor in the regional and interregional movement of people and goods. Expanding transit service in the NCC is part of the solution to accommodate travel growth and maintain mobility in and through the corridor. However, transit alone will not be sufficient to meet the diverse needs of travelers in the corridor. Only a balanced, integrated set of improvements to the transportation system can adequately address the diverse and growing travel demand in the NCC.
5.1 Corridor Objectives
The TREP/PWP identifies both transportation and coastal access goals for the NCC, which are summarized in Table 9 and Table 10. While transportation and coastal access goals are often viewed as representing incongruent purposes, the TREP/PWP integrates these goals so as to not only balance the various transportation needs of the corridor but to enhance multi-modal access throughout the corridor and thereby maintain and enhance, wherever feasible, access to the coast and upland recreation areas.
Table 9: Transportation Objectives for the North Coast Corridor
Goal
Definition
Congestion Reduction
The NCC's transportation facilities should be free of congestion to the greatest extent possible. This means not only accommodating the transportation needs of today's residents, but also planning for the transportation needs of future residents, whose population is projected to grow by more than 20% in the next two decades.
Environmental Protection and Enhancement
The NCC's human and natural environments should be protected, and enhanced wherever possible, to promote sustainability and quality of life for all residents and visitors.
Transportation Flexibility
In addition to providing benefits in the near term, the NCC's transportation system should be able to adapt to future changes in demand, transit ridership, technology, land use, and other influential factors.
Value Maximization
The NCC's transportation investments should maximize value, providing the greatest possible mobility benefits per dollar spent, for both the NCC and the entire region.
Coastal Access
The NCC's transportation system should provide improved access to coastal areas for all residents and visitors.
Integration into Larger System
The NCC's transportation system should be maintained and enhanced as an important link in the regional, state, and national transportation system.
Movement of People Rather than Vehicles
The NCC's transportation system should prioritize the movement of people, rather than simply vehicles, in order to maximize efficiency and reduce per capita pollution, energy consumption, and vehicle-miles traveled.
Table 10: Coastal Access Objectives for the North Coast Corridor
Goal
Definition
Congestion Reduction
Access to coastal areas should not be hampered by congestion in the transportation system, a problem that has already been cited as a major impediment by the Coastal Commission in its Public Access Action Plan.
Maintenance and Expansion of Transit Service
Public transit service should be a reliable and efficient option for all residents and visitors to access the coastal resources of the NCC. Where practical, transit services should be expanded in response to continued growth in population and demand.
Provisions for Non- Automobile Circulation
Coastal areas should have ample facilities that allow for movement via nonautomobile means, to include transit and shuttle services, bicycle access lanes, and pedestrian facilities.
Adequate Parking
Coastal areas should have adequate parking facilities to serve the majority of residents and visitors who travel by car. Where parking is not feasible, substitute means such as public transit or shuttle services should be available to access the coast.
Ability for Future High-Intensity Transit
The NCC should maintain the potential for future expansions of transit service as growth continues, to include higher-intensity modes such as rail, rapid bus, and bus rapid transit (BRT).
Enhancement of Recreational Facilities
To prevent the recreational needs of the growing population from overloading coastal recreation areas, the NCC's parks, beaches, trails, and other recreational facilities should be preserved and enhanced, where feasible, in order to provide recreational opportunities for coastal residents and visitors.
A key theme underlying most of the coastal objectives is ensuring coastal access, a goal that is directly supported many of the transportation objectives. The current levels of congestion on both I-5 and the local street network hinder coastal access regularly, and without capacity improvements, this condition will only worsen as the population grows. (Congestion in the NCC also increases emissions and reduces air quality in the coastal areas, an outcome contrary to coastal objectives.) COASTER rail services are similarly limited, with heavy train traffic along single-tracked segments slowing the service and limiting its frequency, thereby limiting the use of rail service as an alternative means of traveling to and through the corridor. Finally, the non-motorized links to coastal access and recreational areas, mostly bicycle and pedestrian trails, are also in need of improvement due to various gaps and safety deficiencies. Implementation of the TREP/PWP will address each of these accessibility issues by bringing a multi-modal network of improvements to the NCC.
The proposed transportation projects also contain ample funding for the restoration, enhancement, and mitigation of coastal resources that would otherwise be unavailable. The Resource Enhancement Program will bring these tangible improvements to the coastal zone as an integrated component of transportation infrastructure improvements and at an accelerated pace, enhancing both the natural environment and its accessibility to users. Thus, the forty-year vision and program of projects included in the TREP/PWP will help to further coastal policy goals and objectives.
5.2 Six-Point Alternative Mode Strategy
The I-5 Managed Lanes project is only one piece of the transportation puzzle to address growing travel demand, achieve regional mobility and quality of life goals, and enhance coastal access in the NCC. SANDAG and Caltrans have identified a Six-Point Alternative Mode Strategy for the NCC to ensure that there is an efficient, effective and sustainable multi-modal transportation system to provide access and mobility for all travelers and trips–and to ensure that both coastal and transportation goals are achieved. The six elements of this strategy are:
1. Interregional Rail Improvements
The primary interregional rail service in the NCC is Amtrak's Pacific Surfliner, in addition to one connection at Oceanside with the Los Angeles-based Metrolink commuter rail system. Coordination efforts are underway to increase interregional rail access by allowing both Metrolink and the COASTER to travel farther across county lines. This will provide new travel options for interregional travelers to access coastal communities.
In the shorter term, the transportation agencies are also working on better connection coordination between the arriving and departing COASTER and Metrolink trains at Oceanside. This not only includes efforts to better align the timing between the two services, but also cross-ticketing and marketing programs between COASTER, Metrolink, and Amtrak that will allow interregional travelers to purchase one fare to cover multiple services. Once enacted, these enhancements will allow for smoother transitions between the NCC rail services, resulting in better interregional travel times and more options for travelers.
2. Improvements to COASTER Rail Service, Stations, and Parking
Enhancements will allow for 54 COASTER trips daily (up from 22 in 2011), as well as providing additional capacity for intercity and freight rail services. Infrastructure improvements planned for the LOSSAN corridor include a mix of double-tracking, other track capacity enhancements, rail bridge replacement, pedestrian crossings, vehicle crossing improvements, parking expansion, new platform locations, and other station enhancements. Generally, track projects directly improve capacity and therefore improve reliability, reduce travel times and provide the opportunity for increased service levels. In addition to increased frequencies, COASTER trains will also have reduced travel times due to the improved infrastructure (as shown in Table 11). Other improvements may increase access to rail or improve the passenger experience, which may lead to increased ridership.
More than half of the entire San Diego coastal rail corridor is single-tracked, which creates chokepoints when trains traveling in opposite directions meet. These conflicts create most of the delay in the corridor and corridor-wide double-tracking is necessary to sufficiently increase capacity and service. The LOSSAN rail program in the NCC would include double-tracking projects ranging in length from 0.6 to 2.9 miles. Other track improvements similarly increase capacity and decrease conflicts, which improves reliability and decreases travel times. Station and parking improvements at corridor stations will also increase passenger capacity, enhance the quality of service, and improve access to coastal rail.
3. New Rapid Bus and BRT Services
The 2050 RTP includes a new all-day Rapid Bus route along Coast Highway from Oceanside to University City. Rapid Bus service provides higher speed, limited-stop service through the use of roadway priority treatments such as traffic signal priority, intersection queue jumps, and dedicated transit lanes. The planned service will operate at ten-minute frequencies all day, providing a higher-quality local transit option to complement the existing network of local bus routes in the corridor.32 This will increase regional mobility and access to coastal areas for residents and visitors alike.
In addition, the RTP includes a new "reverse commute" bus rapid transit (BRT) service on I-5 that serves the peak-period commute trip between the high-density Mid City residential area in central San Diego and the Palomar Airport Road business park in the NCC. Like the planned improvements to LOSSAN rail service, this new BRT line will help to relieve congestion and reserve capacity on I-5 for other users, including visitors and recreational travelers who are not easily served by transit. However, as with the express bus services currently operating on I-15, the implementation of BRT on I-5 is wholly dependent upon the construction of Managed Lanes.
4. Improvements to Local Bus Service
While the TREP/PWP does not directly include local bus service, the 2050 RTP includes an increased commitment of operating funds for local buses, both within the NCC and across the region. While many transit dollars are earmarked for the region's higher-density communities, NCTD will receive a generous share of operating funds to sustain and enhance its services in the NCC. Access to the COASTER remains a priority for both NCTD and MTS, and travelers can expect various enhancements to the seventeen local bus routes that serve the NCC's six COASTER stations. (See Appendix A for a graphical depiction of the existing COASTER-oriented services, including ridership and frequencies.) Future enhancements could include higher frequencies, extended operating hours, and other improvements. The RTP also includes specific funding to increase service frequencies to fifteen minutes or better in key bus corridors, but at this stage, it has not been determined how NCC routes may benefit from this augmentation.
5. Community Enhancement Projects for Bicycle and Pedestrian Trails
The 2050 RTP contains $2.6 billion for an Active Transportation Program that seeks to improve bicycle and pedestrian facilities across the region, including the NCC. Caltrans and SANDAG have worked with the corridor cities to identify enhancement opportunities that would benefit from simultaneous construction with I-5 and improve how the I-5 project interfaces with adjacent communities. These enhancements would make connections in the existing bicycle and pedestrian network, improve trails, and enhance other new and existing facilities. Improvements include trail connections, streetscape enhancements, trailheads, bicycle and pedestrian bridges, overpasses, underpasses, lagoon trails, and recreational staging areas.
Additionally, local roads cross I-5 at 37 locations within the corridor. Many of these crossings do not have a standard bicycle and pedestrian facilities and therefore do not facilitate non-motorized modes crossing the freeway. As over-crossings are rebuilt and under-crossings are widened to accommodate additional lanes on I-5, pedestrian and bicycle facilities will be upgraded. By addressing existing barriers to east-west pedestrian and bicycle travel, these enhanced crossings will improve access to community facilities, LOSSAN rail stations, and coastal resources.
6. I-5 Managed Lanes for Carpools, Vanpools, and Transit
To increase the capacity of I-5 in a way that moves people–not simply vehicles–more efficiently and effectively, SANDAG and Caltrans plan to construct two new Managed Lanes in each direction in the NCC. These new lanes would be reserved for three types of vehicles: high-occupancy vehicles (HOVs– carpools, and vanpools), transit vehicles, and toll-paying single-occupancy vehicles (SOVs). The HOVs and transit vehicles have priority in the lanes, meaning that SOVs would only be allowed to enter when there is excess capacity. The SOV access fee, posted at lane entrances and paid electronically via transponder, would vary based on real-time traffic conditions; as the Managed Lanes approach a congested state, the fee would increase to discourage SOVs from entry. With real-time monitoring of traffic conditions and these variable pricing methods, the Managed Lanes will be able to preserve free-flow speeds and reliable travel times, even as the rest of the highway becomes congested, providing unconstrained access to the coast and through the corridor for many travelers. A similar system has already been implemented successfully in San Diego's I-15 corridor.
During peak travel times, even if each HOV only contains two people, one Managed Lane will be able to carry roughly 70 percent more people than one general-purpose lane.33 This confers a clear benefit over traditional highway designs by providing major capacity enhancements with a relatively minor footprint. While the region is hoping to realize a significant increase in the NCC's transit mode share, even in the most optimistic projections we know that the majority of future travel demand will still be placed on the highways. SANDAG's Managed Lanes strategy will go the farthest in helping the region accommodate the future demand on I-5 by getting the most person-carrying capacity out of highway expansion.
In addition, far from being an expansion that just suits the needs of drivers, the addition of Managed
Lanes also serve as an essential enabler of public transportation. By giving priority to buses and other HOVs, Managed Lanes make attractive public transit possible; because this new infrastructure will support reliable, congestion-free trips, I-5 will be able to accommodate transit services in the future as demands increase.
SANDAG promotes HOV travel through its iCommute program. The program assists commuters by providing free carpool and ride-matching services, a subsidized vanpool program, transit solutions, regional support for bicycling, the Guaranteed Ride Home program for students, and the SchoolPool carpooling program for parents. iCommute also provides free assistance to local businesses, helping them develop and implement customized employee commuter benefit programs that lower costs, increase productivity, and help the environment.
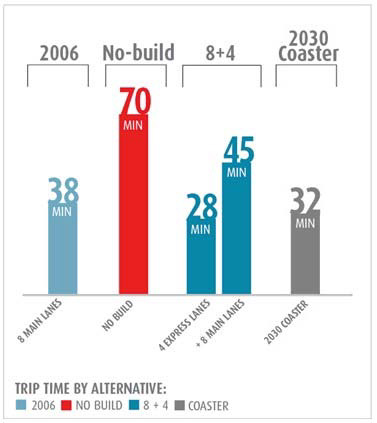
Table 11 shows corridor median travel times under current and future conditions during peak periods.
When I-5 is uncongested, it takes 23 minutes to traverse the 27-mile route from La Jolla Village Drive in San Diego to Harbor Drive in Oceanside. This same northbound trip currently takes 30 minutes during the PM peak period and is expected to take a congestion-ridden 70 minutes by 2030 without any improvements to the highway. Even with the planned improvements, travel time in 2030 is projected to be 45 minutes in the general-purpose lanes, indicating that the improvements will not even keep up with projected growth in demand (but will be vastly better than the No-Build condition). In the new Managed Lanes, however, PM peak travel would be nearly congestion-free, requiring just 28 minutes. In addition, planned enhancements to the LOSSAN rail corridor will allow the COASTER to make the same trip in 32 minutes in 2030, an improvement of five minutes over the No-Build scenario.
Table 11: Median Weekday Peak Travel Times (minutes), I-5 and COASTER from La Jolla Village Drive to Harbor Drive
Source: I-5 North Coast Corridor System Management Plan (CSMP), August 2010 and Staff Updates
Interstate 5
COASTER
Time/ Direction
2010
2030 No- Build
2030 General Purpose Lanes
2030 Managed Lanes
2008
2030 No- Build
2030 Improved
Northbound A.M. Peak Period
23
37
26
24
34
37
32
Southbound A.M. Peak Period
35
54
36
24-26
34
38
30
Northbound P.M. Peak Period
30
70
45
28
34
37
32
Southbound P.M. Peak Period
32
40
30
24-25
34
38
30
Figure 10 is a graphical depiction of the travel times during the PM peak period in the northbound direction. (The planned improvements to I-5 are expressed in the figure as the "8+4" scenario.)
Figure 10
- Figure 10: Typical Weekday PM Travel Times from La Jolla Village Drive to Harbor Drive. Source: I-5 North Coast Corridor System Management Plan (CSMP), August 2010 and Staff Updates.
Table 12 depicts the types of travelers who will benefit from the planned transportation improvements, separated by each transportation facility in the NCC.
Table 12: Travelers Benefitting from Planned Transportation Improvements
COASTER
Interregional Rail
I-5 Managed Lanes
I-5 General Purpose Lanes
Coast Highway Rapid Bus
Local Bus
Bike & Pedestrian
Residents
Short (< 5 miles)
Primary trip mode
Primary trip mode
Primary trip mode
Primary trip mode
Medium (5-30 miles)
Primary trip mode
Primary trip mode
Primary trip mode
Primary trip mode
Primary trip mode
Primary trip mode
Commuters
Short (< 5 miles)
Primary trip mode
Primary trip mode
Primary trip mode
Primary trip mode
Medium (5-30 miles)
Primary trip mode
Primary trip mode
Primary trip mode
Primary trip mode
Primary trip mode
Primary trip mode
Long (> 30 miles)
Primary trip mode
Primary trip mode
Primary trip mode
Primary trip mode
Secondary trip mode
Visitors
Medium (5-30 miles)
Primary trip mode
Primary trip mode
Primary trip mode
Primary trip mode
Secondary trip mode
Secondary trip mode
Secondary trip mode
Long (> 30 miles)
Primary trip mode
Primary trip mode
Primary trip mode
Primary trip mode
Secondary trip mode
Secondary trip mode
Secondary trip mode
Businesses
Short (< 5 miles)
Primary trip mode
Primary trip mode
Medium (5-30 miles)
Primary trip mode
Primary trip mode
Primary trip mode
Interregional & Through Travelers
Medium (5-30 miles)
Primary trip mode
Primary trip mode
Primary trip mode
Long (> 30 miles)
Primary trip mode
Primary trip mode
Primary trip mode
5.3 Other Strategies to Minimize Highway Expansion
SANDAG and Caltrans understand that the region cannot completely build its way out of congestion, and they have therefore adopted several strategies to focus on managing demand. Population and travel demand will continue to grow in the NCC with or without highway or transit improvements, and SANDAG's goal is to accommodate the growth in the most efficient way possible, minimizing costs as well as environmental impacts.
I-5 was constructed in the 1960s and 1970s. In the past forty years, travel demand in the NCC has increased significantly, but capacity improvements on I-5 have been limited and the footprint of the freeway has changed very little. Improvements to I-5 in the NCC have included the interchange with the I-805 merge, the addition of HOV lanes in the southern portion of the corridor, and operational improvements such as variable message signs and ramp meters.34 In the absence of major highway expansion in the corridor over the past forty years, the region has focused on a variety of strategies that work together to manage the growth in demand and address the multiple needs of travelers. Without these ongoing strategies, as many as sixteen total lanes of the freeway–double the existing I-5 footprint– would be required to meet future forecasted travel demand.35 Instead, the past and future approach include the following major components:
Transportation Demand Management (TDM)
TDM strategies have been and will continue to be a critical element for reducing travel demand in the corridor by encouraging the use of the bus, carpooling, and other alternative modes. TDM strategies take advantage of and help build a customer base for alternative modes by removing obstacles and providing information and incentives to travelers to make it easy to shift from single-occupant driving, reduce trips, or reduce travel at the most congested times. In addition to the ride-matching services, vanpool subsidies, and other incentives offered through SANDAG's iCommute program, TDM strategies may include financial assistance from employers for taking transit, allowing alternative work schedules (i.e., "flex time"), and providing opportunities for teleworking from home.
Transportation Systems Management (TSM) and Operational Improvements
TSM is a strategy to increase highway capacity without major capital investment, by enacting various operational improvements that increase system efficiency. These include the construction of new auxiliary lanes on the outside of the freeway that will connect on- and off-ramps and allow for acceleration, deceleration, and merging–often the causes of traffic bottlenecks and congestion. Other
improvements include Intelligent Transportation System (ITS) features, such as real-time information for drivers that allow them to make informed decisions on travel routes, and corridor-wide ramp metering to help regulate the flow of traffic. Various corridor interchange improvements help eliminate or minimize bottlenecks in the transportation system. Additional detection, monitoring, and communications infrastructure will allow for incident response and active management of the highway.
Broadly speaking, the transportation objectives identified in Section 5 are aimed at increasing regional mobility in ways that respect both the environmental and fiscal implications of transportation projects. The Six-Point Alternative Mode Strategy for the NCC is an embodiment of those objectives, with each element of the strategy contributing to the maintenance of an effective and balanced transportation system in the NCC.
Congestion Reduction
As discussed in Section 3, the NCC's transportation facilities today are plagued by congestion. From the peak-period backups along I-5 to the single-track delays on the LOSSAN rail corridor, the NCC represents a bottleneck not just for the San Diego region, but also for the state and national transportation systems. Regular periods of congestion directly result in lost time–and lost money and access–for residents, commuters, and visitors. Bottlenecks on the highway and rail corridors also impede the efficient movement of goods in and through the region, including the economically vital connections to Mexico and the Port of San Diego, resulting in longer shipping times, higher product costs, and economic losses for the entire society. On I-5, these bottlenecks also spill into the local road network in the form of "cut-through" traffic, which congests local communities. Finally, congestion diminishes air quality throughout the corridor as vehicles are forced to operate at inefficient speeds in stop-and-start settings.
With the population growing and travel demand increasing even more rapidly, the future promises even greater levels of congestion in the NCC unless capacity improvements are made. The Six-Point Alternative Mode Strategy discussed in Section 5 outlines a wide range of multi-modal improvements planned throughout the corridor to address the growing travel demand. The addition of Managed Lanes to I-5 is one element of this solution, which will expand the highway's capacity for high-occupancy and transit vehicles. But the solution also includes LOSSAN double-tracking, COASTER service improvements, new Rapid Bus and BRT services, enhanced local bus service, and better facilities for bicycles and pedestrians. Each improvement is aimed at increasing capacity in some way and, taken together, they represent a balanced approach to addressing the mobility and access problem. The fulfillment of the PWP's multi-modal transportation vision will go a long way toward increasing corridor capacity, decreasing congestion, and providing faster, more reliable travel choices for the residents, visitors and businesses who use the NCC's transportation system to access homes, jobs, shopping, recreational venues, and coastal resources.
Environmental Protection and Enhancement
While the LOSSAN rail improvements and the addition of Managed Lanes to I-5 will expand the transportation footprint within the coastal zone, SANDAG has selected the smallest-footprint highway alternative (8+4 with buffer) among the highway expansion options considered for the corridor. Further, the concurrent Resource Enhancement Program, which is tied to the implementation of the corridor transportation projects, ensures that significant contributions are made to the enhancement and protection of the NCC's environmental resources. The package of improvements planned for the NCC includes not just highway, rail, bicycle, and pedestrian enhancements, but also wetland restoration and creation, lagoon bridge lengthening, and the improvement of coastal trails and habitat areas. By taking advantage of funding that would otherwise be unavailable, the Resource Enhancement Program ensures that the NCC's natural environment will benefit from the planned transportation improvements.
The PWP's multi-modal vision will also reap environmental benefits through improved air quality, which will result from increased high-occupancy vehicle (HOV) travel as well as fewer vehicles operating in the inefficient, stop-and-start patterns of congestion. SANDAG is mandated by state law to reduce per capita greenhouse gas emissions by 2035, and the agency plans to achieve this through increases in both HOV travel and transit ridership. The PWP's investments in Managed Lanes, LOSSAN rail improvements, and transit service enhancements directly contribute to these objectives and are key components of SANDAG's overall strategy to meet the legal mandate.
Transportation Flexibility
While population growth in the NCC is expected over the next 40 years, other unforeseen changes may also occur that alter the mobility needs of the corridor's residents and visitors. Whether it is variations in travel patterns, modifications to land use policy, or advancements in technology, the transportation system should be equipped to respond to these changes as they happen. Caltrans and SANDAG understand that the current high level of demand for automobile travel may not persist forever– particularly as regional congestion and fuel costs increase–and this is why they have chosen a program of multi-modal improvements for the NCC.
The Managed Lanes on I-5, for example, will not just allow more efficient automobile travel in the corridor, but will also serve as an essential enabler of future transit services, by providing a congestion-free path for express buses or Bus Rapid Transit (BRT). The ability to manage these new highway lanes to meet changing travel behavior and demand–by varying tolls, changing vehicle occupancy requirements, or even creating a truck route during certain times of day–guarantees that there will always be free-flow access to coastal resources and communities. The RTP already includes plans for a reverse-commute BRT that will utilize I-5, traveling from San Diego's Mid-City neighborhoods north to the employment centers near Palomar Airport Road in Carlsbad. While the I-5 peak-period BRT (traveling south in the morning and north in the afternoon) did not perform well enough in model projections to be included in the current RTP, the existence of Managed Lanes will allow this service to be added in the future when demands dictate. Similarly, the planned LOSSAN rail enhancements will allow for much greater capacity on the rail corridor than is needed today, ensuring that the rail infrastructure will be able to accommodate growth in coastal rail access demands for many decades into the future.
Value Maximization
The competing demands for the region's limited transportation funds require SANDAG to select projects using a rigorous evaluation of goals, priorities, and projections during the regional planning process. As discussed in Section 4, the 2050 Regional Transportation Plan seeks to maximize the efficiency and effectiveness of transportation investments, and its prioritization of projects reflects this goal. While a basic level of funding is provided to all areas, the RTP's major investments are focused in places where they are most likely to succeed; in the denser urban areas of the region, this often means a greater emphasis on transit services, while in the outlying, more suburban areas this might mean a higher proportion of new highway projects or improved local arterials.
The PWP includes a combination of transportation investments that improve the transportation system's efficiency by favoring the implementation of high-capacity transit and highway facilities over expansion for single-occupancy autos. And because these facilities will offer fast and reliable travel choices for a variety of travelers to, through, and within the NCC, they are projected to attract sufficient use to maximize the value of the investments. While a transportation "wish list" for the NCC–one that is unconstrained by fiscal or legislative requirements–might contain even larger investments in transit, as discussed in Section 3, the corridor's demographic, employment, land use, geography, and travel pattern characteristics limit the viability of more significant investments in transit. The PWP projects will greatly improve corridor mobility and access while balancing both the corridor and regional need to maximize the benefits per dollar spent.
Coastal Access
NCC's transportation system is the gateway to the corridor's rich coastal resources, which are enjoyed by millions of residents and visitors each year. Current levels of congestion, which persist on weekends as well as weekdays, directly impede public access to these coastal areas and the neighboring communities. By providing increased mobility in the NCC, the improvements identified in the PWP–not just highway and rail enhancements, but also increased bicycle and pedestrian connections–will provide better, faster and more reliable access to the coast, improving local quality of life and simultaneously fulfilling the Coastal Act mandate to preserve coastal access. The issues surrounding coastal access and the provisions of the Coastal Act are discussed in greater detail in Section 7.
Integration into Larger System
The NCC is not an isolated corridor, but rather one piece in a much larger network of regional, state, and national transportation facilities. As a federally designated "Corridor of the Future," I-5 is an economically significant resource that plays an important role in the movement of people and goods. Similarly, LOSSAN is the nation's second-busiest passenger rail corridor as well as a significant freight facility. Considering the roles that these NCC facilities play in the national economy, it is clear that local congestion is not simply a local problem; such deficiencies create impacts that are felt well beyond the San Diego region.
It is therefore critical to ensure that the NCC's transportation infrastructure is maintained as an effective link in the national transportation system. The facilities must minimize congestion, remain in good repair, and take advantage of technological and operational advancements to increase efficiency. The PWP accomplishes these goals by providing NCC facilities with their first major overhaul in decades, expanding the capacity of both I-5 and LOSSAN to accommodate new demand. In addition, the PWP calls for a wide range of repairs and enhancements–including grade separations, signal improvements, direct access ramps, and auxiliary lanes–that will increase throughput efficiency and help preserve the facilities for the long term. This will allow the NCC to maintain its crucial role as an important link in the larger transportation network and ensure that degradation of NCC transportation facilities does not become the weak link in regional and interregional access to the coast.
Movement of People Rather than Vehicles
The efficiency of a transportation system can be measured by the mobility benefits it provides in relation to its costs. Because each vehicle on a highway contributes to congestion, maximum efficiency is achieved when every vehicle is carrying the greatest amount of people or goods possible. While this is not a realistic scenario for all travelers–circumstances often require travel in single-occupancy vehicles–high-occupancy travel is still something that can be encouraged with incentives. Managed Lanes are one such incentive, as they offer travelers a choice: Either travel alone and risk delays, or carpool and bypass congestion. It is in this way that Managed Lanes prioritize the movement of people over the movement of vehicles, thus achieving both better mobility, and higher capacity, per dollar, spent. As noted in Section 5, even if each HOV only contains two people, one Managed Lane is able to carry roughly 70 percent more people than one general-purpose lane during peak conditions.36 This confers a clear benefit to the region by achieving greater mobility outcomes per dollar spent than traditional, general-purpose highway expansion. Transit investments bring similar benefits by encouraging travelers to ride in high-occupancy trains or buses when it fits their travel needs. By focusing investments in the NCC on high-occupancy transit and Managed Lane facilities, the PWP projects will enable more efficient coastal access for many more people well into the future than would otherwise be possible under current conditions.
Prioritizing the movement of people over vehicles also contributes to environmental goals, since high-occupancy travel produces fewer greenhouse gas (GHG) emissions per capita than single-occupancy trips. SANDAG is required by state law to meet GHG reduction targets, and the addition of Managed Lanes to regional highways is a key component of the agency's strategy to achieve this. Similarly, the planned enhancements to the LOSSAN rail corridor will reap both mobility and environmental benefits, by providing a better level of service that will encourage some travelers to ride the COASTER instead of driving alone. The efficient movement of people in the coastal corridor will help enhance air quality along the coast and positively contribute to regional GHG reductions.
7.0 Coastal Act Policies: Public Access, Recreation & Transportation
The coastal access and recreation policies of the Coastal Act mandate that maximum public access and recreational opportunities in the Coastal Zone be provided for all people, consistent with the need to protect public safety, private property and natural resources. These policies further require public facilities to be provided throughout an area to mitigate impacts of overcrowding or overuse by the public of any single area, that low-cost visitor-serving and recreational facilities be protected, encouraged, and where feasible, provided, and that upland areas necessary to support coastal recreational uses, be reserved for such uses, where feasible.
7.1 Traffic Congestion Reduction
The Coastal Commission Public Access Action Plan recognizes roadway congestion as one of the greatest impediments to public access in coastal areas and specifically notes that, among other things, traffic congestion and poor traffic circulation are significant problems where residents and visitors compete to use the same transportation system. As discussed in Section 2.0, travel demand and traffic congestion in the NCC is driven not only by residents and visitors but by a wide variety of travelers with a range of needs that require an array of transportation solutions. However, when considering the unique needs and travel patterns of visitors and recreational travelers in the corridor which, as discussed in Section 2.2, are not easily served with transit, the region's past and continuing efforts to reduce traffic congestion and maintain acceptable transportation services on I-5 and local transportation arterials are critical elements to protecting public access to recreational opportunities along the San Diego County coastline.
As the primary means for the public to reach shoreline access points and upland recreational destinations in the NCC, I-5 serves as the gateway to the entire San Diego coastal area and provides a unique scenic, recreational traveling experience. As travel demand in the I-5 highway corridor continues to increase, so does the existing coastal access impediment of traffic congestion. Congestion on I-5 also results in increased congestion on local arterial street networks, when frustrated travelers exit the congested highway in search of alternate routes, further restricting mobility and impeding access to coastal resources along local transportation corridors.
The TREP/PWP recognizes that constructing new transportation corridors or new general-purpose lanes to meet travel demand would not solve the highway capacity deficiency without affecting adjacent communities, lagoons and habitat areas. To address the highway capacity deficiency in the corridor in a way that would provide the most benefit to coastal access and natural resources while meeting regional travel demand, TREP/PWP facility improvements are planned to accommodate more travelers (i.e., more people), more efficiently, and with minimal facility expansion (footprint) when compared to other transportation alternatives.
To increase capacity and reduce congestion on I-5, proposed TREP/PWP improvements focus on HOV and Managed Lanes, which will provide significantly more person-carrying capacity per lane than a general-purpose lane (carrying roughly 70 percent more people than one general-purpose lane) by promoting carpool, vanpool, and other transit alternatives to SOVs in the corridor. In addition, as the primary means for the public to reach shoreline access points and upland recreational areas in the NCC, the proposed high occupancy and Managed Lanes will specifically serve the visitor and recreational travelers in the NCC, which constitute up to 50 percent of weekend HOV traffic on some sections of I-5.
Toll-paying SOVs would be permitted to access Managed Lanes only when capacity exists, generating revenue to fund corridor transit operations and further reducing overall congestion on the highway for all users at appropriate times. However, the Managed Lanes strategy will preserve free-flow speeds and reliable travel times as the rest of the highway lanes become congested, providing unconstrained access to the coast for priority HOV and transit users. In addition to prioritizing visitor and recreational methods of travel on I-5, reduced traffic congestion on I-5 will alleviate the pressure of local communities to address and accommodate cut-through traffic on Coast Highway and other arterial streets that may otherwise be impacted as travelers search for alternate routes to a congested highway. Maintaining access along the I-5 corridor will also serve to maintain access along the various local coastal transportation corridors in the NCC, ensuring spill-over travel demand from I-5 does not impact local communities or precipitate improvements on local arterials which could impact the NCC's sensitive coastal resources.
Managed Lanes will accommodate future demand on I-5 by getting the most person-carrying capacity out of the least amount of highway footprint expansion, thereby reducing overall congestion on I-5 for all users, protecting and facilitating public access, and minimizing impacts to adjacent communities and sensitive coastal resource. Finally, as discussed further below, I-5 Managed Lanes will make possible new and expanded public transportation opportunities in the NCC by prioritizing and ensuring reliable travel for buses and other HOVs, and I-5 infrastructure improvements will provide new opportunities to enhance pedestrian and bicycle coastal access facilities, all of which will provide alternative means of coastal access in the NCC and further reduce demand on I-5.
7.2 Alternative Transportation Options
The lack of adequate transit service and other alternative transportation modes to access the beach and upland coastal recreation areas is also a recognized impediment to public access. Directly linked to the region's objectives to provide transportation flexibility and ensure the movement of people rather than vehicles are Coastal Act policies which direct protection and enhancement of public access and recreation opportunities by (1) facilitating the provision or extension of transit service, (2) providing non-automobile circulation, (3) providing adequate parking facilities or serving new development with public transportation, and (4) assuring the potential for public transit for high intensity uses.
In addition, the Coastal Act recognizes the benefits of providing transportation choices for all people to not only coastal public access and recreation, but also as a means of reducing vehicle miles traveled, energy consumption and greenhouse gas emissions, and thus curtailing the effects of global climate change. While the implementation of Coastal Act policies is limited to addressing development activities affecting coastal resources in the Coastal Zone, climate change is a coastal resource issue driven by land use and transportation activities that extend well beyond the boundaries of the NCC and the region. In this regard, Coastal Act policies which address reducing vehicle miles traveled and energy consumption through provision of transit in the Coastal Zone are supported by the region's transportation objectives to ensure the NCC's transit-focused transportation system is effectively integrated into the regional, state, and national system, and that transportation investments in the NCC complement the region's commitment to providing the greatest possible mobility project benefits per investment. Investing available funds in transportation improvements that will support transportation solutions across jurisdictional boundaries, and which will facilitate smart growth practices that maximize mobility at the regional level, is the best means of reducing vehicle miles traveled and energy consumption in the region to help achieve state-mandated GHG reductions, and thus support efforts to address the effects of global climate change on coastal resources.
Rail
As described in Section 3.0, passenger rail services along the LOSSAN rail corridor are currently constrained by infrastructure that is undersized for the volumes of traffic it accommodates. Currently, about half of the 27-mile rail corridor consists of single track, which greatly constrains the movement of trains through the corridor, causing other trains to stack at each end of single track, thus resulting in delays and reducing the attractiveness of rail as a travel mode choice and as an alternative means of access to coastal resources. Since travel time and reliability are among the most important factors in the public's choice of transportation modes, longer and uncertain travel times currently make rail a less-attractive travel option in the NCC.
Rail improvements that increase capacity, reduce travel time, increase reliability, and provide new service area opportunities, are readily recognized as major contributors to protecting and enhancing access to the coast. Overall improvement of rail service is expected to attract more users. While new rail customers will certainly include some visitors and recreationists accessing coastal destinations, Section 2.2 explains the majority of new users are expected to consist of commuters and longer-distance travelers with predictable trips. As these customers are most effectively served by transit in the NCC, planned enhancements to the NCC rail corridor will increase the transit mode share for commuters and longer-distance travelers, thus relieving congestion and reserving capacity on I-5 for other users, including visitors and recreational travelers which are not easily served with transit and rely primarily on I-5 to access the San Diego coastline.
Access to rail stations is another component of ensuring maximum use of rail service to meet the NCC's travel demands. As discussed in Section 3.2, approximately 80% of NCC COASTER commuters arrive at the station by car. Although driving and parking are the primary means of accessing the LOSSAN rail corridor, parking availability is constrained at stations. On average, all of the station parking lots, except Oceanside, are at or exceed, capacity by 8:00 a.m., thereby inhibiting many potential passengers from using rail corridor services.
Proposed TREP/PWP improvements for the LOSSAN corridor would contribute substantially to enhancing mobility throughout the NCC by increasing and improving rail service, providing new rail service at Del Mar Fairgrounds, and supplementing parking supply at rail stations for new customers. The Del Mar platform–currently planned to operate only seasonally–would provide new access opportunities to the beach, San Dieguito River Park, and Del Mar Racetrack and Fairgrounds, one of the region's most popular tourist destinations. Planned access improvements to rail stations also include pedestrian and bicycle access. Opportunities to overcome pedestrian and bike access impediments to transit stations and coastal activity centers are the subject of a focused study and will be presented separately.
BRT, Rapid Bus and Ride-Share
Traffic congestion on I-5 presently discourages many potential bus transit and ride-share options as these modes of travel are subject to the same traffic congestion that SOVs experience on freeway main lanes. As highway deficiencies associated with increased travel times and reductions in reliability continue to worsen, these alternative modes of transportation become significantly less desirable and, especially with BRT, infeasible.
The addition of Managed Lanes for I-5 will serve as an essential enabler of public transportation. Planned improvements will provide incentives for people to shift from SOV to public transit and ridesharing where these vehicles would have direct access to the uncongested HOV/ Managed Lanes where reduced travel times and reliability are assured.
The NCC currently does not have BRT or Rapid Bus service. Implementation of these types of transit improvements is planned in the corridor over the next forty years, with successful BRT wholly dependent on the implementation of the I-5 Managed Lanes. The BRT planned for the I-5 Managed Lanes targets the peak-period commute trip between the high-density Mid City residential area in central San Diego and the Palomar Airport Road business park in the NCC. As with planned rail service improvements, BRT will serve to relieve congestion and reserve capacity on I-5 for other users, including visitors and recreational travelers which are not easily served with transit. Rapid Bus service is planned for Coast Highway through the NCC. The planned service will provide a higher-quality local transit option to complement the existing network of local bus routes in the corridor, further increasing regional mobility and alternative access to coastal areas for residents and visitors alike.
The region's Transportation Demand Management (TDM) strategies have been and will continue to be another critical element for increasing transit and reducing travel demand in the corridor by encouraging the use of the bus, carpooling, and other alternative modes. In addition to offering ride-matching services, vanpool subsidies, and other incentives offered through SANDAG's iCommute program, TDM strategies may include financial assistance from employers for taking transit, allowing alternative work schedules (i.e., "flex time"), and providing opportunities for teleworking from home. I-5 Managed Lanes is a necessary element to successfully implementing many TDM strategies, particularly those focused on shifting SOV travelers to the bus, vanpool and carpooling. When implemented together, Managed Lanes and TDM strategies will work to remove obstacles and provide incentives to travelers to make the shift from single-occupant driving, thereby reducing trips and congestion on I-5.
Future Transit for High-Intensity Uses
Section 6.0 describes the inherent limitations to the effectiveness of transit alone to meet future travel demand in the NCC, which is based less on insufficient transit service and more on the physical arrangement of the corridor's employment, land use, and population patterns. Nonetheless, the region is aggressively planning to accommodate future population growth while reducing travel demand through the provision of transit for the benefit of all who live, work and recreate in the NCC.
To accommodate projected population growth, SANDAG and local governments have implemented a "Smart Growth" land-use strategy that seeks to increase population density in specific areas, reduce vehicle miles traveled, and curb greenhouse gas emissions. "Smart Growth" policies encourage transit-friendly development patterns by concentrating development in areas with sufficient public services and promoting more trips by foot, bike, and transit, with correspondingly less reliance on the automobile. The NCC contains over 15 of these Smart Growth opportunity areas, the majority of which are located in community cores near COASTER and SPRINTER transit stations.
Planned "Smart Growth" areas in the NCC will go a long way toward concentrating populations near rail stations but will be unable to transform the existing, much more far-reaching land use patterns into a broader transit-supportive environment, which would require a tripling of residential densities and redeveloping communities throughout the NCC and Coastal Zone with more walkable, grid-like, better connected local street networks. However, "Smart Growth" is the most sustainable means of accommodating future growth in the NCC, and the 2050 RTP includes significant investment in LOSSAN rail, BRT, Rapid Bus, and local bus service in the corridor to accommodate this growth near stations and along transit routes with a goal of increasing the transit peak-period commute mode share from 2-3% to 10-15% (over a 400% gain from 2010), an ambitious target given the NCC's inherent limitations to transit effectiveness.
The proposed TREP/PWP includes transportation and transit infrastructure and service improvements intended to specifically serve planned "Smart Growth" areas to help avoid increased traffic congestion, reduced mobility, and a deteriorating quality of life. By planning for higher-density growth in the already developed corridor, implementing improvements to increase ridership on the existing LOSSAN rail corridor, and adding I-5 Managed Lanes that encourage HOVs and transit, the region will encourage concentrated growth patterns in which travel demand can be more readily accommodated.
Parking and Public Transportation
Adequate parking facilities in coastal areas necessary to serve residents, commercial uses and visitors who travel by car is an important variable that influences public access and recreation opportunities in the Coastal Zone. Where parking is not feasible, substitute means of access such as public transportation, pedestrian and biking facilities are necessary to access the coast. The TREP/PWP includes implementation of various public transportation service improvements to protect and enhance public access in the NCC, including rail, BRT and rapid bus.
Providing access to transit, supported by ample parking resources, walking and bike facilities is an important component of ensuring maximum use of rail service to meet the NCC's various travel demands and coastal access needs. In addition, as the majority of rail stations in the NCC are located just blocks from the beach, constrained parking resources have the potential to result in overflow parking by train passengers onto adjacent streets, which could displace parking resources used by people to access the coast by automobile. However, where adequate parking supply does occur, these parking resources could also be used to support access to nearby beaches and recreation areas.
Proposed TREP/PWP improvements include expanding parking areas at the corridor's transit stations, which would support passenger rail service and reduce the possibility of conflicts between rail passenger and coastal access parking resources on adjacent streets.
Non-Automobile Circulation and Enhancement of Recreational Facilities
The Coastal Act recognizes the necessity and benefit of providing varied transportation choices for all people, including alternative transportation modes that are not reliant on the automobile. These choices include not only transit but also active transportation modes such as walking and biking. Well planned, non-motorized transportation networks can bridge the gap between origins or destinations and the transit system, addressing the classic "last mile" problem for transit users. In addition, pedestrian and bike facilities create attractive transportation links between land uses that draw travelers out of their automobiles when making short, local trips and when seeking access to coastal resources. Providing pedestrian and bicycle access to the shoreline and upland recreation areas is one of the highest priorities of the Coastal Act.
The Coastal Rail Trail provides coastal access to the length of the NCC primarily on a bicycle facility. The California Coastal Trail also provides coastal access to the length of the NCC along various shorelines and inland routes. Both of these regionally significant trails are developed to varying levels, with east-west access to the trail corridors occurring along the primary and secondary bicycle and pedestrian routes that cross over the I-5 and LOSSAN corridors. The east-west access routes are limited and contain gaps due to topographical, transportation facility, and environmental barriers. Many bicycle and pedestrian routes traverse highway overpasses and rail crossings where facilities narrow and the quality degrades. Local roads cross I-5 in the east-west direction 37 times in the corridor, and most of these are nonstandard bicycle and pedestrian crossings. As a result, it is difficult to make local trips and gain access to the shoreline and regionally significant coastal trails using these bicycle and pedestrian routes.
A fundamental element of the TREP/PWP is that it will improve bicycle and pedestrian routes and trails which would enhance the network and provide access to the NCC's transit stations, beaches, lagoons, open spaces, and coastal communities. Existing fragmented access routes and trails of the network would be upgraded and completed, eliminating barriers and gaps to provide safe, non-automobile circulation to and from coastal recreation areas while creating new recreational opportunities.
Beneficial impacts on coastal access and recreation would result from highway improvements that include reconstructing under- and overpasses to better connect and improve bicycle and pedestrian access routes to the coast. These improvements would address travel-user separations to provide a more comfortable travel environment for pedestrians and bicyclists to further encourage these modes of travel across I-5 between inland and coastal areas, and in certain instances, would provide a connection to regional corridor Class I and Class II bicycle facilities accessed throughout the NCC. These improvements would improve travel choices and substantially enhance recreational opportunities in the corridor by completing linkages between communities, inland and coastal areas, and providing access opportunities to the NCC's regionally significant natural resource and recreation areas. Planned access improvements to rail stations also include the elimination of pedestrian and bicycle access barriers and the inclusion of other facility enhancements.
The NCC's new and enhanced access routes across lagoons would be similarly integrated into highway improvements. These access improvements would serve to meet a primary goal articulated in the state-mandated, Coastal Commission-supported Completing the California Coastal Trail report: "Create linkages to other trail systems and units of the State Park system, and use the Coastal Trail system to increase accessibility to coastal resources from urban population centers."37 TREP/PWP implementation would provide and connect several threads within the coastal trail system between inland and coastal communities to access the shoreline, lagoons and upland recreation, thus helping to achieve the goals of the California Coastal Trail.
Considering the significant alternative transportation options planned for the NCC, the TREP/PWP would maximize public access recreation opportunities throughout the corridor consistent with public safety needs by:
Improving public transportation infrastructure to support more frequent, attractive, and reliable rail, BRT and rapid bus service, resulting in increased transit ridership and reduced traffic congestion that would otherwise adversely affect the ability of the public to reach the coast along this primary coastal access corridor.
Improving and integrating transit services with other non-automobile modes of travel within the corridor to increase ridership and reduce traffic congestion that would otherwise adversely affect public coastal access.
Facilitating and encouraging non-automobile transportation with new and improved multimodal improvements that would provide access to the coast and recreation areas with alternative modes of transportation (trails, bike paths, and transit). The TREP/PWP projects will add and improve sidewalks and bicycle lanes at highway and rail crossings throughout NCC communities, providing access to coastal amenities including the Coast Highway, the Coastal Rail Trail, and the California Coastal Trail. This will effectively eliminate bicycle and pedestrian barriers, and provide enhanced connections with public transit centers, thereby promoting access to transit.
Creating and enhancing pedestrian access to other natural resources including lagoons and adjacent upland areas via trail and bicycle improvements throughout the corridor.
8.0 Conclusion
The multi-modal projects planned in the TREP/PWP aim to achieve both transportation and coastal goals in the North Coast Corridor. The NCC will get necessary infrastructure improvements–not just for roads and highways, but also for transit, bicycle, and pedestrian facilities–that will allow it to accommodate substantial future growth. Community enhancement projects will restore and preserve vital coastal areas, taking advantage of funding that would otherwise be unavailable. Most importantly, increased mobility throughout the NCC will increase coastal access for both residents and visitors.
The TREP/PWP is only one part of a larger planning framework for the San Diego region. Balancing the needs of the region against the dual constraints of scarce funding and environmental mandates, SANDAG has devised a Regional Transportation Plan that invests $112 billion in mobility solutions through 2050. The NCC will benefit from LOSSAN rail corridor expansion, and new Rapid Bus and BRT services that will provide significant increases in capacity and travel options for corridor commuters, residents and visitors. The corridor's land-use patterns and regional employment concentrations, as well as the wide diversity of travelers, trip purposes, and origins/destinations, require a multi-modal solution.
The addition of Managed Lanes to I-5 is a key element of this multi-modal solution to meet future demand in the NCC. The Managed Lanes represent the smallest expansion option for I-5 considered by SANDAG during the environmental review process, and they achieve the most efficient capacity increase by prioritizing the movement of people in the NCC, rather than simply moving vehicles. Only this kind of balanced, integrated, multi-modal approach in the North Coast Corridor can provide the range of transportation options necessary to meet the varied travel and mobility needs in the San Diego region.
Appendix A: NCC Bus and Rail Service Map
Appendix B: SANDAG Smart Growth Concept Map
Appendix C: Regional Employment Share by Community and City, 2008 and 2050
Communities with at least one percent of regional employment in 2008 and/or 2050 are included in the table. All other communities not listed have less than one percent of regional employment in 2008 and/or 2050. Most communities are projected to lose employment share by 2050.
Source: SANDAG, Series 12 Regional Growth Forecast. * City of San Diego and County of San Diego communities with 1.0% or more of regional job share in 2008 and/or 2050. ** Cities with 1.0% of more of regional job share in 2008 and/or 2050. Some cities include community data.
Number of Jobs 2008
Number of Jobs 2050
Change
Percent of Regional Share 2008
Percent of Regional Share 2050
Increase in Regional Share
Communities*
Otay Mesa
14,360
51,110
36,750
1.0%
2.6%
1.59
Otay
2,828
15,385
12,557
0.2%
0.8%
0.58
Navajo
21,190
29,402
8,212
1.4%
1.5%
0.10
Lakeside
14,205
19,204
4,999
0.9%
1.0%
0.01
Rancho Bernardo
20,786
26,532
5,746
1.4%
1.3%
-0.06
Peninsula
15,126
18,589
3,463
1.0%
0.9%
-0.10
College Area
15,184
17,785
2,601
1.0%
0.9%
-0.10
Torrey Pines
,15,801
17,791
1,990
1.1%
0.9%
-0.20
Linda Vista
16,672
18,379
1,707
1.1%
0.9%
-0.20
Midway/Pacific Hwy Corridor
21,416
24,070
2,654
1.4%
1.2%
-0.23
La Jolla
21,196
23,271
2,075
1.4%
1.2%
-0.25
Cariemont Mesa
22,447
24,891
2,444
1.5%
1.2%
-0.25
Uptown
29,361
34,046
4,685
2.0%
1.7%
-0.26
Mission Valley
52,551
64,920
12,369
3.5%
3.2%
-0.26
Pendleton-De Luz
30,959
35,459
4,500
2.1%
1.8%
-0.29
Palomar Airport Road
13,052
19,020
5,968
1.3%
0.9%
-0.32
Downtown San Diego
78,614
95,780
17,166
5.2%
4.8%
-0.46
Mira Mesa
76,172
91,111
14,939
5.1%
4.5%
-0.53
University
90,300
108,547
18,247
6.0%
5.4%
-0.60
Keany Mesa
87,331
104,303
16,972
5.8%
5.2%
-0.61
Cities**
Carlsbad
61,999
87,100
25,101
4.1%
4.3%
0.22
Chula Vista
70,230
121,555
51,325
4.7%
6.1%
1.39
Coronado
27,994
33,251
5,257
1.9%
1.7%
-0.20
El Cajon
41,686
58,630
16,944
2.8%
2.9%
0.15
Encinitas
26,985
31,481
4,496
4.1%
1.6%
-0.23
Escondido
61,143
75,004
13,861
1.8%
3.7%
-0.33
La Mesa
27,579
32,018
4,439
1.9%
1.6%
-0.24
National City
28,743
37,668
8,925
2.9%
1.9%
-0.03
Oceanside
43,977
67,410
23,433
2.1%
3.4%
0.44
Poway
31,176
41,005
9,829
2.5%
2.0%
-0.03
San Marcos
37,383
61,585
24,202
1.0%
3.1%
0.58
Santee
15,304
26,554
11,250
2.8%
1.3%
0.31
Vista
41,315
61,293
19,978
3.1%
0.31
Subtotal
1,175,065
1,574,149
399,084
Remainder of Region
326,015
428,889
102,874
Region Total
1,501,080
2,003,038
501,958
Appendix D: 2050 RTP Housing Density Maps
(Separate Attachment from 2050 RTP)
Notes
TREP/PWP Chapter 3.
U.S. Department of Transportation Press Release, September 10, 2007.
Draft 2050 Regional Transportation Plan, Technical Appendix 7, p. 7-19.
TREP/PWP Chapter 2B, pg 2-24.
San Diego Convention and Visitors Bureau, 2006 Visitors Profile Study (Table 3-6 in Draft TREP/PWP).
Compiled from press releases by Legoland, San Diego County Fair, and Del Mar Thoroughbred Club.
TREP/PWP Chapter 2, pg. 2-25.
Draft 2050 RTP, page 6-36.
San Diego and Imperial Valley Gateway Study: Comprehensive Freight Gateway Study. March 2010.
Model data from Caltrans, furnished by Maurice Eaton Sep 29, 2011.
TREP/PWP Chapter 2, pg. 2-24.
TREP/PWP Chapter 3, pg. 3-4.
TREP/PWP Chapter 2B, pg. 2-24.
Ewing, Reid. 1996. Best Development Practices. Chicago: Planners Press.
SANDAG Series 12 Regional Growth Forecast/Urban Area Transit Strategy Policy Paper, September 2010.
SANDAG (Kim Kawada/Dave Schumacher/Danny Veeh); April 2011.
47,000 trips/12 hours a day = 3900 trips/hour. A freeway lane is at capacity at approximately 2000 trips/hour.
SANDAG 2009 Onboard COASTER Station Access Survey.
I-5 North Coast Corridor System Management Plan (CSMP), August 2010, Page 5-38.
SANDAG (Tom King); November 2011.
Metropolitan Transit Development Board (MTDB) TransitWorks Strategic Plan Report, January 2001.
The CARB-mandated GHG reduction targets apply only to cars and light trucks during weekday travel, using 2005 as the base year. While reductions are desired for all vehicle classes, only this single class is included in the performance measure.
U.S. Census American Community Survey, 2009.
For consistency in Table 8, this figure only includes the city of San Diego. As noted above, SANDAG data breaks this down further, revealing a 2-3% transit mode share for the entire San Diego region, and a 5% transit mode share for the SANDAG-defined urban area.
Managed Lane capacity is generally 1700 vehicles/hour * 2 people/vehicle = 3400 people/hour. General-purpose lane capacity is generally 2000 vehicles/hour * 1 person/vehicle = 2000 people/hour. 3400/2000 = 170%.
CSMP, Chapter 2, pg. 2-5, 2-6.
Caltrans staff estimate.
Managed Lane capacity is generally 1700 vehicles/hour * 2 people/vehicle = 3400 people/hour. General-purpose lane capacity is generally 2000 vehicles/hour * 1 person/vehicle = 2000 people/hour. 3400/2000 = 170%.