
Division Spotlight: TAM monitors Caltrans’ performance, goals
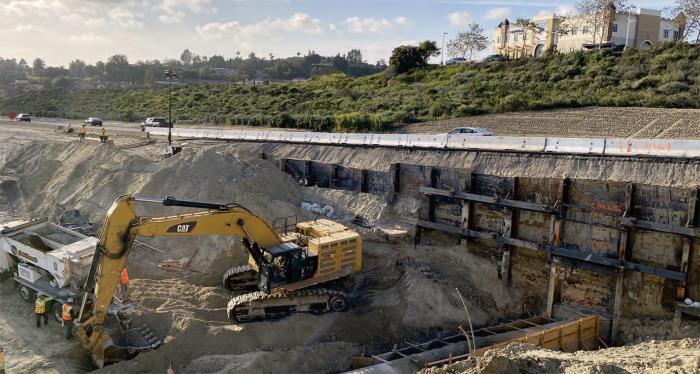
Caltrans photograph
Transportation Asset Management refreshes 10-year plan to address anticipated needs
Welcome to a new series that will continue in future issues of Mile Marker. These stories will examine, in a nuts-and-bolts way, a specific Caltrans program. We begin our series with Transportation Asset Management.
Perhaps as much as – if not more than – any program within Caltrans, Transportation Asset Management (TAM) takes a big-picture look at the department. TAM conducts analyses of transportation asset inventory, current condition and performance levels to objectively measure past performance and plot a clear-eyed course for the future.
The department’s website describes TAM as “a strategic and systematic process of operating, maintaining, upgrading and expanding physical assets effectively throughout their life cycle. It focuses on business and engineering practices for resource allocation and utilization, with the objective of better decision making based on quality information and well-defined objectives.
“Advancing Asset Management across an organization requires self-assessment, alignment, goal setting and support."
Caltrans is divided into 12 regional districts. Each one of these districts is unique in terms of environment and topography. “They have different inventory,” Johnson explains in the video. “Some have transportation assets that are newer, some have transportation assets that are older.
In April, TAM described itself in a more-detailed way by uploading a video on YouTube. Here are some of the presentation’s key points, as made by Michael B. Johnson, State Asset Management Engineer.
“We’ve got coastal communities, we’ve got mountainous communities, we’ve got desert communities. We have very affluent areas, we have very disadvantaged areas. So the state is very, very diverse.”
Because some of the districts are bigger than some smaller U.S. states, Caltrans decided that a “more granular performance-based asset-management plan was needed.”
At the top of Caltrans’ TAM approach is the California Transportation Asset Management Plan (TAMP). The document covers a 10-year period, and it is updated every four years. The most recent TAMP, which applies through the 2031-2032 fiscal year, is downloadable from this Caltrans webpage.
“In this plan,” Johnson says, “we are looking at portions of the Caltrans-owned highway system, but not all of it, and we’re looking at portions of the locally owned transportation system that is part of the national highway system.”
Local ownership of the National Highway System (NHS) is greater in California than in any other state. In terms of pavement, for example, 35 percent of the NHS is owned or managed by cities and counties and 65 percent by Caltrans. Bridges, conversely, are 90 percent owned by Caltrans and 10 percent by cities and counties.
There are four primary asset classes: Pavement and bridges (which are federal requirements), culverts and Transportation Management Systems (TMS) elements.
Below the TAMP in TAM’s approach is the State Highway System Management Plan (SHSMP), which includes 33 different performance objective areas. Those areas include matters related to asset condition such as pavement and bridges, but also safety performance, delays, climate resiliency and bicycle and pedestrian needs.
Analyses within SHSMP are done at the district level, which means that with all dozen districts taking stock on 33 areas, in total there are nearly 400 performance gap analyses.
Johnson explains that there are three types of performance models.
- The Physical asset model (dealing with inventory, its condition and predictable deterioration – “anything that you can go out into the field and touch with your hand,” Johnson says). Examples include pavement, bridges, drainage components, TMS plus also highway pump plants, overhead sign structures, roadside rest areas, buildings such as maintenance shops and laboratories.
- The deficiency model (non-condition-based issues such as safety, climate resiliency and stormwater.) “Safety itself is not a physical asset,” Johnson elaborates. “It doesn’t deteriorate. But we do know that we want to set targets for safety improvement, which is measured, in our case, by reducing fatal and serious injuries.”
- The reservation model. The winter of 2022-2023, an unrelenting parade of winter storms caused over $1 billion in damage to the state’s highway system. Caltrans “has to reserve some funding for things that we can’t predict” Johnson says. “We don’t know when they’re going to occur, and we don’t know where they’re going to occur, but history has shown us that they do occur. So we look at prior years’ expenditures in these areas to develop a reservation of funding that can be utilized throughout the year as these unpredictable things happen.” (Examples include earthquakes, fires and slides.)
To get the various analyses within TAM underway, Headquarters gives each of the 12 districts a specific set of performance goals, or preferred outcomes. They would include numbers such as how many fatal and serious injuries a district needs to reduce, how many lane miles of pavement it needs to rehabilitate, or how many square feet of poor-condition bridges it needs to rehabilitate or replace.
“We do this for all 33 objectives, and we give each of our District Directors a single budget to do that,” Johnson says. “Our districts then have to develop projects that achieve all that performance within the budget that’s defined. They have to live within a constrained budget. And if they do this, we are guaranteed that the projects that come forward will meet the performance objectives that were established.”
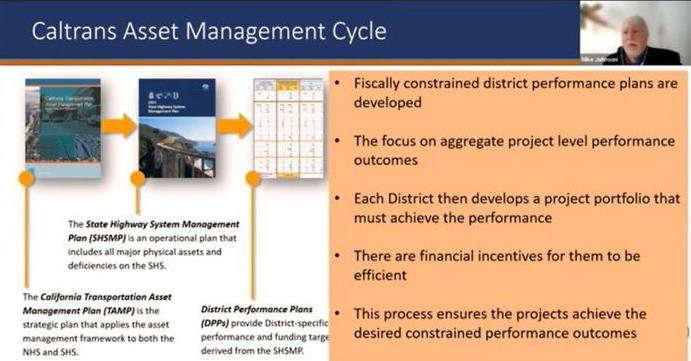
Caltrans video screenshot
Following the TAMP and SHSMP, the Caltrans Asset Management Cycle proceeds to District Performance Plans (DPPs), which identify the inventory, current condition or performance levels, quantification of the pipelined performance, and targets for the last five years of the 10-year plan period and a target project portfolio budget.
The projects developed feed the State Highway Operation and Protection Program (SHOPP) 10-Year Project Book online dashboard. This public-facing dashboard (projectbook.dot.ca.gov), stemming from the DPPs, establishes a 10-year portfolio of projects to meet targets set forth in the TAMP and SHSMP. It is certified every quarter. The online format includes search and download functions that ease navigation for users.
The cycle continues with a four-year SHOPP project portfolio that goes to the California Transportation Commission (CTC) for authorization of funds. Finally, the Performance Benchmark Report is compiled and presented to the commission every June to track progress and provide transparency to the public.
“Risks are part of this performance-based approach,” Johnson says. “When we implemented this, the culture really shifted in Caltrans. I’ve been with the department for a long time, and I know, many years it was about, ‘Well, you have a budget. Did you spend your money?’ Nobody talks like that at Caltrans anymore. What they talk about is, ‘Did you achieve your performance?’ … Performance is in the front seat; budget is in the back seat.”
To sum up the overall role of Asset Management, Johnson says that TAM stresses transparency, encourages public input, pursues equity and incorporates community pride into projects.
Find out more by visiting TAM’s homepage.
Source: Michael B. Johnson, State Asset Management Engineer